Abstract
The purpose of this study is to systematically evaluate the usefulness of Positron emission tomography/Magnetic resonance imaging (PET/MRI) images in a clinical setting by assessing the image quality of Positron emission tomography (PET) images using a three-segment MR attenuation correction (MRAC) versus the standard CT attenuation correction (CTAC). We prospectively studied 48 patients who had their clinically scheduled FDG-PET/CT followed by an FDG-PET/MRI. Three nuclear radiologists evaluated the image quality of CTAC vs. MRAC using a Likert scale (five-point scale). A two-sided, paired t-test was performed for comparison purposes. The image quality was further assessed by categorizing it as acceptable (equal to 4 and 5 on the five-point Likert scale) or unacceptable (equal to 1, 2, and 3 on the five-point Likert scale) quality using the McNemar test. When assessing the image quality using the Likert scale, one reader observed a significant difference between CTAC and MRAC (p=0.0015), whereas the other readers did not observe a difference (p=0.8924 and p=0.1880, respectively). When performing the grouping analysis, no significant difference was found between CTAC vs. MRAC for any of the readers (p=0.6137 for reader 1, p=1 for reader 2, and p=0.8137 for reader 3). All three readers more often reported artifacts on the MRAC images than on the CTAC images. There was no clinically significant difference in quality between PET images generated on a PET/MRI system and those from a Positron emission tomography/Computed tomography (PET/CT) system. PET images using the automatic three-segmented MR attenuation method provided diagnostic image quality. However, future research regarding the image quality obtained using different MR attenuation based methods is warranted before PET/MRI can be used clinically.
Keywords: PET/CT, PET/MRI, FDG, attenuation correction, image quality, hybrid imaging
Introduction
PET/MRI is a promising, multimodality imaging technique that combines two core instruments in the field of molecular imaging into one. The PET component delivers metabolic information with a high sensitivity, whereas MRI, with its superior soft-tissue contrast, is valuable for morphological imaging providing high-resolution images [1,2]. Recent advances in MRI for performing sophisticated sequences such as diffusion-weighted imaging (DWI) and used as a measure of cellularity, and dynamic contrast-enhanced MRI for depicting tumor perfusion as well as tumor neovascularization, have expanded the possibilities of using this technique for functional imaging [3-5]. In order to use PET/MRI in the clinical setting, various technical challenges had to be overcome [6,7], This includes major changes required in the hardware and software components used in PET/MRI. One hardware problem is the possible interference of both technologies with each other, and thus requiring novel solutions [8-10]. The new PET detector technology which is now available offers avalanche photodiodes which do not interfere with magnetic fields and are now being used rather than conventional photomultipliers for PET/MRI systems [11-14]. One of the primary software challenges is the MR attenuation correction. Many different approaches have been suggested to solve the attenuation correction problem using the current hybrid PET/MRI scanners [15-21]. MR attenuation correction for whole-body applications is particularly difficult as it requires the transformation of inhomogeneous signal intensity MR images into PET attenuation maps [22,23]. In the currently used PET/MRI scanners, the segmentation-based methods have a short acquisition time and are technically relatively uncomplicated [24-27]. The only commercially available attenuation correction methods currently available are: (I) Philips® three segment (air, soft tissue, and lungs) attenuation correction algorithm [1,28] and (II) Siemens® four segment (air, soft tissue, fat, and lungs) attenuation correction algorithm [1,29]. The three-segment approach was first assessed in 15 subjects by applying a free–breathing, whole-body, MR 3D, T1–weighted, spoiled gradient echo sequence which was able to distinguish the three segments, i.e. air, lung, and soft tissue [1]. The ability of the Dixon to provide four, different sets of images, i.e. in-phase, out-of-phase, water only, and fat only, allows further differentiation of the soft-tissue component into fatty and non-fatty tissue [3,6]. For MR attenuation correction purposes, the Dixon method was used as whole-body imaging and was able to further separate soft and fat tissue [8]. In these MR attenuation correction methods, as bone is not considered this may lead to quantitative errors of 15-20% compared to those seen in the standard, CT-based attenuation correction methods [11,13]. Ultrashort echo time (UTE) sequences alone or in combination with a third echo were suggested in order to represent bone in the MR attenuation map [15,18,20].
Artifacts based on CT attenuation correction are well known from literature [22]. The routinely performed CT attenuation correction approach may lead to linear artifacts mimicking fluorodeoxyglucose (FDG) uptake when the CT contrast agent used accumulates in the venous system or when a patient’s body has a metallic object such as an orthopedic device [24,26,27]. Focal artifacts may result from calcified lymph nodes and which may lead to incorrect therapy decisions [28]. Such focal artifacts can propagate into the PET image, thus compromising imaging quality and affecting image interpretation.
Using PET/MRI for determining clinical indications, the MR attenuation correction scan must be of a high quality as it is used as an anatomic localizer. This quality prerequisite must be fulfilled before using PET/MRI qualitatively in terms of lesion localization and quantitatively in terms of standardized uptake value (SUV) measurements obtained in the clinical setting.
The purpose of this prospective, randomized study is to systematically assess the quality of the PET images obtained using automatic three-segment MRAC vs. those using CTAC and to thus evaluate the usefulness of PET/MRI images in the clinical setting. We used the previously published method for MRAC, and which automatically generates attenuation maps from MRI performed using a dedicated, T1-weighted technique, previously described in the literature [1].
Materials and methods
Patients
Forty-eight patients (mean age 59±14 years; 24 males, 24 females) were enrolled in our prospective, PET/MRI attenuation correction study between February 2012 and June 2012. These patients first underwent routine, clinical FDG-PET/CT scanning (average scanning time after injection 66±7 min; range 56-87 min) and then underwent an FDG-PET/MRI examination (average scanning time after injection 120±16 min; range 93-162 min). The Health Insurance Portability and Accountability Act (HIPAA) compliant study was approved by the hospital’s Institutional Review Board (IRB). Each patient gave written informed consent prior to their image acquisition.
FDG PET/CT and PET/MRI techniques
In each patient an F-18 FDG PET/CT examination was performed on a current–generation, large-bore, time-of-flight PET/CT scanner (Philips Gemini TF PET/CT, Philips Healthcare, Andover, MA) according to the standardized protocol we previously described [30]. Prior to scanning, each patient fasted for at least six hours, after which they were given an injection of F-18 FDG (mean dose 11.9±1.7 mCi; range 9.1-15.0 mCi). Emission images were obtained in 8-9 bed positions with a time frame between 90 and 120 sec per position. The CTAC was derived from routine low-dose CT scans (120 kV, 100 mAs, slice thickness 5 mm, dose modulation, pitch 0.813). Following the PET/CT scanning, all patients underwent PET/MRI. The F-18 FDG PET/MRI examination was conducted using current-generation, time-of-flight PET combined with a high-field, 3.0T MRI system (Philips Ingenuity TF PET/MRI, Philips Healthcare, Andover, MA). Emission images were obtained in 8-9 bed positions with a time frame between 120 and 150 sec per position. MRI was performed using an integrated radio-frequency coil and using a multi-station protocol (slab size 6 cm, maximal field of view 46 cm). For the whole-body MRI, a 3D, T1-weighted, spoiled gradient echo sequence (TE 2.3 ms, TR 4 ms, 10-degree flip angle) was acquired, and MRAC was done based on the previously published automatic three-segment model which distinguishes air, lung, and soft tissue [1].
Image reading procedure and data analysis
The image analysis was conducted using commercially available software (MIM Version 5.2, MIM Software Inc, Cleveland, OH). Each patient had a torso non-attenuated corrected and a torso attenuated corrected PET/CT and PET/MRI image set. Study numbers were assigned to these two sets for each patient, and all of the patient-related data were deleted. Images were randomized, and the readers were blinded to all patient information and to whether the image pairs were derived from CTAC or MRAC. Three, nuclear radiologists (25, 12, and six years of clinical nuclear medicine and radiology experience, respectively) independently evaluated the image quality using a Likert scale (1: ‘extremely poor’ defined as “major artifacts exist and the images are not clinically useful”; 2: ‘poor’ defined as “major artifacts exist and clinical use is, therefore, not advised”; 3: ‘average’ defined as “borderline clinical use due to the image quality”; 4: ‘good’ defined as “containing minor artifacts which do not adversely affect the clinical use”; and 5: ‘excellent’ defined as “no artifacts”).
Statistical analysis
The difference in image quality scoring of CTAC and MRAC was evaluated using the Student’s two-sided, paired t-test for the data we derived using a Likert scale. P<0.05 was considered to represent a significant difference.
Based on clinical considerations regarding grouped sub-analysis image quality, scores 4 and 5 were considered “acceptable image quality”, whereas image quality scores 1 to 3 were grouped as “unacceptable image quality”. Intra-reader comparisons between MRAC and CTAC were based on a chi-squared test used to establish the symmetry of the rows and columns in a two-dimensional contingency Table foe analyzing this grouping analysis using the McNemar’s test. P<0.05 was considered to represent a significant comparison difference.
Statistical analysis was conducted with R (R Core Team 2012, Vienna, Austria) [31].
Results
Detection of artifacts
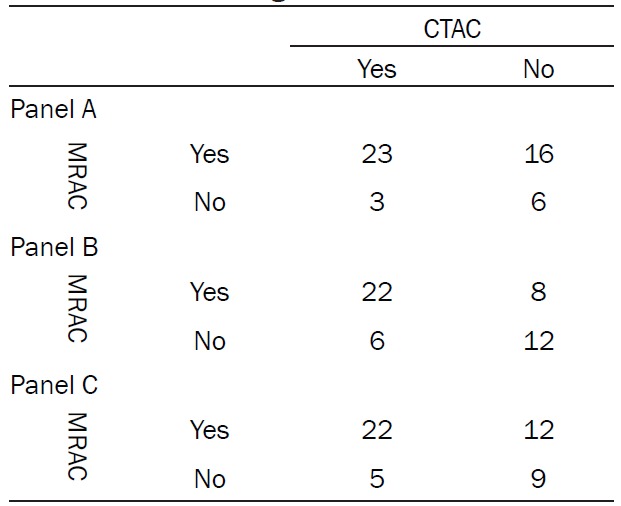
The prevalence of artifacts in CTAC as well as in MRAC for each reader, is shown in Figure 1 and the artifacts are listed in Table 1.
Figure 1.
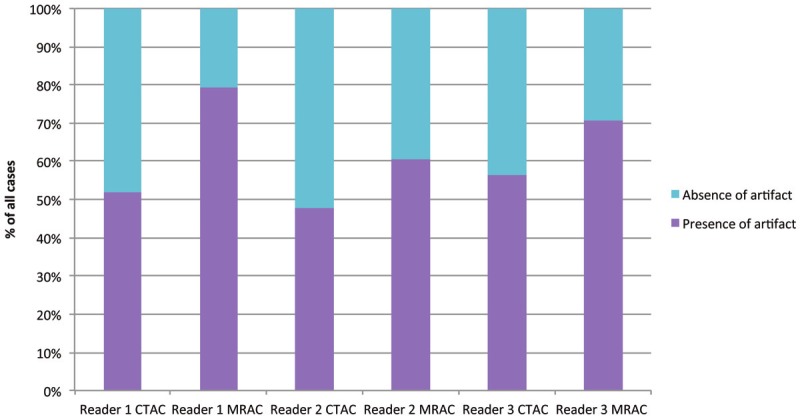
Distribution of the artifact prevalence in CTAC as well as MRAC for each individual reader.
Table 1.
2x2 table for reader 1 (panel A), reader 2 (panel B), and reader 3 (panel C) documenting the distribution of artifacts in CTAC and MRAC images
|
Analysis of image quality using a Likert scale
The representative image quality ratings are shown in Figure 2. The image quality analysis of CTAC and MRAC revealed a significant difference between them (p=0.0015) for reader 1, whereas for readers 2 and 3 there were no significant differences (p=0.8924 and p=0.1880, respectively) using a two-sided, paired t-test. The mean image quality values for CTAC and MRAC for each reader are shown in Figure 3. The numbers of patients who were ranked in the image quality categories 1 to 5 are shown over all readers in Figure 4.
Figure 2.
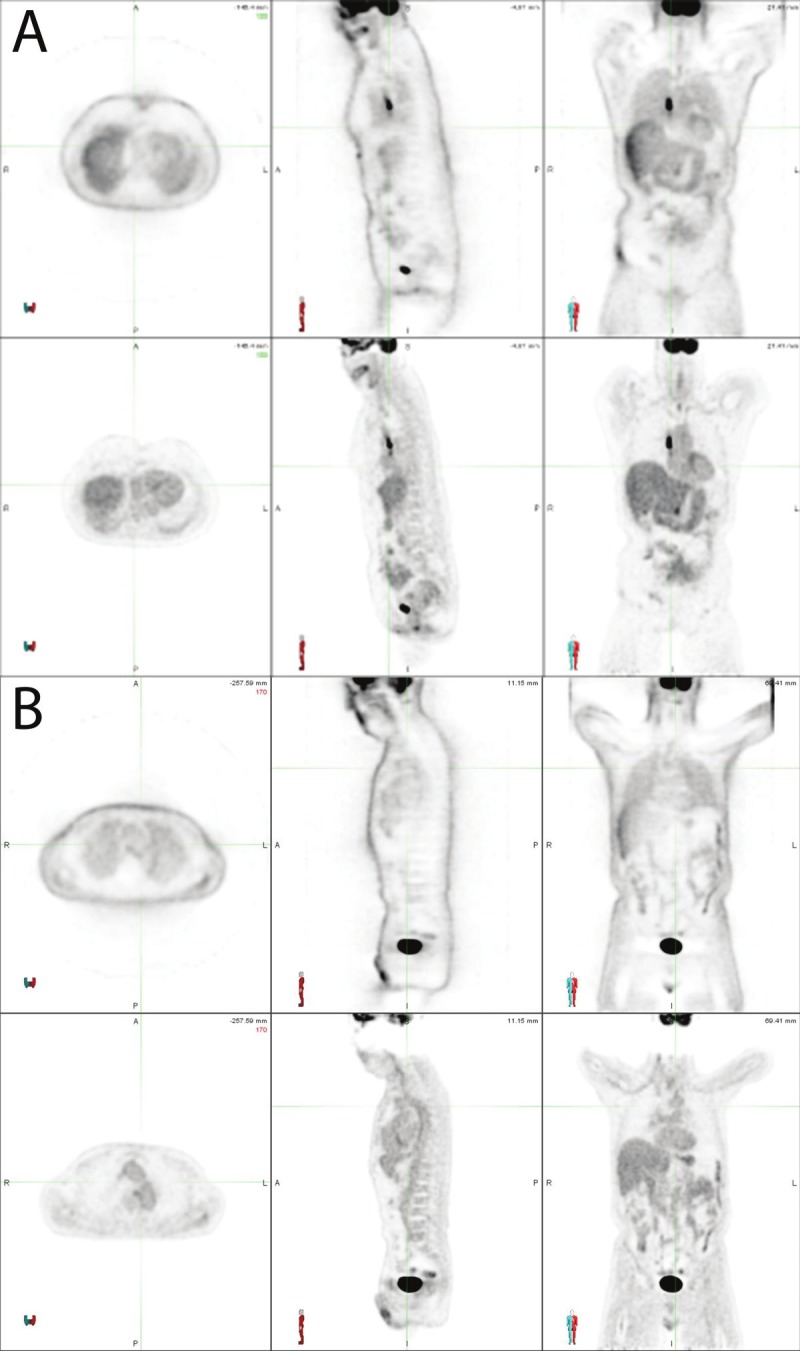
Representative image quality instances in MRAC using the Likert scale. In panel A an MRAC is shown which was rated as 5 on the Likert scale (meaning excellent defined as “no artifacts exist”). The upper row shows the non attenuation corrected image, whereas the lower row shows the attenuation corrected image. In panel B an MRAC is shown which was rated as 4 on the Likert scale (meaning good defined as “minor artifacts which do not affect clinical use”). Mild attenuation artifact across the neck is appreciated on this image. The upper row shows the non attenuation corrected image whereas the lower row shows the attenuation corrected image.
Figure 3.
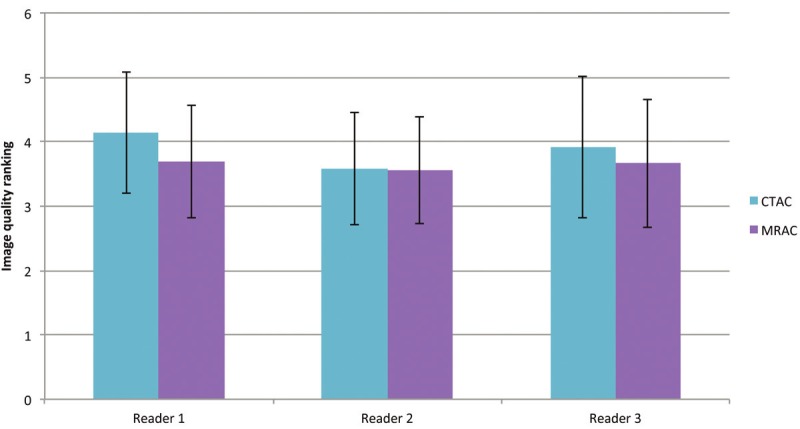
The mean image quality values for CTAC and MRAC are shown for each reader. The error bars indicate the standard deviation from the mean value. The mean value is calculated as an average from the scores assigned to each of the CTAC or MRAC images by each individual reader. A significant difference was found for reader 1 between CTAC and MRAC (p= 0.0015), whereas for readers 2 and 3 no significant differences were detected (p=0.8924 and p=0.1880, respectively) using a two-sided, paired t-test.
Figure 4.
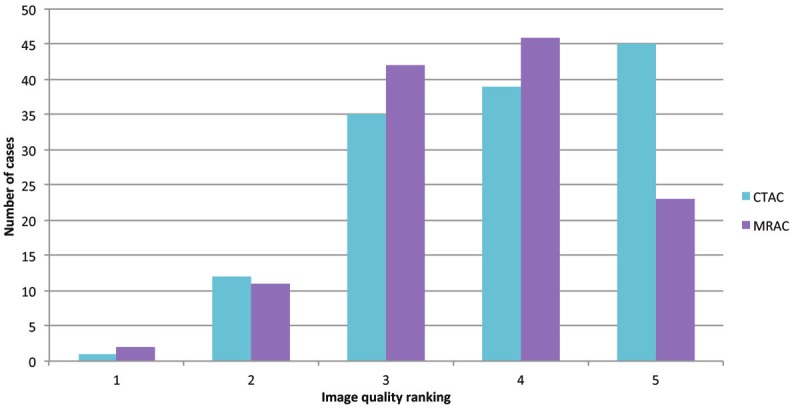
The number of cases ranked in according to the image quality categories 1 to 5 are depicted over all readers.
Analysis of image quality by grouping
The image quality analysis was performed by grouping the image quality scores into acceptable in the patients who were assessed as either 4 or 5 using the Likert scale or unacceptable (in the patients who were assessed between 1 and 3 using the Likert scale). Reader 1 reported 36 acceptable and 12 unacceptable cases with regard to CTAC concerning the image quality, whereas using MRAC there were 28 acceptable and 20 unacceptable cases with regard to the image quality. Reader 2 reported 28 acceptable and 20 unacceptable cases with regard to the image quality using both CTAC and MRAC. Finally, reader 3 reported 29 acceptable and 19 unacceptable cases using CTAC and concerning image quality, whereas with MRAC there were 27 acceptable and 21 unacceptable cases. The 2x2 Table for readers 1 to 3 is shown in Table 2. No significant difference was found for any of the readers between CTAC and MRAC (p=0.06137 for reader 1, p=1 for reader 2, and p=0.8137 for reader 3, respectively) using the McNemar test.
Table 2.
2x2 table for reader 1 (panel A), reader 2 (panel B), and reader 3 (panel C) for grouping of the image quality as acceptable (corresponding to the Likert scale value 4 or 5) or unacceptable (corresponding to the Likert scale values 1 to 3)
| CTAC | |||
|---|---|---|---|
|
|
|||
| Acceptable | Unacceptable | ||
| Panel A | |||
| MRAC | Acceptable | 25 | 3 |
| Unacceptable | 11 | 9 | |
| Panel B | |||
| MRAC | Acceptable | 19 | 9 |
| Unacceptable | 9 | 11 | |
| Panel C | |||
| MRAC | Acceptable | 19 | 8 |
| Unacceptable | 10 | 11 | |
A more detailed grouping into three classes of image quality is also shown in Table 3: class 1 is defined as above average (corresponding to the Likert scale value 4 or 5), the second class is defined as average (corresponding to the Likert scale value 3), and the third class is considered as not acceptable (corresponding to the Likert scale value 1 or 2).
Table 3.
2x3 table for reader 1 (panel A), reader 2 (panel B), and reader 3 (panel C) showing the grouping according to the image quality, as above average (corresponding to the Likert scale value 4 or 5), average (corresponding to the Likert scale value 3), and not acceptable (corresponding to the Likert scale value 1 or 2)
| Not acceptable | Average | Above average | |
|---|---|---|---|
| Panel A | |||
| CTAC | 3 | 9 | 36 |
| MRAC | 4 | 16 | 28 |
| Panel B | |||
| CTAC | 4 | 17 | 27 |
| MRAC | 4 | 16 | 28 |
| Panel C | |||
| CTAC | 6 | 13 | 29 |
| MRAC | 5 | 16 | 27 |
Discussion
Published studies have shown that MR sequences used for attenuation correction algorithms were as reliable as low-dose CT for ascertaining anatomic localization [29]. The SUV values obtained using these MR attenuation correction techniques did not differ significantly from those obtained using conventional methods [32] with the exception of bone tissue representation [33].
This study shows that PET images obtained using an automatic three-segmented MR attenuation method provide diagnostic image quality when this novel attenuation correction was applied. When comparing CTAC vs. MRAC, there was no statistically significant difference in two readers, whereas for one reader there was a statistically significant difference between the images derived from MRAC vs. CTAC when analyzing the data using an ungrouped approach and a two-sided, paired t-test. Proper blinding would never be possible as readers are now accustomed to seeing PET images on PET/CT scanners and may not be familiar with the image alterations found on MRAC. Artifact prevalence was more often reported on PET/MRI images by all of the readers, although it had no impact on the final quality assessment. Once again, reader 1 differed from the other two readers by reporting many more artifacts on the MR-attenuated PET images, and which supports the theory that this might have been related to the reader feeling more comfortable with CT-attenuated images which he might have recognized despite the blinding process. Simple analysis of the presence of artifacts, as seen in Table 1, revealed that 88%, 79%, and 81% of the reported artifacts for PET/CT images for readers 1, 2, and 3, respectively, were also reported in PET images from PET/MRI. Therefore, those artifacts could be either patient- or PET-scanner related. Other explanations for the artifacts seen in this study might be related to the segmentation algorithm which is reliable but might pose problems for instance in the case of metal artifacts as observed by us as well as other researchers [35]. Furthermore, the arms of the patients are down during the PET/MRI study, thus frequently leading to truncation artifacts in MRAC. Scatter might also be increased due to the table and coils used for PET/MRI. In future studies, the use of a wide range of standardized artifacts and appropriate physician training for detecting those artifacts will allow correct evaluation and classification eventually distinguishing artifacts which are truly related to the attenuation technique from those which are technology- or patient-related.
PET/MRI is a new, hybrid imaging modality which was recently introduced in the clinical area. It allows whole-body imaging integrating the metabolic information derived from the PET component with the anatomical as well as the functional information obtained from MRI [36]. It is crucial to see the MR component not purely as a means for anatomical localization of lesions as beyond morphological imaging, MR provides the opportunity to acquire sophisticated sequences such as perfusion, diffusion imaging as well as spectroscopy [37,38]. This opens new horizons with regard to the correlation of metabolic and functional information, thus leading to a comprehensive evaluation of a patient’s lesion. Furthermore the reduced radiation dose is of particular interest in the young patient population requiring frequent follow-up examinations [39].
In our study we used the commercially available, 3D, T1-weighted, spoiled gradient echo sequence to distinguish three segments [1]. Furthermore, the technology used for PET acquisition in this study is the state-of-the-art time-of-flight technology which is also commercially available on PET/CT scanners. This makes the image quality findings dependent on only the MRAC sequence, patient characteristics, and radiotracer-related variables And thus eliminating the PET detector technology as a potential variable. A further advantage of our study is the fact that all of the readers were shown randomly the images.
One of the major limitations of this study is the inability to securely blind the readers to the method that generated the PET image. Slight alterations, such as different arm positions, gave the readers potential hints as to whether they were going to read a CTAC or a MRAC map.
Another limitation is the prolonged period of time that elapsed between the FDG injection and the PET/MRI scanning. Since the PET/CT scan must be diagnostic in individual patients, we cannot acquire the PET data of the PET/MRI in the time frame the guidelines suggest. We decided that performing PET/MRI first or performing a randomization if doing PET/MRI or PET/CT first, would have been unethical. Although scan time was added per each bed position, it cannot be assured that this compensates for the amount of radiopharmaceutical decay.
Finally, lesion detection was not compared in both imaging technologies. With regard to lesion detection, the number of patients was still too low and the patient population was too heterogeneous to be able to accurately compare the lesion detection capabilities of CTAC vs. MRAC. Patients are currently being enrolled to perform this analysis in a larger group and thus also allowing the separate analysis of different cancer types.
In conclusion, our data show no difference in quality between PET images generated from PET/MRI to those generated from PET/CT. The three, segment models allow for diagnostic image quality in the MRAC maps. Further investigation is warranted, both using this and other attenuation methods, in order to gain a better understanding of the strengths and weaknesses of MR attenuation maps as well as their possible pitfalls, in order to establish the use of PET/MRI in the clinical area.
Acknowledgments
We would like to thank Bonnie Hami, MA for her thorough proofread and her efforts to improve the manuscript.
Conflicts of interest
This study was investigator initiated and was funded by a research grant from Philips Healthcare. The PET/MRI system was purchased using funds from a State of Ohio Third Frontier Grant.
References
- 1.Schulz V, Torres-Espallardo I, Renisch S, Hu Z, Ojha N, Börnert P, Perkuhn M, Niendorf T, Schäfer WM, Brockmann H, Krohn T, Buhl A, Günther RW, Mottaghy FM, Krombach GA. Automatic, three-segment, MR-based attenuation correction for whole-body PET/MR data. Eur J Nucl Med Mol Imaging. 2011;38:138–152. doi: 10.1007/s00259-010-1603-1. [DOI] [PubMed] [Google Scholar]
- 2.Antoch G, Vogt FM, Freudenberg LS, Nazaradeh F, Goehde SC, Barkhausen J, Dahmen G, Bockisch A, Debatin JF, Ruehm SG. Whole-body dual-modality PET/CT and whole-body MRI for tumor staging in oncology. JAMA. 2003;290:3199–3206. doi: 10.1001/jama.290.24.3199. [DOI] [PubMed] [Google Scholar]
- 3.Dixon WT. Simple proton spectroscopic imaging. Radiology. 1984;153:189–194. doi: 10.1148/radiology.153.1.6089263. [DOI] [PubMed] [Google Scholar]
- 4.Gore JC, Manning HC, Quarles CC, Waddell KW, Yankeelov TE. Magnetic resonance in the era of molecular imaging of cancer. Magn Reson Imaging. 2011;29:587–600. doi: 10.1016/j.mri.2011.02.003. [DOI] [PMC free article] [PubMed] [Google Scholar]
- 5.Turkbey B, Aras O, Karabulut N, Turgut AT, Akpinar E, Alibek S, Pang Y, Erturk SM, Khouli El RH, Bluemke DA, Choyke PL. Diffusion weighted MRI for detecting and monitoring cancer: a review of current applications in body imaging. Diagn Interv Radiol. 2012;18:46–59. doi: 10.4261/1305-3825.DIR.4708-11.2. [DOI] [PubMed] [Google Scholar]
- 6.Drzezga A, Souvatzoglou M, Eiber M, Beer AJ, Fürst S, Martinez-Möller A, Nekolla SG, Ziegler S, Ganter C, Rummeny EJ, Schwaiger M. First Clinical Experience with Integrated Whole-Body PET/MR: Comparison to PET/CT in Patients with Oncologic Diagnoses. J Nucl Med. 2012;53:845–855. doi: 10.2967/jnumed.111.098608. [DOI] [PubMed] [Google Scholar]
- 7.Judenhofer MS, Wehrl HF, Newport DF, Catana C, Siegel SB, Becker M, Thielscher A, Kneilling M, Lichy MP, Eichner M, Klingel K, Reischl G, Widmaier S, Röcken M, Nutt RE, Machulla HJ, Uludag K, Cherry SR, Claussen CD, Pichler BJ. Simultaneous PET-MRI: a new approach for functional and morphological imaging. Nat Med. 2008;14:459–465. doi: 10.1038/nm1700. [DOI] [PubMed] [Google Scholar]
- 8.Martinez-Möller A, Souvatzoglou M, Delso G, Bundschuh RA, Chefd‘hotel C, Ziegler SI, Navab N, Schwaiger M, Nekolla SG. Tissue classification as a potential approach for attenuation correction in whole-body PET/MRI: evaluation with PET/CT data. J Nucl Med. 2009;50:520–526. doi: 10.2967/jnumed.108.054726. [DOI] [PubMed] [Google Scholar]
- 9.Yamamoto S, Watabe H, Kanai Y, Aoki M, Sugiyama E, Watabe T, Imaizumi M, Shimosegawa E, Hatazawa J. Interference between PET and MRI sub-systems in a silicon-photomultiplier-based PET/MRI system. Phys Med Biol. 2011;56:4147–4159. doi: 10.1088/0031-9155/56/13/026. [DOI] [PubMed] [Google Scholar]
- 10.Wehrl HF, Judenhofer MS, Wiehr S, Pichler BJ. Pre-clinical PET/MR: technological advances and new perspectives in biomedical research. Eur J Nucl Med Mol Imaging. 2009;36(Suppl 1):S56–68. doi: 10.1007/s00259-009-1078-0. [DOI] [PubMed] [Google Scholar]
- 11.Samarin A, Burger C, Wollenweber SD, Crook DW, Burger IA, Schmid DT, Schulthess GK, Kuhn FP. PET/MR imaging of bone lesions – implications for PET quantification from imperfect attenuation correction. Eur J Nucl Med Mol Imaging. 2012;39:1154–1160. doi: 10.1007/s00259-012-2113-0. [DOI] [PubMed] [Google Scholar]
- 12.Sattler B, Jochimsen T, Barthel H, Sommerfeld K, Stumpp P, Hoffmann KT, Gutberlet M, Villringer A, Kahn T, Sabri O. Physical and organizational provision for installation, regulatory requirements and implementation of a simultaneous hybrid PET/MR-imaging system in an integrated research and clinical setting. MAGMA. 2013;26:159–71. doi: 10.1007/s10334-012-0347-2. [DOI] [PubMed] [Google Scholar]
- 13.Keereman V, Holen RV, Mollet P, Vandenberghe S. The effect of errors in segmented attenuation maps on PET quantification. Med Phys. 2011;38:6010–6019. doi: 10.1118/1.3651640. [DOI] [PubMed] [Google Scholar]
- 14.Delso G, Furst S, Jakoby B, Ladebeck R, Ganter C, Nekolla SG, Schwaiger M, Ziegler SI. Performance Measurements of the Siemens mMR Integrated Whole-Body PET/MR Scanner. Journal of Nuclear Medicine. 2011;52:1914–1922. doi: 10.2967/jnumed.111.092726. [DOI] [PubMed] [Google Scholar]
- 15.Keereman V, Fierens Y, Broux T, De Deene Y, Lonneux M, Vandenberghe S. MRI-based attenuation correction for PET/MRI using ultrashort echo time sequences. J Nucl Med. 2010;51:812–818. doi: 10.2967/jnumed.109.065425. [DOI] [PubMed] [Google Scholar]
- 16.Kinahan PE, Hasegawa BH, Beyer T. X-ray-based attenuation correction for positron emission tomography/computed tomography scanners. Semin Nucl Med. 2003;33:166–179. doi: 10.1053/snuc.2003.127307. [DOI] [PubMed] [Google Scholar]
- 17.Hofmann M, Pichler B, Schölkopf B, Beyer T. Towards quantitative PET/MRI: a review of MR-based attenuation correction techniques. Eur J Nucl Med Mol Imaging. 2009;36(Suppl 1):S93–104. doi: 10.1007/s00259-008-1007-7. [DOI] [PubMed] [Google Scholar]
- 18.Berker Y, Franke J, Salomon A, Palmowski M, Donker HCW, Temur Y, Mottaghy FM, Kuhl C, Izquierdo-Garcia D, Fayad ZA, Kiessling F, Schulz V. MRI-based attenuation correction for hybrid PET/MRI systems: a 4-class tissue segmentation technique using a combined ultrashort-echo-time/Dixon MRI sequence. J Nucl Med. 2012;53:796–804. doi: 10.2967/jnumed.111.092577. [DOI] [PubMed] [Google Scholar]
- 19.Wagenknecht G, Kaiser HJ, Mottaghy FM, Herzog H. MRI for attenuation correction in PET: methods and challenges. MAGMA. 2012;26:99–113. doi: 10.1007/s10334-012-0353-4. [DOI] [PMC free article] [PubMed] [Google Scholar]
- 20.Messiou C, Collins DJ, Morgan VA, Robson MD, deBono JS, Bydder GM, deSouza NM. Quantifying sclerotic bone metastases with 2D ultra short TE MRI: a feasibility study. Cancer Biomark. 2010;7:211–218. doi: 10.3233/CBM-2010-0189. [DOI] [PubMed] [Google Scholar]
- 21.Keereman V, Mollet P, Berker Y, Schulz V, Vandenberghe S. Challenges and current methods for attenuation correction in PET/MR. MAGMA. 2013;26:81–98. doi: 10.1007/s10334-012-0334-7. [DOI] [PubMed] [Google Scholar]
- 22.Halpern BS, Dahlbom M, Quon A, Schiepers C, Waldherr C, Silverman DH, Ratib O, Czernin J. Impact of patient weight and emission scan duration on PET/CT image quality and lesion detectability. J Nucl Med. 2004;45:797–801. [PubMed] [Google Scholar]
- 23.Beyer T, Weigert M, Quick HH, Pietrzyk U, Vogt F, Palm C, Antoch G, Müller SP, Bockisch A. MR-based attenuation correction for torso-PET/MR imaging: pitfalls in mapping MR to CT data. Eur J Nucl Med Mol Imaging. 2008;35:1142–1146. doi: 10.1007/s00259-008-0734-0. [DOI] [PubMed] [Google Scholar]
- 24.Schoder H, Larson S. Positron emission tomography for prostate, bladder, and renal cancer. Semin Nucl Med. 2004;34:274–292. doi: 10.1053/j.semnuclmed.2004.06.004. [DOI] [PubMed] [Google Scholar]
- 25.Hofmann M, Bezrukov I, Mantlik F, Aschoff P, Steinke F, Beyer T, Pichler BJ, Scholkopf B. MRI-Based Attenuation Correction for Whole-Body PET/MRI: Quantitative Evaluation of Segmentation- and Atlas-Based Methods. J Nucl Med. 2011;52:1392–1399. doi: 10.2967/jnumed.110.078949. [DOI] [PubMed] [Google Scholar]
- 26.Blodgett TM, Fukui MB, Snyderman CH, Branstetter BF, McCook BM, Townsend DW, Meltzer CC. Combined PET-CT in the head and neck: part 1. Physiologic, altered physiologic, and artifactual FDG uptake. Radiographics. 2005;25:897–912. doi: 10.1148/rg.254035156. [DOI] [PubMed] [Google Scholar]
- 27.Menda Y, Graham MM. Update on 18F-fluorodeoxyglucose/positron emission tomography and positron emission tomography/computed tomography imaging of squamous head and neck cancers. Semin Nucl Med. 2005;35:214–219. doi: 10.1053/j.semnuclmed.2005.05.001. [DOI] [PubMed] [Google Scholar]
- 28.Blodgett TM, Mehta AS, Mehta AS, Laymon CM, Carney J, Townsend DW. PET/CT artifacts. Clin Imaging. 2011;35:49–63. doi: 10.1016/j.clinimag.2010.03.001. [DOI] [PMC free article] [PubMed] [Google Scholar]
- 29.Eiber M, Martinez-Möller A, Souvatzoglou M, Holzapfel K, Pickhard A, Löffelbein D, Santi I, Rummeny EJ, Ziegler S, Schwaiger M, Nekolla SG, Beer AJ. Value of a Dixon-based MR/PET attenuation correction sequence for the localization and evaluation of PET-positive lesions. Eur J Nucl Med Mol Imaging. 2011;38:1691–1701. doi: 10.1007/s00259-011-1842-9. [DOI] [PubMed] [Google Scholar]
- 30.Kunos C, Radivoyevitch T, Abdul-Karim FW, Faulhaber P. 18F-fluoro-2-deoxy-D-glucose positron emission tomography standard uptake value ratio as an indicator of cervical cancer chemoradiation therapeutic response. Int J Gynecol Cancer. 2011;21:1117–1123. doi: 10.1097/IGC.0b013e31821dc8b5. [DOI] [PubMed] [Google Scholar]
- 31.R Development Core Team. R: A language and environment for statistical computing. Vienna, Austria: R Foundation for Statistical Computing; 2009. [Google Scholar]
- 32.Schramm G, Langner J, Hofheinz F, Petr J, Beuthien-Baumann B, Platzek I, Steinbach J, Kotzerke J, van den Hoff J. Quantitative accuracy of attenuation correction in the Philips Ingenuity TF whole-body PET/MR system: a direct comparison with transmission-based attenuation correction. MAGMA. 2013;26:115–26. doi: 10.1007/s10334-012-0328-5. [DOI] [PMC free article] [PubMed] [Google Scholar]
- 33.Bini J, Izquierdo-Garcia D, Mateo J, Machac J, Narula J, Fuster V, Fayad ZA. Preclinical Evaluation of MR Attenuation Correction Versus CT Attenuation Correction on a Sequential Whole-Body MR/PET Scanner. Invest Radiol. 2013;48:313–322. doi: 10.1097/RLI.0b013e31827a49ba. [DOI] [PMC free article] [PubMed] [Google Scholar]
- 34.Visvikis D, Griffiths D, Costa DC, Bomanji J, Ell PJ. Clinical evaluation of 2D versus 3D whole-body PET image quality using a dedicated BGO PET scanner. Eur J Nucl Med Mol Imaging. 2005;32:1050–1056. doi: 10.1007/s00259-005-1809-9. [DOI] [PubMed] [Google Scholar]
- 35.Ladefoged CN, Andersen FL, Keller SH, Löfgren J, Hansen AE, Holm S, Højgaard L, Beyer T. PET/MR imaging of the pelvis in the presence of endoprostheses: reducing image artifacts and increasing accuracy through inpainting. Eur J Nucl Med Mol Imaging. 2013;40:594–601. doi: 10.1007/s00259-012-2316-4. [DOI] [PubMed] [Google Scholar]
- 36.Balyasnikova S, Löfgren J, de Nijs R, Zamogilnaya Y, Højgaard L, Fischer BM. PET/MR in oncology: an introduction with focus on MR and future perspectives for hybrid imaging. Am J Nucl Med Mol Imaging. 2012;2:458–474. [PMC free article] [PubMed] [Google Scholar]
- 37.Zhong JH, Gore JC. Studies of restricted diffusion in heterogeneous media containing variations in susceptibility. Magn Reson Med. 1991;19:276–284. doi: 10.1002/mrm.1910190215. [DOI] [PubMed] [Google Scholar]
- 38.Morita N, Harada M, Otsuka H, Melhem ER, Nishitani H. Clinical Application of MR Spectroscopy and Imaging of Brain Tumor. Magn Reson Med Sci. 2010;9:167–175. doi: 10.2463/mrms.9.167. [DOI] [PubMed] [Google Scholar]
- 39.Werner MK, Schmidt H, Schwenzer NF. MR/PET: a new challenge in hybrid imaging. AJR Am J Roentgenol. 2012;199:272–277. doi: 10.2214/AJR.12.8724. [DOI] [PubMed] [Google Scholar]


