Abstract
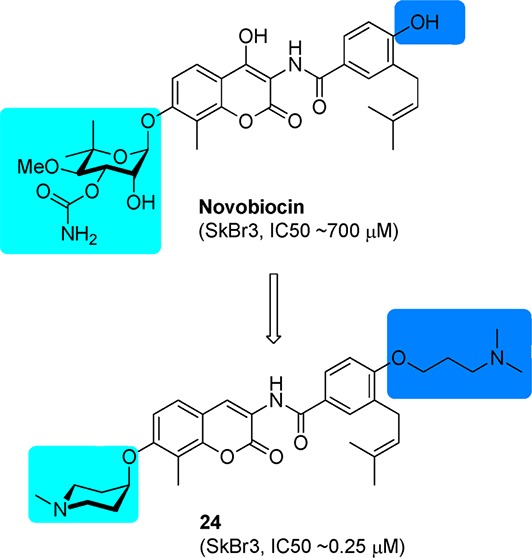
Hsp90 is an attractive therapeutic target for the treatment of cancer. Extensive structural modifications to novobiocin, the first Hsp90 C-terminal inhibitor discovered, have produced a library of novobiocin analogues and revealed some structure–activity relationships. On the basis of the most potent novobiocin analogues generated from prior studies, a three-dimensional quantitative structure–activity (3D QSAR) model was built. In addition, a new set of novobiocin analogues containing various structural features supported by the 3D QSAR model were synthesized and evaluated against two breast cancer cell lines. Several new inhibitors produced antiproliferative activity at midnanomolar concentrations, which results through Hsp90 inhibition.
Keywords: heat shock protein 90, Hsp90 inhibitors, novobiocin, 3D QSAR, breast cancer
The 90 kDa heat shock proteins (Hsp90) are responsible for the conformational maturation of numerous signaling proteins,1,2 many of which are directly associated with the six hallmarks of cancer.3 As a consequence of Hsp90 inhibition, a simultaneous attack occurs upon multiple signaling pathways that are essential for the proliferation of transformed cells. The clinical investigation of 17-AAG and 15 other Hsp90 N-terminal inhibitors has demonstrated Hsp90 as a promising cancer therapeutic target.4 Hsp90 C-terminal inhibitors may provide additional advantage for the pursuit of Hsp90 inhibitors, since no prosurvival heat shock response is observed at concentrations required to induce client protein degradation.5
Novobiocin, a natural product isolated from Streptomyces strains, was the first inhibitor of the Hsp90 C-terminal binding pocket identified, albeit with low efficacy.6 Structural modifications to the benzamide side chain and coumarin core have elucidated preliminary structure–activity relationships and identified analogues that exhibit increased inhibitory activities (Figure 1).7−10 Investigation of the noviose appendage demonstrated that the stereochemically complex and rate-limiting synthon can be replaced with simplified mimics such as alkyl amines, while simultaneously maintaining or increasing solubility.11−13
Figure 1.
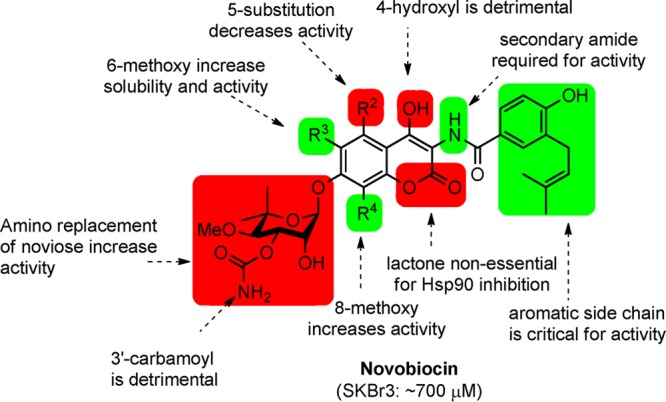
Structure–activity relationships generated from previous investigations.
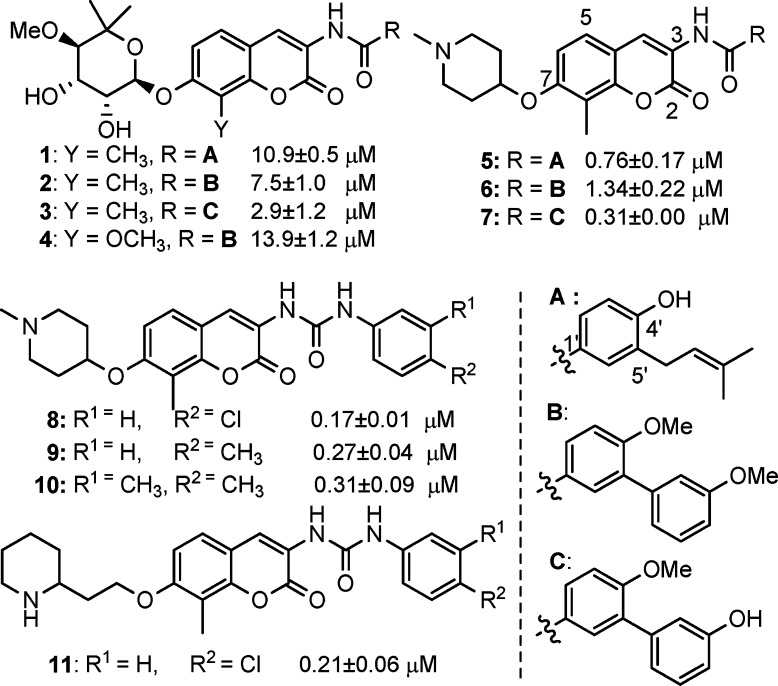
In an effort to further understand the determinants of novobiocin binding to Hsp90 and to generate a set of rational, quantitative rules for the development of new derivatives that go beyond empirical observations, we set out to build a three-dimensional quantitative structure–activity model (3D QSAR) of the most potent novobiocin analogues identified in prior studies (Figure 2). Although this training set is of small size and may represent a limit within the model, the applicability of the model to the chemical space of known compounds is to gain insights into the relative importance of distinct functional groups. Moreover, the activities of the compounds used in these studies represent a wide range of values that have been determined via the same experimental protocol.
Figure 2.
Strucures of novobiocin analogues used to build the 3D QSAR model and their experimental IC50 against SKBr3 cells.
3D QSARs were generated based upon cellular antiproliferative activities against SKBr3 cells and the 3D properties of novobiocin analogues enlisting GRIND descriptors.14 These relationships were calculated, analyzed, and interpreted using the program PENTACLE (version 1.0.6).14−16 Because no cocrystal structure with Hsp90-C-terminal inhibitors exists, the bioactive conformation of these molecules remains unknown. The Monte Carlo-based conformational search was used to identify the most probable conformation. GRIND descriptors, including the O probe (carbonyl oxygen as a hydrogen bond acceptor), the N1 probe (amide nitrogen as a hydrogen bond donor), the TIP17 probe (the shape between the ligand and the protein), and the DRY probe (hydrophobic interactions), were used to calculate molecular interaction fields (MIFs),18 which provide an array of interaction energy values between a molecule of known structure and a probe group calculated at each node of the grid surrounding the molecule of interest. Descriptors obtained from this analysis can be graphically represented in diagrams called “correlogram plots”, wherein the products from these interaction energies are plotted versus the distance between them. Four autocorrelograms, including DRY–DRY, O–O, N1–N1, and TIP–TIP belonging to the same MIF, and six cross-correlograms (DRY–O, DRY–N1, DRY–TIP, O–N1, O–TIP, and N1–TIP) from different MIFs were obtained using interaction energy values. The GRIND descriptors obtained from this analysis were used to obtain a multivariable model, and the partial least-squares regression (PLS) method was used to correlate descriptors with activity.19 The quality of the model was evaluated by the predictive correlation coefficient (q2), obtained by the leave-one-out (LOO) scheme, or by a five-random groups (5RG) procedure.
Because not all of the calculated interactions correlated with activity, the fractional factorial designs (FFD)19 variable selection procedure implemented in PENTACLE was applied to exclude variables that increased the standard deviation of prediction errors. Optimal predictive abilities for the 3D QSAR model were obtained with a model dimensionality of four latent variables. The analysis produced 10 correlograms of 68 variables each. The prediction correlation coefficient using the LOO scheme was q2-LOO = 0.93, while using the 5RG scheme was q2-RG = 0.91 (Table 1).
Table 1. LOO and 5RG Cross-Validation of the PLS 3D QSAR Regression Model.
| IC50 |
|||
|---|---|---|---|
| compd | exp (μM) | pred (LOO, μM) | pred (RG, μM) |
| 4 | 13.9 | 10.1 | 9.4 |
| 1 | 10.9 | 11.2 | 11.1 |
| 2 | 7.5 | 7.8 | 5.9 |
| 3 | 2.9 | 3.9 | 4.0 |
| 6 | 1.34 | 1.5 | 1.3 |
| 5 | 0.76 | 2.3 | 2.2 |
| 7 | 0.31 | 1.1 | 0.8 |
| 10 | 0.31 | 0.4 | 0.5 |
| 9 | 0.27 | 0.2 | 0.1 |
| 11 | 0.21 | 1.6 | 1.9 |
| 8 | 0.17 | 1.6 | 1.6 |
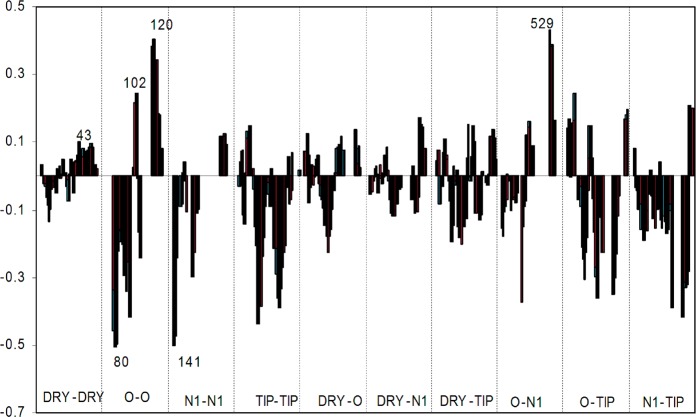
The model that summarizes contributions of the original variables can be interpreted with the aid of PLS coefficients. The positive variables represent features found in the most active compounds, while negative ones represent features correlated with diminished activity. The PLS coefficients are plotted in Figure 3, and the most influential variables are indicated alongside the variable number.
Figure 3.
PLS coefficients plot of the GRIND variables used in the model. Different correlograms are separated by dotted lines, and the pair probes are defined at the bottom. The most relevant variables are indicated with the variable number.
Not all variables are able to efficiently separate active from nonactive molecules. An active molecule may feature an unfavorable functionality that is overcome by that of another group that correlates with favorable activity. To provide effective suggestions for lead optimization, only the variables that have PLS coefficients of high absolute value and those that clearly distinguish active and less active compounds are considered, which arise from the O–O, O–N1, and DRY–DRY correlograms (interpreted in Table S1 in the Supporting Information). Such variables, and DRY–DRY in particular, were selected since hydrogen-bonding and hydrophobic/aromatic interactions represent the most common intermolecular forces that determine host/guest recognition in drugs.
The DRY autocorrelogram (DRY–DRY-43) indicated that hydrophobic interactions correlated poorly with biological activity, which may result from the fact that all of these molecules bear similar hydrophobic groups. However, it is worth noting that the most relevant variable resulting from this correlogram suggests that the hydrophobic character of the piperidine ring and the first aromatic ring on the amide/carbamide substituent correlate positively with activity. The most important variable on the O–N1 cross-correlogram (ON1–529) exhibits a higher value for three of the most potent compounds (5–7). This variable describes the interaction between the NH of the protonated piperidine ring and the oxygen atom in 4′-position with the N1 probe, indicating that these interactions are important for activity. The importance of the NH group on the piperidine ring is further supported by variable OO-120, which produced a higher value for compounds 5 and 7. Moreover, this variable suggested that a hydrogen bond donor on the amide side chain can further enhance inhibitory activity. In the same correlogram, variable OO-102 produced a high value for the most potent compounds, all of which bear the piperidine ring (5–11). This variable suggested a positive effect on inhibitory activity given by the amino group on the piperidine ring and the amide nitrogen.
In contrast, variables with a high negative impact on inhibitory activity were identified, in particular, variables OO-80 and N1N1-141, which correlate with the presence of multiple hydrogen bond donor and acceptor atoms on the sugar moiety of compounds 1–4. These data suggested that hydrophobic groups produce favorable activities. Accordingly, molecules with lower IC50 values (5 and 7–11) bear the (N-methyl) piperidine as a replacement for noviose.
The model can be summarized as follows: (i) The side chain of the coumarin core should be an amide, while the noviose sugar should be replaced by an amine; (ii) the amide side chain should exhibit hydrophobic character; (iii) the oxygen atom in the 4′-position is important for binding; and (iv) the presence of a hydrogen bond donor on this side chain can bind more tightly. Figure 4 illustrates the most relevant variables that produce a direct impact on activities for the most active compounds.
Figure 4.
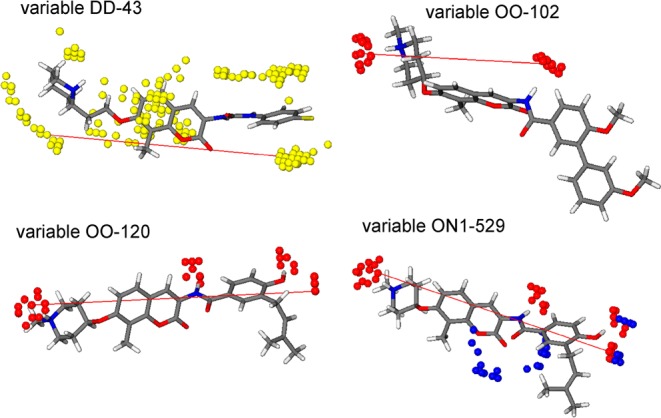
Graphical representation of the four most relevant GRIND variables with direct impact on activity for the most active compounds. MIFs are shown in colored spheres (DRY probe, yellow; O probe, red; and N1 probe, blue). The most important variables in each correlogram correspond to the pairs of grid nodes DRY–DRY, O–O, and O–N1 linked in this MIFs representation.
On the basis of these computationally derived SARs, compound 5 was chosen as a lead molecule for the development of a new series of derivatives that contain various structural features supported by the 3D QSAR model. As noted by this model, the benzamide side chain plays a beneficial role toward inhibitory activity. Thus, the initial investigation commenced with modification of the benzamide side chain.
Analogues containing substituted benzamide side chains were assembled in a modular fashion (see Scheme S1 in the Supporting Information) and utilized a Mitsunobu coupling reaction between 1-methyl-4-hydroxypeperidine 14 and coumarin phenol 15,13 followed by coupling of amine 12 with various aryl acid chlorides, which were prepared from 13 and provide direct access to a number of functionally distinct analogues.
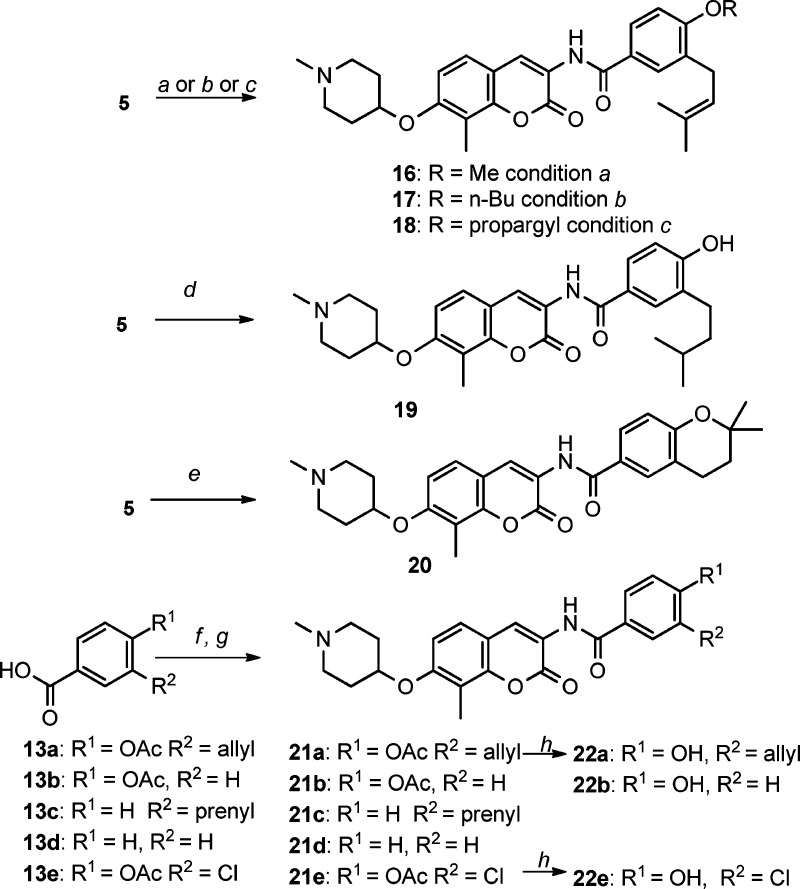
Preparation of these analogues is described in Scheme 1. Methylation of the benzamide 4′-phenol occurred upon treatment of 5 with sodium hydride followed by iodomethane to give methylether 16 in good yield. Similar etherifications occurred by Mitsunobu reactions between 5 and n-butanol or prop-2-yn-1-ol to afford 17 or 18, respectively. Hydrogenation of 5 gave the saturated prenyl group found in 19, while exposure to acid resulted in cyclization to give ether 20. Amide coupling between aniline 12 and carboxylic acid chlorides prepared from 13a–e afforded compounds 21a–e, which upon solvolysis provided 22a, 22b, and 22e, respectively.
Scheme 1. Structural Modifications to the Benzamide Side Chain.
Reagents and conditions: (a) MeI, NaH, DMF. (b) n-BuOH, Ph3P, DIAD, THF. (c) CH2OHCCH, Ph3P, DIAD, THF. (d) Pd/C, H2, THF. (e) HCl/Dioxane. (f) SOCl2, THF. (g) Compound 12, pyridine, DCM. (h) Et3N, MeOH.
The antiproliferative activity manifested by these compounds was determined using two breast cancer cell lines, SKBr3 (ER–, Her2 overexpressing) and MCF-7 (ER+). As shown in Table 2, alkylation of the 4′-phenol (16–18) resulted in decreased antiproliferative activity against the SKBr3 cell line but maintained similar activity against MCF-7 cells, suggesting that the 4′-phenol may be binding Hsp90 as an H-bond acceptor. Saturation of the double bond (19) produced no effect on inhibitory activity, while intramolecular cyclization (20), the removal of two terminal methyl groups on the prenyl chain (21a and 22a), and removal of the prenyl group (21b and 22b) resulted in decreased antiproliferative activities. Thus, the prenyl side chain appears important and may establish hydrophobic interactions with the protein binding site. Consistent with the 3D QSAR studies, removal of the 4′-phenol (21c) resulted in a 2-fold lower activity, while removal of both the phenol and the prenyl group (21d) resulted in significantly decreased activity, confirming that the 4′-phenol is important for binding. Likewise, replacement of the prenyl group with electron-withdrawing substituents (21e and 22e vs 21b and 22b) resulted in diminished activity against the SKBr3 cell line, suggesting the potential for interactions between the 4′-phenol and the surrounding environment.
Table 2. Experimental and Predicted Antiproliferative Activity of Analogues Derived from 2.
| SKBr3 (μM) | predicted (μM) | MCF-7 (μM) | |
|---|---|---|---|
| 16 | 1.41 ± 0.20a | 0.99 | 1.58 ± 0.09 |
| 17 | 1.40 ± 0.07 | 1.63 | 1.44 ± 0.05 |
| 18 | 1.40 ± 0.11 | 0.73 | 1.12 ± 0.16 |
| 19 | 0.60 ± 0.01 | 0.58 | 1.25 ± 0.39 |
| 20 | 3.46 ± 0.02 | 1.74 | 5.01 ± 0.01 |
| 21a | 2.26 ± 0.12 | 2.00 | 2.00 ± 0.18 |
| 21b | 1.67 ± 0.20 | 1.42 | 1.62 ± 0.04 |
| 21c | 1.68 ± 0.12 | 1.83 | 2.10 ± 0.08 |
| 21d | 11.5 ± 2.0 | 2.90 | 11.7 ± 1.0 |
| 21e | 3.50 ± 0.01 | 0.97 | 1.61 ± 0.16 |
| 22a | 2.43 ± 0.04 | 1.15 | 2.17 ± 0.11 |
| 22b | 0.84 ± 0.18 | 0.96 | 1.43 ± 0.08 |
| 22e | 2.30 ± 0.57 | 0.33 | 1.48 ± 0.14 |
Values represent means ± standard deviations for at least two separate experiments performed in triplicate.
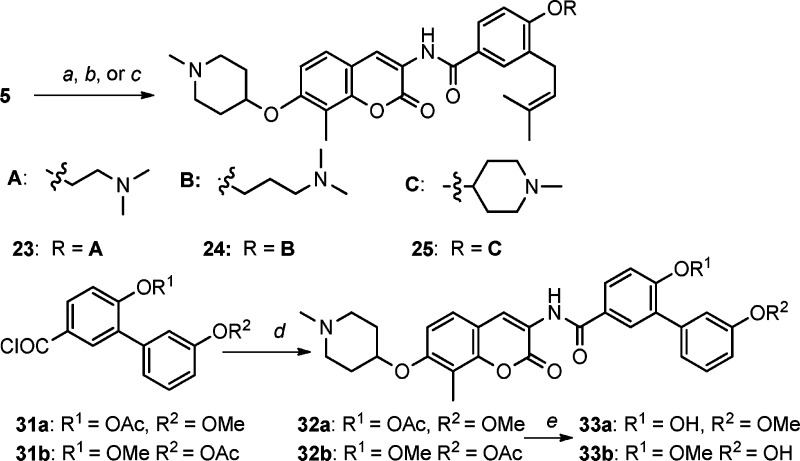
Because the 3D QSAR model suggests the coexistence of a hydrogen bond donor and a hydrogen bond acceptor on the benzamide side chain can increase activity, alkylation of the 4′-phenol with an alkyl tertiary amine was explored to determine whether this modification could establish favorable interactions with the binding pocket. Three amines [2-(dimethylamino)ethanol, 3-(dimethylamino)propan-1-ol, and 1-methylpiperidin-4-ol] were attached to the 4′-phenol benzamide side chain of 5 via Mitsunobu etherification to afford compounds 23–25 (Scheme 2). Prior studies demonstrated that replacement of the flexible prenyl side chain with an aromatic ring leads to improved inhibitory activity.9 Therefore, installation of two additional functionalities was pursued by the use of biaryl analogues, 33a and 33b. Accordingly, the phenol was placed on both phenyl rings of the biaryl system, and 33b was expected to align with the spatial requirements identified in the 3D QSAR model, while 33a was not. The syntheses of these two compounds were achieved by coupling of 12 with acyl chloride 31 (see Scheme S2 in the Supporting Information) and subsequent basic solvolysis.
Scheme 2. Synthesis of Novobiocin Analogues with an Amine Tether on the Benzamide Side Chain.
Reagents and conditions: (a) 2-(Dimethylamino)ethanol, Ph3P, DIAD, THF. (b) 3-(Dimethylamino)propan-1-ol, Ph3P, DIAD, THF. (c) 1-Methylpiperidin-4-ol, PPh3, DIAD, THF. (d) Compound 12, pyridine, THF. (e) Et3N, MeOH.
Evaluation of these benzamide analogues against breast cancer cell lines generated the data in Table 3. These data demonstrated that tethering the phenol to alkyl amines (23–25) leads to increased antiproliferative activity, supporting the formation of stronger interactions with the binding site. For biaryl analogues (32 and 33), replacement of the prenyl group with a substituted phenyl ring maintained inhibitory activity (32a and 33a) as previously suggested; however, switching the phenol from the first to the second benzene ring increased activity almost 3-fold (32b and 33b). This latter result suggests that placement of a hydrogen bond donor at the second ring is more favorable.
Table 3. Experimental and Predicted Antiproliferative Activity of Novobiocin Analogues Containing a Modified Benzamide Side Chain.
| SKBr3 (μM) | predicted (μM) | MCF-7 (μM) | |
|---|---|---|---|
| 23 | 0.33 ± 0.00a | 0.33 | 0.72 ± 0.08 |
| 24 | 0.25 ± 0.02 | 1.75 | 0.46 ± 0.05 |
| 25 | 0.21 ± 0.00 | 1.16 | 0.47 ± 0.081 |
| 32a | 0.92 ± 0.06 | 0.88 | 0.91 ± 0.00 |
| 32b | 0.29 ± 0.01 | 0.25 | 0.36 ± 0.06 |
| 33a | 0.86 ± 0.16 | 0.63 | 0.81 ± 0.14 |
| 33b | 0.31 ± 0.04 | 0.50 | 0.38 ± 0.08 |
Values represent means ± standard deviations for at least two separate experiments performed in triplicate.
Predictions for the new compounds (Tables 2 and 3 and Figure S1 in the Supporting Information) show that the QSAR model is able to predict most of the activities within two σ, yielding a correlation coefficient r2 of 0.68. Except for 24 and 25, the activities of derivatives with IC50 values lower than 1.5 μM are well predicted, and the best performance was obtained for compounds that manifest an IC50 < 1 μM. The activities for less active compounds are underestimated. This result is a reflection of the properties used for training, which utilized compounds that manifest activities of less than 1 μM. A potential source of error may be related to the dependence of the model on the 3D structures of the compounds used to calculate the interaction energy maps. The minimum energy solution conformation used for the calculations can clearly influence the prediction capabilities in this model, in particular, if the molecules used to build the model are similar as in this case, as small differences in the position of functional groups could yield different activities. The activities of compounds 24 and 25, for example, are overestimated because their conformations are highly similar to the conformation of compound 1, and the position of the amino group in the amide side chains is not optimally described by the model. However, despite these limitations, the model shows a nontrivial agreement between the predicted and the experimental activities.
To confirm that the antiproliferative activities observed by these modified novobiocin analogues resulted from Hsp90 inhibition, Western blot analyses of cell lysates following administration of 24 was performed. Figure 5 shows that in MCF-7 cells, the Hsp90-dependent client proteins Her2, Raf, and Akt underwent degradation in a concentration-dependent manner upon treatment with 24 at the same concentration needed to manifest antiproliferative activity, thereby linking Hsp90 inhibition to cell viability. The non-Hsp90-dependent protein, actin, was not affected and indicates the selective degradation of Hsp90-dependent proteins. In addition, Hsp90 levels remained constant at all concentrations tested, which is consistent with prior studies involving Hsp90 C-terminal inhibitors.20,21
Figure 5.
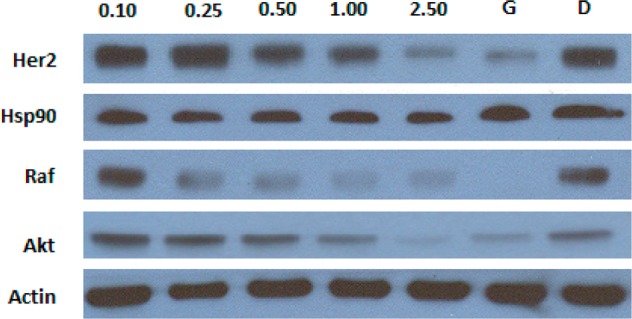
Western blot analyses of MCF-7 cell lysates for Hsp90 client protein degradation after 24 h of incubation. Concentrations (in μM) of 24 are indicated above each lane. Geldanamycin (G, 500 nM) and DMSO (D) were, respectively, employed as positive and negative controls.
In summary, a set of potent novobiocin analogues were designed with the assistance of a 3D QSAR model and shown to exhibit promising antiproliferative activities between 200 and 400 nM against two breast cancer cell lines. Western blot analysis confirmed that the antiproliferative activity manifested by 24 resulted from Hsp90 inhibition. Overall, these results support the potential to use quantitative structure-based rational studies to investigate the chemical space of molecules targeting the Hsp90 C-terminus. The designed compounds produced antiproliferative activity and blocked Hsp90 chaperoning activity. Together, these features may make this model an attractive starting point for the rational development of new Hsp90 inhibitors.
Supporting Information Available
Experimental procedures for the synthesis and characterization of new compounds (1H and 13C NMR, HRMS). This material is available free of charge via the Internet at http://pubs.acs.org.
We gratefully acknowledge support of this project by the NIH/NCI (CA120458) and the DOD Prostate Cancer Research Program (QH815179). G.C. gratefully acknowledges AIRC (Associazione Italiana Ricerca sul Cancro) for support through the Grant IG.11775 and the Flagship “INTEROMICS” project (PB.P05) funded by MIUR and CNR, and the CARIPLO Foundation project 2011.1800.
The authors declare no competing financial interest.
Funding Statement
National Institutes of Health, United States
Supplementary Material
References
- Blagg B. S. J.; Kerr T. A. Hsp90 inhibitors: Small molecules that transform the Hsp90 protein folding machinery into a catalyst for protein degradation. Med. Res. Rev. 2006, 26, 310–338. [DOI] [PubMed] [Google Scholar]
- Zhang H.; Burrows F. Targeting multiple signal transduction pathways through inhibition of Hsp90. J. Mol. Med. (Heidelberg, Germany) 2004, 82, 488–499. [DOI] [PubMed] [Google Scholar]
- Hanahan D.; Weinberg R. A. Hallmarks of Cancer: The Next Generation. Cell 2011, 144, 646–674. [DOI] [PubMed] [Google Scholar]
- Biamonte M. A.; Van de Water R.; Arndt J. W.; Scannevin R. H.; Perret D.; Lee W. C. Heat Shock Protein 90: Inhibitors in Clinical Trials. J. Med. Chem. 2010, 53, 3–17. [DOI] [PubMed] [Google Scholar]
- Zhao H. P.; Michaelis M. L.; Blagg B. S. J. Hsp90 modulation for the treatment of Alzheimer's disease. Adv. Pharmacol. 2012, 64, 1–25. [DOI] [PubMed] [Google Scholar]
- Marcu M. G.; Chadli A.; Bouhouche I.; Catelli M.; Neckers L. M. The heat shock protein 90 antagonist novobiocin interacts with a previously unrecognized ATP-binding domain in the carboxyl terminus of the chaperone. J. Biol. Chem. 2000, 275, 37181–37186. [DOI] [PubMed] [Google Scholar]
- Yu X. M.; Shen G.; Neckers L.; Blake H.; Holzbeierlein J.; Cronk B.; Blagg B. S. J. Hsp90 inhibitors identified from a library of novobiocin analogues. J. Am. Chem. Soc. 2005, 127, 12778–12779. [DOI] [PubMed] [Google Scholar]
- Burlison J. A.; Neckers L.; Smith A. B.; Maxwell A.; Blagg B. S. J. Novobiocin: redesigning a DNA gyrase inhibitor for selective inhibition of Hsp90. J. Am. Chem. Soc. 2006, 128, 15529–15536. [DOI] [PubMed] [Google Scholar]
- Burlison J. A.; Avila C.; Vielhauer G.; Lubbers D. J.; Holzbeierlein J.; Blagg B. S. J. Development of novobiocin analogues that manifest anti-proliferative activity against several cancer cell lines. J. Org. Chem. 2008, 73, 2130–2137. [DOI] [PubMed] [Google Scholar]
- Donnelly A. C.; Mays J. R.; Burlison J. A.; Nelson J. T.; Vielhauer G.; Holzbeierlein J.; Blagg B. S. J. The design, synthesis, and evaluation of coumarin ring derivatives of the novobiocin scaffold that exhibit antiproliferative activity. J. Org. Chem. 2008, 73, 8901–8920. [DOI] [PMC free article] [PubMed] [Google Scholar]
- Zhao H. P.; Kusuma B. R.; Blagg B. S. J. Synthesis and evaluation of noviose replacements on novobiocin that manifest antiproliferative activity. ACS Med. Chem. Lett. 2010, 1, 311–315. [DOI] [PMC free article] [PubMed] [Google Scholar]
- Donnelly A. C.; Zhao H. P.; Kusuma B. R.; Blagg B. S. J. Cytotoxic sugar analogues of an optimized novobiocin scaffold. MedChemComm 2010, 1, 165–170. [Google Scholar]
- Zhao H. P.; Donnelly A. C.; Kusuma B. R.; Brandt G. E. L.; Brown D.; Rajewski R. A.; Vielhauer G.; Holzbeierlein J.; Cohen M. S.; Blagg B. S. J. Engineering an Antibiotic to Fight Cancer: Optimization of the Novobiocin Scaffold to Produce Anti-proliferative Agents. J. Med. Chem. 2011, 54, 3839–3853. [DOI] [PMC free article] [PubMed] [Google Scholar]
- Pastor M.; Cruciani G.; McLay I.; Pickett S.; Clementi S. GRid-INdependent Descriptors (GRIND): A novel class of alignment-independent three-dimensional molecular descriptors. J. Med. Chem. 2000, 43, 3233–3243. [DOI] [PubMed] [Google Scholar]
- Duran A.; Martinez G. C.; Pastor M. Development and validation of AMANDA, a new algorithm for selecting highly relevant regions in molecular interaction fields. J. Chem. Inf. Model. 2008, 48, 1813–1823. [DOI] [PubMed] [Google Scholar]
- Duran A.; Zamora I.; Pastor M. Suitability of GRIND-based principal properties for the description of molecular similarity and ligand-based virtual screening. J. Chem. Inf. Model. 2009, 49, 2129–2138. [DOI] [PubMed] [Google Scholar]
- Fontaine F.; Pastor M.; Sanz F. Incorporating molecular shape into the alignment free GRid-INdependent descriptors. J. Med. Chem. 2004, 47, 2805–2815. [DOI] [PubMed] [Google Scholar]
- Goodford P. J. Computational procedure for determining energetically favorable binding sites on biologically important macromolecules. J. Med. Chem. 1985, 28, 849–857. [DOI] [PubMed] [Google Scholar]
- Baroni M.; Costantino G.; Cruciani G.; Riganelli D.; Valigi R.; Clementi S. Generating optimal linear PLS estimations (GOLPE): An advanced chemometric tool for handling 3D-QSAR problems. Quant. Struct.-Act. Relat. 1993, 12, 9–20. [Google Scholar]
- Zhao H. P.; Brandt G. E.; Galam L.; Matts R. L.; Blagg B. S. J. Identification and initial SAR of silybin: An Hsp90 inhibitor. Bioorg. Med. Chem. Lett. 2011, 21, 2659–2664. [DOI] [PubMed] [Google Scholar]
- Zhao H. P.; Yan B.; Peterson L. B.; Blagg B. S. J. 3-Arylcoumarin derivatives manifest anti-proliferative activity through Hsp90 inhibition. ACS Med. Chem. Lett. 2012, 3, 327–331. [DOI] [PMC free article] [PubMed] [Google Scholar]
Associated Data
This section collects any data citations, data availability statements, or supplementary materials included in this article.


