

Abstract
To assess the impact of a mixture containing dioxin-like and non-dioxin-like polychlorinated biphenyls (PCBs), male mice were initiated with N-nitroso-diethylamine and subsequently treated with PCB126, an Ah-Receptor agonist, and PCB153, acting via activation of the constitutive androstane receptor. The two congeners were given at two dose levels: the low dose was adjusted to induce ~150-fold increases in cytochrome P450 (Cyp)1a1 (PCB126) and Cyp2b10 mRNAs (PCB153), and the high dose was chosen as twice the low dose. To keep the liver PCB levels constant, mice were given initial loading doses followed by weekly maintenance doses calculated on the basis of the PCBs’ half-lives. Mice were treated with the individual congeners (low and high dose) or with a mixture consisting of the low doses of the 2 PCBs. The following results were obtained: (1) the 2 PCBs produced dose-dependent increases in Cyp1a1 and Cyp2b10 mRNA, protein, and activity when given individually; (2) combined treatment caused more than additive effects on Cyp1a1 mRNA expression, protein level, and ethoxyresurofin activity; (3) changes in the levels of several proteins were detected by proteome analysis in livers of PCB-treated mice; (4) besides these biological responses, the individual PCBs caused no significant increase in the number of glucose-6-phospatase (G6Pase)–deficient neoplastic lesions in liver, whereas a moderate significant effect occurred in the combination group. These results suggest weak but significant response-additive effects of the 2 PCBs when given in combination. They also suggest that the Cyp biomarkers tend to overestimate the carcinogenic response produced by the PCBs in mouse liver.
Key Words: PCB126, PCB153, tumor promotion, Cyp1a1, Cyp2b10.
Polychlorinated dibenzo-p-dioxins and -furans and polychlorinated biphenyls (PCBs) are carcinogenic in rodents. PCBs as a group are classified as probable human carcinogens by the International Agency for the Research on Cancer (IARC), whereas 2,3,7,8-tetrachlorodibenzo-p-dioxin (TCDD) and 3,3′,4,4′,5-pentachlorobiphenyl (PCB126) are classified as group I carcinogens (IARC, 2009). Epidemiological studies investigating the follow-up of chemical accidents have shown that cancer can be recognized as a relevant endpoint for dioxin-like compounds (EFSA, 2004). Other effects in humans including immune effects, endometriosis, diabetes, and cardiovascular disease were also reported (EFSA, 2004). However, PCBs occur in our environment as complex mixtures, often in combination with dioxins and furans, and it is unclear which risk is imposed on humans by uptake of mixtures of these compounds. Concepts for risk assessment are still a matter of debate.
For risk assessment of mixtures, different approaches have been discussed: (1) selection of the most toxic compound in a mixture as “lead compound”; (2) the alternative assumption of dose additivity assumes a common mechanism of action, and the well-known TEQ approach of dioxin-like compounds represents an example; (3) in contrast, response additivity allows for a summing of responses regardless of whether a common mechanism of action is known. There is currently less convincing evidence, however, in support of this latter approach, even when dealing with similar toxicological endpoints, and it was stated by the European Food Safety Authority (EFSA) that research into the nature of dose-response relationships is necessary with regard to relevant endpoints (EFSA, 2004).
Tumor promotion and other biological effects of dioxins, furans, and PCBs are believed to be mediated via activation of distinct cellular receptors: dioxin-like PCBs activate the aryl hydrocarbon receptor (AhR), whereas non-dioxin-like PCBs activate the constitutive androstane receptor (CAR) or the pregnane-X-receptor (PXR). These receptors act as transcription factors and induce expression of defined sets of target genes; prototype targets are cytochrome P450 (Cyp) 1a1 for the AhR and Cyp2b10 for CAR (Bock, 1994; Ueda et al., 2002). In the case of the dioxin-like PCBs, induction of Cyp1a family members correlates well with the potencies of the different congeners to bind to and activate the AhR (Safe, 1994; Van den Berg et al., 1998). Therefore, Cyp induction can be used in this case for calculation of equivalency factors to estimate effects of complex mixtures, and it has been shown that mixtures of dioxin-like PCBs clearly show additive effects on Cyp1a1 induction, as determined by a Cyp1a-specific enzymatic assay (ethoxyresorufin dealkylase; EROD) (Schmitz et al., 1995). The situation, however, is less clear for the non-dioxin-like PCBs and for scenarios where different types of receptors are activated by mixtures of dioxin- and non-dioxin-like compounds (Appel, 2003; EFSA, 2004; Schwarz and Appel, 2005). We recently showed that PCB153, a non-dioxin-like PCB that resembles phenobarbital (PB) in its mode of action, selectively promotes tumors with Ctnnb1 (encoding β-catenin) mutations (Strathmann et al., 2006). A hallmark of these tumors is their increased expression of glutamine synthetase (GS), which can be identified by immunohistochemical methods.
Conflicting results have been reported in recent studies where the effects of PCB mixtures were analyzed in initiation-promotion experiments. For example, a mixture of the dioxin-like PCB126 and the non-dioxin-like PCB153 produced nonadditive (antagonistic) tumor-promoting effects in two studies (Dean et al., 2002; Haag-Gronlund et al., 1998), but not in another where synergistic effects were observed (Bager et al., 1995). In a similar setup, the tumor-promoting activity of a mixture containing PCB126, TCDD, and other dioxin-like compounds was only marginally affected by addition of PCB153 (Van der Plas et al., 1999). By contrast, PCB153 appeared to increase the neoplastic response to PCB126 in female Sprague Dawley rats (NTP, 2006).
In this study, we address the question of how dioxin- and non-dioxin-like PCBs interact if they are administered simultaneously in an initiation-promotion experiment with mice. Equipotent doses of PCB126 (dioxin-like) and PCB153 (non-dioxin-like) were determined on the basis of their Cyp-inducing potencies. Tumor-promoting effects were analyzed for each PCB individually and for a combination of both. In addition, we performed a proteome analysis to identify the protein patterns induced by PCB126 and PCB153, as well as possible changes by combined PCB126/153 treatment.
MATERIALS AND METHODS
PCB Synthesis
PCB126 and PCB153 (2,2′,4,4′,5,5′-hexachlorobiphenyl) were synthesized and characterized as described previously (Lai et al., 2011; Schramm et al., 1985). The purity of both PCB congeners was greater than 99%, as determined by gas chromatography-mass spectrometry (GC-MS; see Supplementary Data). The analytical standards of PCBs 14, 30, 65, and 204 were obtained from AccuStandard (New Haven, CT). “Caution: PCBs should be handled as hazardous compounds in accordance with National Institutes of Health guidelines.”
Animals and Animal Husbandry
Adult male C3H/N mice were purchased from Charles River, Sulzfeld, and kept individually in Type III Macrolon cages on softwood granulate bedding (Lignocel FS 14, ssniff Spezialdiäten GmbH, Soest, FRG) at a constant 12-h dark/light cycle and room temperature of 21±1°C with a relative humidity of 50±5%. Animals had access to food and tap water ad libitum and received commercial diet (ssniff R/M-H, ssniff Spezialdiäten GmbH). Animals received humane care and protocols complied with institutional and legal guidelines.
Dose-finding experiment and half-life estimation of PCBs in liver.
Groups of mice were given single doses of either PCB126 (10, 50, 100, or 200 µg/kg body weight) or PCB153 (25, 50, 75, or 100mg/kg body weight). PCBs were dissolved in corn oil and administered by gavage (volumes of 200 µl). Control animals received corn oil. Six mice per dose group were used, and two animals each were sacrificed 4, 21, and 42 days after treatment. For determination of PCB half-lives and optimal dose finding, PCB contents in liver and induction of Cyp mRNA expression were assessed as described below.
Initiation-promotion experiment.
For the induction of liver tumors, we followed a standard initiation/promotion protocol described earlier (Moennikes et al., 2000). The design of the study is graphically illustrated in Figure 1. A total of 188 male C3H/N mice were randomly assigned to 10 different treatment groups as depicted in Table 1. Six animals died during the experiment without apparent preference to any of the groups. Six groups (groups 1–6) were initiated with a single dose of DEN (90 µg/g body weight), which was injected ip at 6 weeks of age. The remaining four groups (group 7–10) received 0.9% NaCl. After a treatment-free interval of 3 weeks, selected groups of initiated and non-initiated mice were treated with PCB126 or PCB153 either separately or in combination. PCB application was performed from 3 weeks until 24 weeks after DEN or NaCl treatment. PCBs were dissolved in corn oil and administered by gavage at a high dose or a low dose (half the high dose). Non-PCB–treated animals received the vehicle (corn oil). Animals received an initial loading dose, followed by weekly applications of a constant maintenance dose. The doses were calculated based on PCB half-lives and CYP induction as described in Results. For assessment of hepatocyte proliferation, 5-bromodeoxyuridine (BrdU) was given via the drinking water (1mg/ml) for 3 days prior to killing. Groups of mice were killed either in week 25 or 34 after DEN treatment (i.e., 1 or 10 weeks after termination of PCB treatment). Livers were isolated, washed in cold PBS, and weighed. The numbers and sizes of tumors visible on the surface of the liver were recorded, and larger tumors were isolated and shock-frozen in liquid nitrogen. For immunohistochemical analysis, liver lobules were separated and either frozen on dry ice or fixed in Carnoy solution for subsequent paraffin embedment. In addition, aliquots of normal appearing liver were shock-frozen for RNA, protein, and proteome analyses. All frozen materials were stored at −75°C.
Fig. 1.

Schematic representation of the treatment protocol and analyses performed in our present study.
Table 1 .
Details of the Initiation-Promotion Experiment
| Group | DENa | PCB153 | PCB126 | Effective number of miceb | |
|---|---|---|---|---|---|
| 25 | 34 | ||||
| Weeks after DEN | |||||
| 1 | + | − | − | 14 | 16 |
| 2 | + | Hc | − | 10 | 11 |
| 3 | + | Lc | − | 13 | 16 |
| 4 | + | − | Hc | 9 | 11 |
| 5 | + | − | Lc | 13 | 18 |
| 6 | + | Lc | Lc | 14 | 18 |
| 7 | − | − | − | − | 5 |
| 8 | − | Hc | − | − | 5 |
| 9 | − | − | Hc | − | 5 |
| 10 | − | Lc | Lc | − | 4 |
| Total | 73 | 109 | |||
Notes. aSingle ip injection of 90 µg/g body weight at the age of 6 weeks.
bSix mice died during the experiment without prevalence for one of the treatment groups. These animals are not listed in the Table.
cWeekly PCB applications by gavage; H, high dose; L, low dose (1/2 high dose).
Measurement of PCB Content in Liver
PCB extraction from liver samples.
PCB126 and PCB153 levels in liver samples were determined as described previously (Bunaciu et al., 2007; Glauert et al., 2008). In short, the liver samples were thoroughly mixed with 2g diatomaceous earth (Dionex, Sunnyvale, CA), and one aliquot of this mixture (0.12–0.42g) was placed in a 33ml extraction cell on top of Florisil (12g, 60–100 mesh; Fisher Scientific, Pittsburg, PA) as fat retainer. Samples were spiked with a surrogate standard (100 µl) containing 3,5-dichlorobiphenyl (1 µg/ml) and 2,3,5,6-tetrachlorobiphenyl (1 µg/ml). The samples were extracted with acetone-hexane (1:1, vol/vol) using pressurized liquid extraction (ASE 200, Dionex). The following extraction conditions were employed: temperature, 100°C; pressure, 1500 psi; 6-min heating; single static cycle of 5min; and 35% of cell flush volume. The extracts were concentrated under a gentle stream of nitrogen, and the internal standard solution (100 µl) containing 2,4,6-trichlorobiphenyl (0.5 µg/ml) and 2,2′,3,4,4′,5,6,6′-octachlorobiphenyl (0.5 µg/ml) was added. Subsequently, all samples were subjected to a sulfur cleanup step as reported previously (Bunaciu et al., 2007; Glauert et al., 2008), and the organic phase was allowed to stand overnight over concentrated sulfuric acid prior to analysis.
Gas chromatographic analysis.
The liver extracts were analyzed on an Agilent 6890N gas chromatograph equipped with a SLB-1 column (60 m × 0.25mm × 0.25 µm; Supelco, St Louis, MO) and a 63Ni µ-ECD (electron capture) detector (Bunaciu et al., 2007; Glauert et al., 2008). The following temperature program was used: 80°C hold for 1min, 10°C/min to 150°C, 5°C/min to 280°C, hold for 6min. The injector and detector temperatures were 250°C and 300°C, respectively.
Quality assurance.
PCB126 and PCB153 were quantified using the internal standard method. PCB concentrations were corrected for the recovery of the respective surrogate standard only if the recovery was < 100%. The concentrations of PCB126 and PCB153 were corrected for the recovery of 2,3,5,6-tetrachlorobiphenyl (72±4%). The detector response was linear over the entire concentration range employed in this study. The instrument detection limits (IDL) were IDLPCB126 = 7ng/ml (linear calibration range, 1–1000ng/ml; r 2 = 0.9999) and IDLPCB153 = 20 pg (linear calibration range, 1–1000ng/ml; r 2 = 0.9998), as determined from the respective calibration curves (Kania-Korwel et al., 2008; Loconto, 2006). Background levels in method blank (containing only the chemicals used in the analysis but no tissue sample) were 1.0ng for PCB126 and 0.5ng for PCB153.
Enzyme and Immunohistochemical Stainings
Serial sections (10 µm thick) were prepared from frozen livers of the animals of the initiation-promotion experiment. One section was stained enzyme histochemically for glucose-6-phosphatase (G6Pase) activity as described (Buchmann et al., 1991). A parallel section was stained immunohistochemically for GS using a mouse anti-GS monoclonal antibody (1:2,000; BD Biosciences Europe, Heidelberg, Germany) in combination with a horseradish peroxidase–conjugated secondary antibody (1:20; Dako, Glostrup, Denmark) and 3-amino-9-ethylcarbazole/H2O2 as substrates.
The sizes of enzyme-altered liver lesions in G6Pase- and GS-stained sections were quantified by means of a computer-assisted digitizer system consisting of a Zeiss Axio Imager microscope and a Wacom Cintiq 21UX pen display. Areas of the liver sections and of transections of enzyme-altered lesions were determined and used for calculation of the number of altered lesions per cubic centimeter of liver and their volume fractions according to procedures described in Campbell et al. (1982). Because larger tumors on the surface of the liver had been isolated, transections with diameters > 4mm were excluded from the morphometric analyses to avoid bias by large tumors remaining in the liver.
BrdU Incorporation
Sections (5 µm thick) from paraffin-embedded liver blocks were stained immunohistochemically using a monoclonal anti-BrdU antibody as described above for GS. Sections were then counterstained with hematoxylin. The numbers of BrdU-positive and -negative nuclei were counted in randomly selected fields of the stained sections. On average, ~1600 nuclei per animal were evaluated for calculation of BrdU labeling indices (percentage of BrdU-positive nuclei).
Proteome Analysis
Protein separation.
Preparation of liver protein lysates for subsequent proteome analysis, separation of proteins by two-dimensional electrophoresis, statistical analysis of data, and identification of significantly altered proteins spots were performed as described earlier (Görg et al., 2000). In brief, homogenized protein lysates were quantified by a standard method, separated into two dimensions by isoelectric focusing using an IPGphor IEF-separation unit (GE Healthcare Bio-Sciences) followed by cysteine residue reduction with DTT, and alkylation with iodoacetamide before applying SDS-PAGE using 12.5% acrylamide gels on an ETTAN Dalt II separation unit (GE Healthcare Bio-Sciences). Proteins were stained with 10nM Ruthenium II Tris and then destained and imaged using ProXPRESS ProFinder fluorescence imaging workstation (PerkinElmer, Lifesciences, Boston, MA). Spot detection and quantification were performed automatically using ProteinMine TM 2-DE image analysis software (Version 1.5.0, BioImagene, San Mateo, CA). Data evaluation and statistical analysis of protein expression were carried out using software Package R (Version 2.2.0).
Protein identification by mass spectrometry.
In-gel digestions of proteins, sample preparation, and MALDI-TOF/TOF mass spectrometry were performed as previously described (Strathmann et al., 2007). In short, excised proteins were trypsin-digested overnight (sequencing grade; Promega, Madison, WI); peptides were extracted by addition of 0.5% trifluoroacetic acid in water, purified on a C18 RP minicolumn (ZipTip C18; Millipore, Bedford, MA), and eluted directly onto the MALDI target plate using R-cyano-4-hydroxycinnamic acid matrix solution. MS and MS/MS measurements were performed using a MALDI-TOF/TOF instrument (4700 Proteomics analyzer; Applied Biosystems, Framingham, MA), and the data were submitted to the MASCOT server (version 2.0; Matrix Science, London, UK) for in-house search against the Swiss-Prot database (release 220708, taxonomy Rodentia, containing 24514 sequence entries). A protein was accepted as identified if the total protein score was higher than the significance threshold indicated by MASCOT, whereby the MS/MS data confirmed the identification. To verify correct spot picking and subsequent identification, a second set of identical protein spots from different gels was picked. Proteins that did not match between the first and second analysis were excluded from the evaluation.
Western Blotting
Whole cell extracts were separated by SDS-polyacrylamide gel electrophoresis (30 µg/lane) and transferred to polyvinylidene difluoride membranes using standard methods. Protein detection was carried out as recently described (Hailfinger et al., 2006) using antibodies against Cyp1a1 (1:2000; gift from Dr P. Beaune, Paris), Cyp2b10 (1:2000; gift from Dr R. Wolf, Dundee), and β-catenin (1:500; BD Biosciences, Heidelberg, Germany) in combination with appropriate alkaline phosphatase–conjugated secondary antibodies (1:10,000; Tropix, Weiterstadt, Germany) and CDP-Star as a substrate. Chemiluminescence was monitored by use of a CCD camera system.
Quantitative Determination of Messenger RNAs by RT-PCR
Total RNA was isolated using TRIzol (Invitrogen, Karlsruhe, Germany) followed by removal of residual DNA by DNAse I digestion (Roche, Mannheim, Germany). RNA was reverse transcribed by avian myeloblastosis virus reverse transcriptase (Peqlab, Erlangen, Germany) and used for PCR on a LightCycler real-time PCR system (Roche). GAPDH expression was used for normalization. Relative expression ratios of the target genes in the samples were computed based on the crossing point difference of a sample versus a control (Pfaffl, 2001). The primer pairs used for PCR amplification are listed in Table 2.
Table 2 .
Real-Time RT-PCR Primers Used in This Study
| Gene | Forward primer (5′-3′) | Reverse primer (3′-5′) |
|---|---|---|
| AhR | GTCAAATCCTTCTAAGCGACACA | AACCAGCACAAAGCCATTCA |
| CAR | AACAACAGTCTCGGCTCCAAA | AGCATTTCATTGCCACTCCC |
| CYP1A1 | TGTCCTCCGTTACCTGCCTA | GTGTCAAACCCAGCTCCAAA |
| CYP2B10 | TACTCCTATTCCATGTCTCCAAA | TCCAGAAGTCTCTTTTCACATGT |
| Cyp2E1 | CAAGTCTTTAACCAAGTTGGCAAA | CCACGATGCGCCTCTGA |
| GAPDH | ACCACAGTCCATGCCATCAC | TCCACCACCCTGTTGCTGTA |
| GSTm3 | TGCACTGTGGCTCCCGGT | AGGCCTGGGGCAGCTCC |
| UGT1A6 | AGAGAGTACAGGAACAACATGATTGTCG | CAACGATGCCATGCTCCCC |
Ethoxyresorufin and Pentoxyresorufin Dealkylase Assays
Enzymatic activity of ethoxyresorufin-O-dealkylase (Cyp1a1/2) and pentoxyresorufin-O-dealkylase (Cyp2b10) was measured by standard procedures using isolated mouse liver microsomes (Burke and Mayer, 1974; Prough et al., 1978).
Statistical Analyses
Cyps, GSTm3, EROD, pentoxyresorufin dealkylase (PROD), and BrdU: Values were log-transformed; Cyps, GSTm3, and BrdU: One-way ANOVA with Dunnett contrasts was used to compare control with treatment with a single PCB. EROD and PROD: One-way ANOVA with Dunnett contrasts was used to compare control to all treatment groups. Synergistic and antagonistic effects were investigated by two-way ANOVA with interaction. Cyps and GSTm3: Comparison of the combination group to control was performed by t-test. BrdU: Comparison of the DEN versus NaCl groups was performed by t-test separately for every promotion group. G6Pase number and volume fraction: all groups were compared using one-way ANOVA followed by Bonferroni-adjusted pairwise comparisons. All calculations were performed with SAS Version 9.2 (SAS Institute Inc., Cary, NC).
RESULTS
The aim of our study was to compare the tumor-promoting activity of PCB126 and PCB153 and to analyze possible synergistic or antagonistic effects when the two PCBs are given in combination. In order to compare their effects without the need of potency extrapolation, we intended to apply equipotent doses of PCB126 and PCB153. Because recent studies have shown that the potency of PCBs is well correlated to their Cyp-inducing capacity, specific induction of the Cyp isoforms 1a1 and 2b10 by PCB126 and PCB153, respectively, was used as an indicator of their biological activity. Moreover, we had to consider that the two PCBs may accumulate to a different extent under chronic treatment. For these reasons, we performed an exploratory experiment to estimate the Cyp-inducing potencies and half-lives of the two PCB congeners.
Determination of Equipotent Doses and Half-Lives of PCBs
To analyze the dose response and kinetics of PCB accumulation and Cyp induction in liver, mice were treated with different doses of PCBs, and two animals each were killed 4, 21, and 42 days thereafter. As PCB126 is a far more potent Cyp inducer than PCB153, we used doses ranging from 10 to 200 µg/kg for PCB126 and 25 to 100mg/kg for PCB153. Figure 2 shows that liver contents of PCB126 and PCB153 are strongly dose dependent at all time points of investigation and decline steadily with time. Similarly, induction of Cyp1a1 mRNA expression by PCB126 and Cyp2b10 mRNA expression by PCB153 occurred in a dose-dependent manner. Overall, the time course of expression of both Cyp mRNAs largely correlates with the respective PCB contents in liver, except for Cyp2b10 induction by PCB153 at 42 days, which is very low despite strongly elevated PCB153 liver contents. To estimate the PCBs’ half-lives, liver contents were plotted versus time for each dose. This is shown exemplarily in Figure 3 for the 100 µg/kg and 100mg/kg doses of PCB126 and PCB153, respectively. The elimination rate in liver is very similar for both PCBs with half-lives of about 25 days. Interestingly, Cyp1a1 induction closely followed the decline in PCB126 levels, whereas Cyp2b10 expression decreased much more rapidly than PCB153 contents.
Fig. 2.

Dose-finding experiment. Mice received single doses of PCB126 (10, 50, 100, or 200 µg/kg body weight) or PCB153 (25, 50, 75, or 100mg/kg body weight) and were killed 4, 21, and 42 days later. PCB liver contents and expression of Cyp1a1 mRNA (PCB126) and Cyp2b10 mRNA (PCB156) were analyzed in two animals per dose and time. Doses required for 150-fold induction of Cyp mRNA expression by either PCB were calculated from the regression lines at 4 days of treatment (indicated by dotted lines).
Fig. 3.

Estimation of PCB half-lives. Half-lives of PCB126 and PCB153 were calculated using data from Figure 2 for the 100 µg/kg and 100mg/kg doses, respectively. Log liver contents of either PCB were plotted versus time and subjected to regression analysis. Induction of Cyp1a1 and Cyp2b10 mRNA expression is shown for comparison.
To calculate equipotent PCB doses for the main experiment, we chose a 150-fold induction of Cyp1a1 or Cyp2b10 as target value for the low-dose groups (300-fold for high doses). This value was deliberately kept rather low to allow for the detection of possible synergistic effects in the combined PCB126/153 treatment group, which might be missed if the applied doses would exceed a maximum response level. According to Figure 2, a 150-fold Cyp induction is reached at doses of 62 µg/kg PCB126 and 67.5mg/kg PCB153, which were administered as initial loading doses (124 µg/kg and 135mg/kg, respectively, for the high doses). To keep the PCB levels constant during the entire experiment, weekly maintenance doses were calculated on the basis of the PCBs’ half-lives. The maintenance doses for the low-dose groups were 9.5 µg/kg PCB126 and 10.5mg/kg PCB153 and for the high-dose groups 19 µg/kg PCB126 and 21mg/kg PCB153 per week.
Tumor Initiation/Promotion Study
Mice were initiated with a single dose of DEN and promoted by treatment with PCBs for 21 weeks using the doses described above. Groups of animals were killed 25 or 34 weeks after DEN treatment (for details, see Table 1 and Fig. 1). Animal weights and absolute liver weights were very similar in all treatment groups (not shown). Relative liver weights were also not consistently affected by PCB treatment (Fig. 4).
Fig. 4.

Relative liver weights of mice. Animals were analyzed 25 or 34 weeks after DEN application. For treatment conditions and animal numbers, see Table 1. Data are shown as means + SD. H, high dose; L, low dose; cPCBs, combined PCB126/153 treatment group.
PCB Content and Cyp Induction in Liver
PCB levels and Cyp mRNA expression were measured in livers of animals killed 25 weeks after DEN treatment. At the low dose of PCB126, liver contents and Cyp1a1 induction (Figs. 5A and B) were ~20% higher than intended (~720ng/g vs. ~600ng/g; 177-fold vs. 150-fold expected). Liver contents at the low dose of PCB153 (Fig. 5D) were also ~20% higher than intended (~18.2 µg/g vs. ~15 µg/g), whereas Cyp2b10 induction was much less than expected (28-fold vs. 150-fold expected; Fig. 5E). The latter was surprising but correlates well with our data shown in Figs. 2 and 3, where Cyp2b10 induction decreased strongly with time after PCB153 application although liver contents were still elevated. Cyp expression in the high–PCB dose groups was generally more than double the values of the low-dose groups. Induction of Cyp1a1 was significantly (p = 0.0078) higher in the combined PCB126/153 group than the sum of the effects seen in the respective low-dose groups (Fig. 5B); no such interaction between the two congeners was seen with respect to Cyp2b10. We also analyzed the mRNA levels of AhR and CAR, two nuclear receptors regulating induction of Cyp1a1 and Cyp2b10, respectively, as well as Cyp2e1, GSTm3, and Ugt1a6 (Figs. 5C and F–I). Except for GSTm3, which was significantly induced by PCB153 but not by PCB126, none of the other mRNAs showed the characteristic pattern of Cyp1a1 or Cyp2b10 expression. AhR, CAR, and Cyp2e1 are no targets of PB-type or dioxin-type inducers. Ugt1a6 is moderately inducible by TCDD, but likely the PCB levels in our study were too low to see such an effect.
Fig. 5.

PCB contents in liver and expression of selected mRNAs encoding drug-metabolizing enzymes and nuclear receptors determined 25 week after DEN treatment. Gene expression was analyzed by RT-PCR; results from PCB treatment groups were related to oil-treated controls set to one. Statistically significant differences between oil control and individual PCB treatment groups are indicated. PCB contents in liver were determined in three animals per treatment group. RT-PCR analyses were done with all animals per group (n = 9–14). H, high dose; L, low dose; cPCBs, combined PCB126/153 treatment group.
Cyp induction was further analyzed by Western blotting with antibodies against Cyp1a or Cyp2b and by enzymatic assays specific for either Cyp1a (EROD) or Cyp2b (PROD). Both analyses showed the expected increases in the respective PCB-treated groups over non-PCB-treated controls (Fig. 6, Table 3). Analysis of PROD activity indicated a significant interaction between both PCBs in the combination group (p = 0.0019). In summary, combined treatment with PCB126 and PCB153 showed more than additive effects on induction of Cyp1a1 mRNA in particular and—less pronounced—on Cyp1a1 protein expression and catalytic activity. There were no such additive effects for Cyp2b10 mRNA and protein but for PROD activity.
Fig. 6.
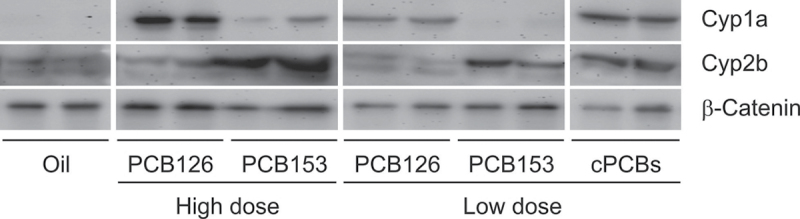
Western blot analysis with normal liver tissue isolated from PCB-treated or control mice at 25 weeks after DEN treatment. Antibodies directed against Cyp1a1, Cyp2b10, and the housekeeping protein β-catenin were used. cPCBs; combined PCB126/153 treatment group.
Table 3 .
Cytochrome P450 Activities in Livers of Mice (25 Weeks After DEN)
| Treatment group | No. of mice | EROD activity (pmol resorufin/min/mg protein)a | PROD activity (pmol resorufin/min/mg protein)a |
|---|---|---|---|
| DEN/oil | 5 | 0.31±0.07 | 0.09±0.02 |
| DEN/PCB153 Hb | 5 | 1.59** ± 0.25 | 0.75** ± 0.18 |
| DEN/PCB153Lb | 5 | 0.45±0.25 | 0.50** ± 0.09 |
| DEN/PCB126 Hb | 5 | 11.11** ± 5.04 | 0.21** ± 0.06 |
| DEN/PCB126Lb | 5 | 5.33** ± 1.37 | 0.16* ± 0.02 |
| DEN/cPCBs L/Lb | 5 | 8.05** ± 2.00 | 0.47** ± 0.16 |
Notes. aEROD/PROD activities of the respective treatment groups are given as mean ± SD.
bH, high dose; L, low dose; cPCBs, combined PCB126/153 treatment group. Significantly different from group DEN/oil with **p < 0.0001, *p = 0.002.
Tumor-Promoting Effect of PCBs
Tumor multiplicity (average number of tumors per mouse) at 25 weeks after DEN treatment was close to zero for all treatment groups (Table 4). There were only three tumors larger than 2mm in diameter, one each in the DEN/oil, the DEN/PCB153 low dose, and the DEN/PCB126/153 treatment group. The value of 0.79 in the combination group 6 was higher than that in group 4 (0; PCB126 high dose); however, we regard the complete lack of tumors in group 4 as an outlier, not seen in the low-dose group 5. Tumor multiplicities in animals killed 34 weeks after DEN treatment are also summarized in Table 4. Due to a rather low tumor response and large variations between animals, there were no significant differences between the various treatment groups. Likewise, size class distributions of tumors were very similar in all groups (not shown).
Table 4 .
Tumor Multiplicity
| Group | DEN | PCB153 | PCB126 | Tumor multiplicitya (average no. of tumors/mouse) | |
|---|---|---|---|---|---|
| 25 | 34 | ||||
| Weeks after DEN | |||||
| 1 | + | − | − | 0.21 | 1.31 |
| 2 | + | Hb | − | 0.30 | 2.91 |
| 3 | + | Lb | − | 0.39 | 1.50 |
| 4 | + | − | Hb | 0 | 2.18 |
| 5 | + | − | Lb | 0.31 | 2.11 |
| 6 | + | Lb | Lb | 0.79 | 2.44 |
| 7 | − | − | − | − | 0.20 |
| 8 | − | Hb | − | − | 0 |
| 9 | − | − | Hb | − | 0 |
| 10 | − | Lb | Lb | − | 0.25 |
Notes. aValues indicate the total numbers of tumors observed on the surface of the livers upon sacrifice divided by the number of effective animals in the respective treatment groups (see Table 1).
bH, high dose; L, low dose.
We also performed morphometric analyses of enzyme-altered lesions, which can be identified in liver sections stained for marker enzymes such as G6Pase or GS. G6Pase activity is known to be altered (mostly decreased) in early liver lesions and tumors. Quantitative data on G6Pase-altered lesions are summarized in Figure 7. G6Pase-altered liver lesions were barely detectable in animals not initiated with DEN. Animals treated with DEN plus PCBs mostly had higher numbers of lesions per cubic centimeter of liver tissue than DEN/oil controls. The effects, however, were not statistically significant for the individual congeners, neither at the low nor at the high dose. A significant effect, however, was seen in the combination group, both at the 25 and the 34 week time points. The volume fraction of G6Pase-altered lesions in DEN-initiated groups strongly increased with time but was not significantly altered by treatment with PCB126, PCB153, or a mixture thereof. Additional liver sections were stained for GS, which is selectively increased in liver tumors with mutations in the ctnnb1-gene, encoding β-catenin (Loeppen et al., 2002). GS-positive lesions, however, were very rare and their occurrence was not affected by PCB treatment (not shown). PCB153 has recently been shown to select for ctnnb1 mutated, GS-positive liver tumors (Strathmann et al., 2006). Because a much higher dose of PCB153 was used in the study of Strathmann et al., the absence of GS-positive lesions in the present study may be taken as an indication that higher liver concentrations of PB-type tumor promoters are required to select for GS-positive, ctnnb1 mutated hepatocytes.
Fig. 7.

Carcinogenic response in the liver of mice. The number of enzyme-altered liver lesions per cubic centimeter of tissue and their volume fraction in liver were determined using G6Pase-stained liver sections. Animals were analyzed 25 or 34 weeks after DEN application. For treatment conditions and animal numbers, see Table 1. Data are shown as means + SEM. H, high dose; L, low dose; combined PCB126/153 treatment group.
Proliferation of hepatocytes in PCB-treated and control animals was assessed by labeling with BrdU, which was administered in the drinking water 3 days prior to killing. As shown in Figure 8, BrdU labeling in livers of DEN-treated animals was generally higher than in the respective groups without DEN. This may be due to the presence of small DEN-induced liver lesions, which could not be discriminated from normal liver in the BrdU-stained sections. Treatment with PCBs, alone or in combination, did not significantly affect BrdU labeling indices. The labeling indices were significantly higher, however, in livers of mice of the DEN treatment groups compared with those of mice not treated with DEN (p < 0.0001).
Fig. 8.

BrdU labeling indices. The percentage of BrdU-positive hepatocyte nuclei was determined 25 weeks after DEN treatment (DEN groups) or at 34 weeks (non-DEN groups) using liver sections stained with an anti-BrdU antibody and hematoxylin. Data are shown as box plots from 4–5 animals per treatment group. H, high dose; L, low dose; cPCBs, combined PCB126/153 treatment group.
Proteome Analysis
Aliquots from normal appearing liver of animals of the different treatment groups sacrificed at the first time point (25 weeks after DEN treatment) were used for a proteome analysis. Proteins were separated by 2D-PAGE and subsequently statistically analyzed. On average, 2782 protein spots per run were detected in the tissue samples. Significantly altered spots were isolated and subsequently identified using MALDI-TOF-TOF analysis. When applying threshold levels of p ≤ 0.05 and ≥ 2-fold and ≤ 0.5-fold cutoffs for increases and decreases in protein level, respectively, a total of 20 proteins was found to be significantly altered by PCB treatment of mice (Table 5). Using the above cutoffs, only upregulated proteins were significantly altered; the levels of 12 proteins were affected by PCB153, 5 by PCB126, and 16 by combined treatment with the two congeners. The comparison between groups indicates little overlap in proteins showing significant changes in either the PCB153 or the PCB126 groups, while 10 of the 16 significantly altered proteins in the PCB combination groups were also altered in at least one of the PCB-only groups.
Table 5 .
Liver Proteome Analysis
| Proteina | Accession number | PCB153 | PCB126 | PCB153 + PCB126 | ||
|---|---|---|---|---|---|---|
| Lb | Hb | Lb | Hb | L/Lb | ||
| Fructose-bisphosphate aldolase B | Q91Y97 | 1.77 | 2.53 | 1.85 | ||
| Triosephosphate isomerase | P17751 | 2.03 | 2.64 | |||
| Carboxylesterase 3 | Q8VCT4 | 1.51 | 1.58 | 2.02 | ||
| Liver carboxylesterase 31 | Q63880 | 1.57 | ||||
| Ester hydrolase C11orf54 homolog | Q91V76 | 1.58 | ||||
| Probable D-lactate dehydrogenase, mitochondrial | Q7TNG8 | 1.61 | ||||
| UDP-glucose 6-dehydrogenase | O70475 | 1.64 | 1.80 | 1.70; 2.66 | ||
| Peroxiredoxin-6 | O08709 | 1.74 | 1.76 | |||
| Serum paraoxonase/arylesterase | P52430 | 1.84 | 2.11 | 2.68 | 3.17 | |
| Selenium-binding protein | Q63836 | 2.27 | 2.05 | |||
| Anionic trypsin-1 | P00762 | 2.37 | 2.06 | |||
| Glutathione S-transferase Mu | P10649 | 2.67 | 2.40 | |||
| Alpha-1-antitrypsin | P07758 | 4.36 | ||||
| Protein disulfide-isomerase A3 | P27773 | 1.53 | 1.57 | |||
| Keratin, type I cytoskeletal 10 | P02535 | 1.66 | 1.71 | |||
| Glyoxylate reductase/hydroxypyruvate reductase | Q91Z53 | 1.56 | ||||
| Flavin reductase | Q923D2 | 1.65 | ||||
| 14-3-3 Protein sigma | O70456 | 1.54 | ||||
| 14-3-3 Protein beta/alpha | Q9CQV8 | 1.72 | ||||
| 14-3-3 Protein zeta/delta | P63102 | 1.82 | ||||
Notes. aProteins that showed significant (p ≤ 0.05) changes in their liver concentration when using cutoff levels of ≥ 2-fold increase or ≤ 0.5-fold decrease (proteins with ≤ 0.5-fold decrease were not detected).
bL, low dose; H, high dose.
DISCUSSION
The effect of individual and combined application of the dioxin-like PCB126 and the non-dioxin-like PCB153 on CYP induction and tumor promotion in mice was evaluated. Recent studies using mixtures containing PCB126 and PCB153 have shown conflicting results regarding their tumor-promoting effects in rodent liver ranging from antagonistic (Dean et al., 2002; Haag-Gronlund et al., 1998) to synergistic effects (Bager et al., 1995; NTP, 2006). Both coplanar dioxin-like PCBs that bind and activate the AhR and noncoplanar non-dioxin-like PCBs which operate through CAR/PXR activation have been demonstrated to act as promoters of hepatocarcinogenesis in rodents (Glauert et al., 2001). Tumor promotion by PCB153 in mouse liver consists in the positive selection for ctnnb1 (β-catenin) mutated hepatocytes, which were generated by DEN during tumor initiation in the initiation/promotion study (Strathmann et al., 2006); in the same study, PCB153 did not significantly affect, however, the proliferation of Ha-ras or B-raf mutated liver tumors. The PCB153 congener therefore behaves like the model tumor promoter PB, a CAR activator that also selectively stimulates the proliferation of ctnnb1 mutated hepatocytes in mouse liver (Aydinlik et al., 2001). A comparable screen for mutations in oncogenes in liver tumors generated in an initiation/promotion experiment with the dioxin-like PCB126 has, to our knowledge, not been performed. The frequency of ctnnb1 mutations in mouse liver tumors induced by TCDD, however, was very low (Devereux et al., 1999), and liver tumors from mice harboring a constitutively active form of the AhR were GS negative (Moennikes et al., 2004). On the other hand, ~80% of liver tumors in mice generated by initiation with vinyl carbamate followed by TCDD promotion were Ha-ras codon 61 mutated (Watson et al., 1995), whereas PB, promoting ctnnb1 mutated hepatocytes in mouse liver, seems to inhibit the outgrowth of liver tumors mutated in Ha-ras (Aydinlik et al., 2001). In summary, these results suggest that dioxin-like and non-dioxin-like PCB congeners, acting through different primary receptors (AhR and CAR/PXR, respectively), select for subpopulations of hepatocytes that differ with respect to their geno/phenotype (Schwarz and Appel, 2005). This hypothesis was the starting point for our present study, where PCB153 and PCB126 were analyzed with respect to their tumor-promoting activity in mouse liver when given in combination. Different theoretical scenarios were conceivable, from synergistic effects (both congeners acting on the same target population of initiated cells) to antagonistic effects (PCB153 inhibiting the outgrowth of PCB126-promoted lesions mutated in Ha-ras).
The results of the tumor promotion study rule out the latter possibility and favor the idea of response additivity of the two PCBs, even though the tumor-promoting effects in the combination were only small. The reason for the lack of strong tumor-promoting activity in the present experiment is not related to inefficient tumor initiation because we observed a significant carcinogenic response in mice of all of the DEN treatment groups, in particular at the second time point of analysis (34 weeks after DEN treatment). More likely, the concentration of the PCB congeners in liver of the treated animals was too low to stimulate the proliferation of the DEN-induced lesions in mice. This is in contrast to previous studies with rats where liver tumor–promoting activities of PCB126, PCB153, and other PCB congeners have been clearly established (see Buchmann et al., 1986, 1991; for review, see Glauert et al., 2001). A second major difference between our and previously published initiation/promotion studies relates to the dose regimen that we used: In the published studies, constant doses of PCBs were administered, mostly weekly or biweekly. Under these conditions, it has to be expected that PCB concentrations in liver increase constantly due to their long half-life in the body. By contrast, we used an initial high loading dose, followed by weekly applications of a constant low maintenance dose, which leads to fairly stable steady-state liver PCB concentrations during the treatment period. In the high-dose group, we administered a total dose of 523 µg/kg body weight of PCB126 and 576mg/kg body weight of PCB153. Of these, we found 24.2% of PCB126 retained in liver at the first sacrifice time point compared with only 0.47% for the PCB153 congener. Because similar half-lives of ~25 days were estimated for both congeners based on the data of the dose-finding experiment, this discrepancy was unexpected. Probably, a much larger fraction of the hexachlorinated PCB153 is redistributed from liver into the body fat fraction compared with PCB126, which—having one chlorine atom less—is probably less lipophilic. Liver levels of PCB153 were also measured in a previous initiation/promotion experiment with mice (Glauert et al., 2008). A rough estimation from the reported data of their study indicates that the liver PCB153 concentration at the end of the treatment period was approximately 6–7 times higher than the one reached in our study. Even at this much higher concentration, however, the carcinogenic response in liver was only enhanced about threefold by PCB153. We are not aware of any literature data on PCB126 concentrations in mice, which would allow a similar comparison for this congener.
PCB126, PCB153, or the combination of both did not significantly affect the liver/body weight ratio or the BrdU labeling index in liver. However, they significantly increased the levels and activities of Cyp2b10 (PCB153) and Cyp1a1 (PCB126), which were selected as known targets of the two nuclear receptors CAR/PXR and AhR, respectively (Muangmoonchai et al., 2001; Safe, 1994). Cyp2b10 was also slightly induced by PCB126, whereas the effect of PCB153 on Cyp1a1 mRNA expression was only marginal (Fig. 5). Even though the PCB153 preparation used in our study was of the highest purity (see Supplementary Data), we cannot entirely rule out the possibility that this latter effect was due to traces of a dioxin-like PCB not detectable by the GC-MS method used for purity control. Interestingly, both congeners given together elicited a more than additive effect on Cyp1a1 mRNA expression (p = 0.0078) and protein level (Figs. 5 and 6) and on PROD activity (p = 0.0019; Table 3). No significant effects of the combination were seen on Cyp1b10 mRNA, protein, and EROD activity. PCB153 has been demonstrated to increase AhR levels in rodent liver (Denomme et al., 1986a), and an increase in Cyp1a-dependent EROD activity was observed in mice treated with PCB153 along with a pentachlorodibenzo-p-dioxin or a respective polychlorinated furan (De Jongh et al., 1995; Denomme et al., 1986b). On the other hand, coadministration of PCB153 with a high dose of TCDD increased PCB153 in liver because of interactive pharmacokinetic effects (Van Birgelen et al., 1996). In summary, our data are in line with previous reports demonstrating an interaction between non-dioxin-like PCBs and dioxin-like PCBs or dioxins with respect to Cyp induction.
In order to get further insights into the mechanism of action of PCB153 and PCB126, a proteome analysis was performed with normal appearing liver tissue from DEN/PCB-treated mice of the first sacrifice time point (25 weeks after DEN treatment). Significantly downregulated proteins were not detected when applying a cutoff of 0.5-fold reduction in protein tissue level. With the second cutoff set at a twofold increase (and p ≤ 0.05), 20 proteins were found to be deregulated by the PCBs (Table 5). PCB153 affected more than twice the number than PCB126. This contrasts the effect of the two congeners on Cyp expression: The inducing effect of PCB126 (high dose) on Cyp1a1 mRNA was about eightfold higher than the corresponding effect of PCB153 (high dose) on Cyp2b10 induction. Because of the methodology used for proteome analysis, membrane-associated Cyps were not accessible for the analysis and do therefore not appear in Table 5. However, glutathione-S-transferase-mu, a soluble enzyme of phase II of drug metabolism, was significantly increased by PCB153 in the high dose and in the combination group, which is in accordance with the observed increase in its mRNA (Fig. 5H). In liver of PCB153-treated mice, aldolase B, triosephosphate isomerase, and lactate dehydrogenase showed increased levels. Because the three enzymes are involved in glycolysis, this metabolic pathway may be increased in liver of PCB153-treated mice. The most strongly upregulated protein was alpha-1-antitrypsin (A1AT), which was, however, only affected in the PCB combination group. The protease inhibitor A1AT belongs to the serpin superfamily. The increased level of the protein may be indicative of inflammatory processes occurring in liver of the PCB-treated mice because A1AT protects tissues from proteases secreted by inflammatory cells. Overt signs of inflammation in the liver sections from mice of this group were not seen, however. Another group of proteins that was selectively upregulated in mice of the PCB combination group belong to the 14-3-3 family. Affected were the isoforms beta/alpha (β/α), the α-isoform representing the phosphorylated form of β, zeta/delta (ζ/δ), and sigma (σ). 14-3-3 proteins constitute a highly conserved protein family involved in vital cellular processes controlling the activity of key proteins of various intracellular signaling pathways. In very general terms, 14-3-3 proteins have pro-proliferative and antiapoptotic activity (for a recent review, see Morrison, 2009). Because of the diversity of functions of 14-3-3 proteins, we do not know what the consequences of the upregulation of the three protein isoforms are. Nevertheless, it is of interest that their levels, like that of A1AT, were only affected in livers of animals treated simultaneously with both PCB congeners. This suggests that there is some interaction between the two PCBs, producing a phenotype not seen with either PCB alone.
In conclusion, PCB126 and PCB153, alone or in combination, produced clear-cut biological responses in liver. Known targets such as Cyp1a1 and Cyp2b10 were particularly affected but also several other proteins with diverse intracellular functions. Apparently, however, these changes are mostly adaptive responses and tend to overestimate the carcinogenic response of the PCB congeners: e.g., Cyp1a1 mRNA was increased more than 600-fold by the high dose of PCB126 but no significant increases in relative liver weight, BrdU labeling index, or carcinogenic response were observed in animals of the respective PCB treatment group. Only when PCB126 and PCB153 were combined, a weak, but significant, increase in the number of G6Pase-deficient lesions was observed, but their volume fraction and the number of tumors counted on the liver surface did not increase in this treatment group.
SUPPLEMENTARY DATA
Supplementary data are available online at http://toxsci.oxfordjournals.org/.
FUNDING
National Institute of Environmental Health Sciences (P42 ES 013661); BFR (FK3-1329-305).
Supplementary Material
ACKNOWLEDGMENTS
We thank Dr P. Beaune and Dr R. Wolf for the gift of antibodies. We thank Brigitte Woelffel, Elke Zabinsky, and Johanna Mahr for excellent technical assistance. Support for the synthesis and analysis of PCBs 126 and 153 was provided by NIEHS.
REFERENCES
- Appel K. E. (2003). Risk assessment of non-dioxin-like PCBs—Report on a WHO-Consultation. Fresen. Environ. Bull. 12, 268–275 [Google Scholar]
- Aydinlik H., Nguyen T. D., Moennikes O., Buchmann A., Schwarz M. (2001). Selective pressure during tumor promotion by phenobarbital leads to clonal outgrowth of beta-catenin-mutated mouse liver tumors. Oncogene 20, 7812–7816 [DOI] [PubMed] [Google Scholar]
- Bager Y., Hemming H., Flodström S., Ahlborg U. G., Wärngård L. (1995). Interaction of 3,4,5,3’,4’-pentachlorobiphenyl and 2,4,5,2’,4’,5’-hexachlorobiphenyl in promotion of altered hepatic foci in rats. Pharmacol. Toxicol. 77, 149–154 [DOI] [PubMed] [Google Scholar]
- Bock K. W. (1994). Aryl hydrocarbon or dioxin receptor: Biologic and toxic responses. Rev. Physiol. Biochem. Pharmacol. 125, 1–42 [DOI] [PubMed] [Google Scholar]
- Buchmann A., Kunz W., Wolf C. R., Oesch F., Robertson L. W. (1986). Polychlorinated biphenyls, classified as either phenobarbital- or 3-methylcholanthrene-type inducers of cytochrome P-450, are both hepatic tumor promoters in diethylnitrosamine-initiated rats. Cancer Lett. 32, 243–253 [DOI] [PubMed] [Google Scholar]
- Buchmann A., Ziegler S., Wolf A., Robertson L. W., Durham S. K., Schwarz M. (1991). Effects of polychlorinated biphenyls in rat liver: Correlation between primary subcellular effects and promoting activity. Toxicol. Appl. Pharmacol. 111, 454–468 [DOI] [PubMed] [Google Scholar]
- Bunaciu R. P., Tharappel J. C., Lehmler H. J., Kania-Korwel I., Robertson L. W., Srinivasan C., Spear B. T., Glauert H. P. (2007). The effect of dietary glycine on the hepatic tumor promoting activity of polychlorinated biphenyls (PCBs) in rats. Toxicology 239, 147–155 [DOI] [PMC free article] [PubMed] [Google Scholar]
- Burke M. D., Mayer R. T. (1974). Ethoxyresorufin: Direct fluorimetric assay of a microsomal O-dealkylation which is preferentially inducible by 3-methylcholanthrene. Drug Metab. Dispos. 2, 583–588 [PubMed] [Google Scholar]
- Campbell H. A., Pitot H. C., Potter V. R., Laishes B. A. (1982). Application of quantitative stereology to the evaluation of enzyme-altered foci in rat liver. Cancer Res. 42, 465–472 [PubMed] [Google Scholar]
- Dean C. E., Jr, Benjamin S. A., Chubb L. S., Tessari J. D., Keefe T. J. (2002). Nonadditive hepatic tumor promoting effects by a mixture of two structurally different polychlorinated biphenyls in female rat livers. Toxicol. Sci. 66, 54–61 [DOI] [PubMed] [Google Scholar]
- De Jongh J., DeVito M., Diliberto J., Van den Berg M., Birnbaum L. (1995). The effects of 2,2’,4,4’,5,5’-hexachlorobiphenyl cotreatment on the disposition of 2,3,7,8-tetrachlorodibenzo-p-dioxin in mice. Toxicol. Lett. 80, 131–137 [DOI] [PubMed] [Google Scholar]
- Denomme M. A., Homonko K., Fujita T., Sawyer T., Safe S. (1986a). Substituted polychlorinated dibenzofuran receptor binding affinities and aryl hydrocarbon hydroxylase induction potencies–a QSAR analysis. Chem. Biol. Interact. 57, 175–187 [DOI] [PubMed] [Google Scholar]
- Denomme M. A., Leece B., Li A., Towner R., Safe S. (1986b). Elevation of 2,3,7,8-tetrachlorodibenzo-p-dioxin (TCDD) polychlorinated biphenyls. Structure-activity relationships. Biochem. Pharmacol. 35, 277–282 [DOI] [PubMed] [Google Scholar]
- Devereux T. R., Anna C. H., Foley J. F., White C. M., Sills R. C., Barrett J. C. (1999). Mutation of beta-catenin is an early event in chemically induced mouse hepatocellular carcinogenesis. Oncogene 18, 4726–4733 [DOI] [PubMed] [Google Scholar]
- EFSA (2004). Dioxins, methodologies and principles for setting tolerable intake levels for dioxins, furans and dioxin-like PCBs. EFSA Scientific Colloquium 1, Summary Report, 28–29 June, Brussels, Belgium: [Google Scholar]
- Glauert H. P., Robertson L. W., Silberhorn E. M. (2001). PCBs and tumor promotion. In PCBs, Recent Advances in Environmental Toxicology and Health Effects (Robertson L.W., Hansen L.G, Eds.), pp. 355–371 The University Press of Kentucky, Lexington, KY: [Google Scholar]
- Glauert H. P., Tharappel J. C., Banerjee S., Chan N. L., Kania-Korwel I., Lehmler H. J., Lee E. Y., Robertson L. W., Spear B. T. (2008). Inhibition of the promotion of hepatocarcinogenesis by 2,2’,4,4’,5,5’-hexachlorobiphenyl (PCB-153) by the deletion of the p50 subunit of NF-kappa B in mice. Toxicol. Appl. Pharmacol. 232, 302–308 [DOI] [PMC free article] [PubMed] [Google Scholar]
- Görg A., Obermaier C., Boguth G., Harder A., Scheibe B., Wildgruber R., Weiss W. (2000). The current state of two-dimensional electrophoresis with immobilized pH gradients. Electrophoresis 21, 1037–1053 [DOI] [PubMed] [Google Scholar]
- Haag-Gronlund M., Johansson N., Fransson-Steen R., Hakansson H., Scheu G., Lai I. K., Chai Y., Simmons D., Watson W. H., Tan R., et al. (2008). Gas chromatographic separation of methoxylated polychlorinated biphenyl atropisomers. J. Chromatog. 1207, 146–154 [DOI] [PMC free article] [PubMed] [Google Scholar]
- Hailfinger S., Jaworski M., Braeuning A., Buchmann A., Schwarz M. (2006). Zonal gene expression in murine liver: Lessons from tumors. Hepatology 43, 407–414 [DOI] [PubMed] [Google Scholar]
- IARC Working Group on the Evaluation of Carcinogenic Risks to Humans (2009). A Review of Human Carcinogens. Part F: Chemical Agents and Related Occupations (IARC Monographs on the Evaluation of Carcinogenic risks to Humans; Vol. 100F). IARC, Lyon, France: [PMC free article] [PubMed] [Google Scholar]
- Kania-Korwel I., Vyas S. M., Song Y., Lehmler H. J. (2008). Gas chromatographic separation of methoxylated polychlorinated biphenyl atropisomers. J. Chromatog. A. 1207, 146–154 [DOI] [PMC free article] [PubMed] [Google Scholar]
- Lai I. K., Chai Y., Simmons D., Watson W. H., Tan R., Haschek W. M., Wang K., Wang B., Ludewig G., Robertson L. W. (2011). Dietary selenium as a modulator of PCB 126-induced hepatotoxicity in male Sprague-Dawley rats. Toxicol. Sci. 124, 202–214 [DOI] [PMC free article] [PubMed] [Google Scholar]
- Loconto P. R. (2006). Trace Environmental Quantitative Analysis. CRC Press, Boca Raton: [Google Scholar]
- Loeppen S., Schneider D., Gaunitz F., Gebhardt R., Kurek R., Buchmann A., Schwarz M. (2002). Overexpression of glutamine synthetase is associated with beta-catenin-mutations in mouse liver tumors during promotion of hepatocarcinogenesis by phenobarbital. Cancer Res. 62, 5685–5688 [PubMed] [Google Scholar]
- Moennikes O., Buchmann A., Romualdi A., Ott T., Werringloer J., Willecke K., Schwarz M. (2000). Lack of phenobarbital-mediated promotion of hepatocarcinogenesis in connexin32-null mice. Cancer Res. 60, 5087–5091 [PubMed] [Google Scholar]
- Moennikes O., Loeppen S., Buchmann A., Andersson P., Ittrich C., Poellinger L., Schwarz M. (2004). A constitutively active dioxin/aryl hydrocarbon receptor promotes hepatocarcinogenesis in mice. Cancer Res. 64, 4707–4710 [DOI] [PubMed] [Google Scholar]
- Morrison D. K. (2009). The 14-3-3 proteins: Integrators of diverse signaling cues that impact cell fate and cancer development. Trends Cell Biol. 19, 16–23 [DOI] [PMC free article] [PubMed] [Google Scholar]
- Muangmoonchai R., Smirlis D., Wong S. C., Edwards M., Phillips I. R., Shephard E. A. (2001). Xenobiotic induction of cytochrome P450 2B1 (CYP2B1) is mediated by the orphan nuclear receptor constitutive androstane receptor (CAR) and requires steroid co-activator 1 (SRC-1) and the transcription factor Sp1. Biochem. J. 355(Pt 1), 71–78 [DOI] [PMC free article] [PubMed] [Google Scholar]
- NTP (2006). Technical report on the toxicology and carcinogenesis studies of a binary mixture of 3,3’,4,4’,5-Pentachlorobiphenyl (PCB 126) (CAS NO. 57465-28-8) and 2,2’,4,4’,5,5’-Hexachlorobiphenyl (PCB 153) (CAS NO. 35065-27-1) in female Harlan Sprague-Dawley rats (gavage studies), NTP TR 530. NIH Publication No. 06-4466. National Toxicology Program, National Institutes of Health, Public Health Service, U.S. Department of Health and Human Services, Research Triangle Park, NC: [PubMed] [Google Scholar]
- Pfaffl M. W. (2001). A new mathematical model for relative quantification in real-time RT-PCR. Nucleic Acids Res. 29, e45 [DOI] [PMC free article] [PubMed] [Google Scholar]
- Prough R. A., Burke M. D., Mayer R. T. (1978). Direct fluorometric methods for measuring mixed function oxidase activity. Meth. Enzymol. 52, 372–377 [DOI] [PubMed] [Google Scholar]
- Safe S. H. (1994). Polychlorinated biphenyls (PCBs): Environmental impact, biochemical and toxic responses, and implications for risk assessment. Crit. Rev. Toxicol. 24, 87–149 [DOI] [PubMed] [Google Scholar]
- Schmitz H. J., Hagenmaier A., Hagenmaier H. P., Bock K. W., Schrenk D. (1995). Potency of mixtures of polychlorinated biphenyls as inducers of dioxin receptor-regulated CYP1A activity in rat hepatocytes and H4IIE cells. Toxicology 99, 47–54 [DOI] [PubMed] [Google Scholar]
- Schramm H., Robertson L. W., Oesch F. (1985). Differential regulation of hepatic glutathione transferase and glutathione peroxidase activities in the rat. Biochem. Pharmacol. 34, 3735–3739 [DOI] [PubMed] [Google Scholar]
- Schwarz M., Appel K. E. (2005). Carcinogenic risks of dioxin: Mechanistic considerations. Regul. Toxicol. Pharmacol. 43, 19–34 [DOI] [PubMed] [Google Scholar]
- Strathmann J., Paal K., Ittrich C., Krause E., Appel K. E., Glauert H. P., Buchmann A., Schwarz M. (2007). Proteome analysis of chemically induced mouse liver tumors with different genotype. Proteomics. 7, 3318–3331 [DOI] [PubMed] [Google Scholar]
- Strathmann J., Schwarz M., Tharappel J. C., Glauert H. P., Spear B. T., Robertson L. W., Appel K. E., Buchmann A. (2006). PCB 153, a non-dioxin-like tumor promoter, selects for beta-catenin (Catnb)-mutated mouse liver tumors. Toxicol. Sci. 93, 34–40 [DOI] [PubMed] [Google Scholar]
- Ueda A., Hamadeh H. K., Webb H. K., Yamamoto Y., Sueyoshi T., Afshari C. A., Lehmann J. M., Negishi M. (2002). Diverse roles of the nuclear orphan receptor CAR in regulating hepatic genes in response to phenobarbital. Mol. Pharmacol. 61, 1–6 [DOI] [PubMed] [Google Scholar]
- van Birgelen A. P., Ross D. G., DeVito M. J., Birnbaum L. S. (1996). Interactive effects between 2,3,7,8-tetrachlorodibenzo-p-dioxin and 2,2’,4,4’, 5,5’-hexachlorobiphenyl in female B6C3F1 mice: Tissue distribution and tissue-specific enzyme induction. Fundam. Appl. Toxicol. 34, 118–131 [DOI] [PubMed] [Google Scholar]
- Van den Berg M., Birnbaum L., Bosveld A. T., Brunström B., Cook P., Feeley M., Giesy J. P., Hanberg A., Hasegawa R., Kennedy S. W, et al. (1998). Toxic equivalency factors (TEFs) for PCBs, PCDDs, PCDFs for humans and wildlife. Environ. Health Perspect. 106, 775–792 [DOI] [PMC free article] [PubMed] [Google Scholar]
- van der Plas S. A., Haag-Grönlund M., Scheu G., Wärngård L., van den Berg M., Wester P., Koeman J. H., Brouwer A. (1999). Induction of altered hepatic foci by a mixture of dioxin-like compounds with and without 2,2’,4,4’,5,5’-hexachlorobiphenyl in female Sprague-Dawley rats. Toxicol. Appl. Pharmacol. 156, 30–39 [DOI] [PubMed] [Google Scholar]
- Watson M. A., Devereux T. R., Malarkey D. E., Anderson M. W., Maronpot R. R. (1995). H-ras oncogene mutation spectra in B6C3F1 and C57BL/6 mouse liver tumors provide evidence for TCDD promotion of spontaneous and vinyl carbamate-initiated liver cells. Carcinogenesis 16, 1705–1710 [DOI] [PubMed] [Google Scholar]
Associated Data
This section collects any data citations, data availability statements, or supplementary materials included in this article.