


Abstract
We propose a novel approach to background correction for Infinium HumanMethylation data to account for technical variation in background fluorescence signal. Our approach capitalizes on a new use for the Infinium I design bead types to measure non-specific fluorescence in the colour channel opposite of their design (Cy3/Cy5). This provides tens of thousands of features for measuring background instead of the much smaller number of negative control probes on the platforms (n = 32 for HumanMethylation27 and n = 614 for HumanMethylation450, respectively). We compare the performance of our methods with existing approaches, using technical replicates of both mixture samples and biological samples, and demonstrate that within- and between-platform artefacts can be substantially reduced, with concomitant improvement in sensitivity, by the proposed methods.
INTRODUCTION
Epigenetic marks play a central role in gene regulation (1). Perhaps the two most widely studied epigenetic marks are histone tail modifications and DNA methylation (in particular, 5-methylcytosine). Bisulfite conversion of unmethylated cytosines to uracils, followed by amplification, allows existing genotyping and sequencing technologies to be repurposed for studies of DNA methylation. Small (sub-microgram) amounts of DNA from hundreds of samples can be assayed at thousands of sites throughout the genome using high-density microarrays (2), for a fraction of the cost of whole-genome bisulfite resequencing. As with all microarray technologies, however, signal processing is an important consideration in obtaining consistent, reproducible results (3).
The Illumina BeadArray platform, in the form of the HumanMethylation27 (HM27) and HumanMethylation450 (HM450) assays, is widely used to study genomic DNA methylation. At each targeted cytosine position, the fluorescence intensities of the methylated and unmethylated signals are measured. DNA methylation level is estimated by the ratio of DNA methylation intensity over the total, M/(M+U), where M and U denote the average fluorescent signals from the methylated and unmethylated bead types, respectively. Illumina adds a stabilizing constant of 100 in the denominator, and calls the ratio the average Beta value. A benefit of Illumina’s HM450 BeadArray design is that for each probe sequence, a median of 14 beads are randomly distributed on the array, with each bead containing hundreds of thousands of oligonucleotides. The HM27 measures even more beads per probe. Further, Illumina organizes arrays into 12-sample BeadChips offering great potential for automation. However, as with the analysis of gene expression BeadChips, the sequential processing of samples can give rise to specific types of technical artifacts. Potential issues include the variation in background fluorescence (4), the positional effects on a single BeadChip (5) and efficiency of bisulfite conversion (6). We focus on the issue of array-to-array variation in non-specific (background) fluorescence.
In microarray studies, background fluorescence appears to contribute an independent additive error to the measure of signal. The observed intensity (also known as foreground, Xf) is modelled as the sum of true signal (XS) and background (Xb), Xf = XS + Xb. An additive bias on the intensity translates to a reduced dynamic range for the Beta value. The goal of background correction methods is to estimate the true signal from the observed foreground. The primary methods currently available for HumanMethylation arrays use a simple background subtraction, a method that suffers from truncation of the data at low intensity signals (e.g. GenomeStudio 2011.1 and ‘lumi’ package in Bioconductor 2.10). The de facto standard for expression microarray background correction is the normal-exponential convolution, with the desirable feature of smooth interpolation, rather than truncation, of low intensity signals (7). We evaluate the use of convolution models for background correction of DNA methylation arrays, considering three models. First, we adapt the popular normal-exponential convolution model to the two-colour BeadArray design; second, we introduce a novel Gamma convolution model, a generalization of both the normal-exponential and Gamma-exponential (8); third, we adapt a distribution-free approach previously proposed for Affymetrix GeneChips. For each of the convolution models, we capitalize on the unique design of the Infinium I chemistry DNA methylation probes, to vastly increase the number of features on the array from which we measure background fluorescence. We find that convolution models that use the Infinium I chemistry probes to measure background improve the consistency of measures at identical target sequences from multiple arrays of the same biological samples, and show less bias than other methods in estimates of percent DNA methylation, as determined from calibrated mixture samples.
MATERIALS AND METHODS
Illumina HumanMethylation27 and HumanMethylation450 BeadArrays
The Illumina HM27 array interrogates 27 578 targeted CpGs. Each array includes 144 control bead types, 32 of which are ‘negative’ controls designed to not match any genomic regions and thus measure background fluorescence. The HM450 array interrogates 485 577 targets, of which 482 421 are CpGs (>99.3%), 3091 are CpHs (0.6%) and 65 are SNPs (<0.1%). A total of 850 control bead types are assayed, 614 of which are ‘negative’ controls. Six hundred of the negative controls are used by GenomeStudio for background correction.
The bead types on the array use two probe chemistries (Infinium I and Infinium II) and two colour dyes (Cy3-Green/Cy5-Red) (2). Infinium I probes are paired 50-base oligonucleotides, with one terminating directly across from a methylated ‘C’ and the second from an unmethylated ‘C’. The extension base fluorophore dictates the colour channel (Cy3 for ‘C’ and Cy5 for ‘A’ or ‘T’), and is the same for both the methylated and unmethylated probes within a pair, so that both probes fluoresce at the same wavelength. Infinium II probes have a single 49-base oligonucleotide that hybridizes to the bisulfite-converted target sequence in a non-DNA methylation-dependent fashion upstream of the target CpG. The DNA methylation of the interrogated CpG is measured by extension of either a Cy3-linked base for methylated sites or a Cy5-linked base for unmethylated sites. These probes are designed to fluoresce at either wavelength (Cy3 for methylated, Cy5 for unmethylated). All probes on the HM27 array use the Infinium I chemistry; the HM450 array uses a combination of both (30% Infinium I and 70% Infinium II).
As probe pairs using the Infinium I chemistry fluoresce at the same wavelength, all fluorescence from probes of this design at the wavelength of the opposite fluorophore—that which is not the extension base—can be used to estimate non-specific fluorescence across the array. All 27 578 probes on the HM27 array and 135 501 (30%) of the probes on the HM450 array are of this type, and provide fluorescence signals in the opposite channel from probe design (‘out-of-band’). On the HM27 array, 15 500 Cy3 and 12 078 Cy5 probe pairs yield 31 000 and 24 156 features in each channel, respectively, numbers in vast excess of the 32 ‘negative’ controls on the platform. The corresponding numbers for the HM450 array are 92 596 Cy3 and 178 406 Cy5 features for estimating non-specific fluorescence. We use these sets of features when correcting for background using the convolution models described below.
Data extraction
The Illumina GenomeStudio software does not provide signal intensities for Infinium I probes in the opposite channel from the designed fluorophore. Therefore, we enhanced routines originally implemented by Dr Keith Baggerly, and later incorporated into the ‘crlmm’ package in Bioconductor (9) to recover this ‘out-of-band’ information from the binary .IDAT files produced by Illumina scanners. These procedures, and all processing methods described below, are available through Bioconductor in the package ‘methylumi’.
Background correction
For all background-correction methods, probes are corrected within each colour channel, after pooling all types of specific probes assayed in that channel. The green channel probes include all Cy3 channel Infinium I probe pairs and the methylated cytosine Infinium II probes on the HM450 arrays. The red channel probes include the Cy5 channel Infinium I probe pairs and the unmethylated cytosine Infinium II probes. For clarity of presentation, the colour channel information is not noted for the methods detailed below.
Table 1 provides a summary of all the background-correction approaches. Three convolution models are considered.
Table 1.
Methods to correct for background fluorescence on HumanMethylation BeadArrays
| Name | Method | Controls | Distributions |
|---|---|---|---|
| noob | normexp (performs Normal-Exp convolution) | Out-of-band intensities | 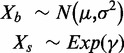 |
| goob | Gamma convolution | Out-of-band intensities | 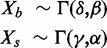 |
| doob | Distribution-free convolution | Out-of-band intensities | None |
| normexp | normexp | Negative controls |  |
| dfcm | Distribution-free convolution | Negative controls | None |
| q5 | Subtract fifth percentile | Negative controls | None |
| lumi | lumi (performs background subtraction) | Methylated probe allele intensities | None |
Offset of 15 is added to xs or E[Xs|Xf].
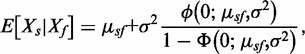
i. Normal-exponential convolution. This method is described in detail by Ritchie et al. (7). Here we review the model, facilitating below the introduction of the more flexible Gamma convolution. Let Xb ∼ N(μ,σ2) and XS ∼ Exp(γ), and the observed foreground intensity Xf = XS + Xb. We estimate parameters from the background distribution using the control probes, and the signal parameter γ from the observed foreground intensities with the background mean subtracted ( ). The conditional expectation of the signal given the observed foreground and background is computed by,
 |
where 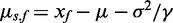 ,
,  the standard normal density and
  the cumulative normal distribution. Details of the estimation procedure are given in (7). Using the conditional expectation smoothly interpolates probes with intensities near the background level. We evaluate the approach using two separate populations of control probes: (a) negative control probes (‘normexp’) and (b) ‘out-of-band’ Infinium I probes (‘noob’ = Normal-exponential using out-of-band probes).
ii. Gamma convolution. We developed and implemented a Gamma-Gamma convolution, with background intensity distribution Gamma(δ,β) and signal abundance distribution Gamma(γ,α). The model was chosen to restrict the range for the background fluorescence intensities to positive values, and to include the exponential signal distribution as a special case. Assuming mild restrictions on the shape and scale differences between two Gamma-distributed random variables, their sum can be modelled as approximately Gamma-distributed as well (http://ideas.repec.org/p/dgr/kubcen/200770.html). The signals for background are estimated using the out-of-band intensities, and the signal abundance parameters from the background subtracted foreground measures after forcing observations less than one to one [=max(Xf-δβ2,1)]. The conditional expectation of the signal given foreground is given by
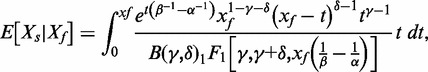 |
where B(γ,δ) is a Beta distribution and 1F1(a,b,x) is the confluent hypergeometric function.
A fast maximum likelihood estimator (http://research.microsoft.com/en-us/um/people/minka/papers/minka-gamma.pdf) is used to estimate the parameters from the data, and numerical integration is then performed to obtain the conditional expectation of the signal given the foreground and background intensities. To avoid instability in the numerical integration step, we use a simple heuristic: if an observation is greater than three standard deviations above the mean of the background, we simply subtract the background mean. In simulations, differences between the integral computed to arbitrary precision via the ‘mpmath’ package, and the approximation we use, were so small as to vanish at 64-bit machine precision. We call this method ‘goob’ for Gamma out-of-band background correction.
iii. Distribution-free convolution model. We implement a variation of the distribution-free background correction approach in (10), adapted to use control bead types from the Illumina platform. Let
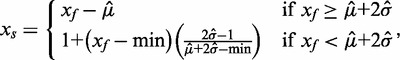 |
where  is the mean of the control bead types,
  is
is  times the sample standard deviation of the intensities smaller than
  , a robust measure of standard deviation for the skewed noise distribution and min is the minimum intensity
  . For small
  , the correction is a linear interpolation with slope defined by the minimum intensity value, and the background mean and robust estimate of standard deviation. For large
  , the correction is background subtraction. We evaluate this method using two different populations of control probes: (a) negative control probes (‘dfcm’ = distribution-free convolution model) and (b) ‘out-of-band’ Infinium I probes (‘doob’ = distribution-free using out-of-band probes).
The convolution models above are compared with the two background subtraction methods currently available for this platform. The first is the method documented in the most recent release of Illumina’s GenomeStudio software (ver2011.1), subtracting the fifth percentile of the negative control probe intensities on the array. The second is the method implemented by the ‘lumi’ package in Bioconductor version 2.10, subtracting the mode of the lower half of the distribution of methylated probe intensities. For both of these approaches, the maximum of the background-subtracted value and one is returned.
All methods (see Table 1 for a summary) used an offset of 15, which was selected based on earlier results for gene expression arrays (11), and evaluation of the probe-specific variance for Beta values from technical replicates. Also, for all HM450 data, we apply an additional global dye-bias equalization step to control for the different average intensities in the red and green channels. This procedure scales the background-corrected intensities, dividing by the average intensity of the positive control probes in the same channel, red or green, and multiplying by the average intensity of all positive controls in a reference array. The reference array is selected as the one with the smallest difference in average red and average green positive control intensity. This is similar to the approach implemented in GenomeStudio (ver2011.1), but can select a different array as the reference.
DNA methylation summary measures
We evaluate the effects of different background-correction methods on the bias and variance of DNA methylation estimates. The background-corrected and dye-bias equalized values xs are separated into the intensity estimates, ms and us, for the methylated and unmethylated cytosines, respectively, and two summaries of DNA methylation are evaluated: (i) Beta value = ms/(ms + us), a value between 0 and 1, and (ii) M-value = log2(ms/us), the logit transformed Beta value (=log2(Beta/(1−Beta)) with unrestricted boundaries (12).
Illumina HumanMethylation data sets
Four data sets were used to compare the benefits of differing background-correction methods for DNA methylation arrays. We used technical replicates to evaluate array-to-array variation for each probe, and calibrated mixture samples to evaluate bias and root mean squared error in estimating absolute percent DNA methylation, or the corresponding M-value. Finally, we evaluated the methods using two real data sets that contain replicate sample measurements. The real data studies allow us to evaluate the technical variation for large numbers of independent samples for two different cell types.
Technical replicates
Six technical replicates (1 µg genomic DNA each, extracted from commercially available pooled human male peripheral blood lymphocytes, or PBLs) were assayed as part of a larger experiment (13). Each 96-well plate of the study included the random placement of one technical replicate of the control PBL. Bisulfite conversion and whole genome amplification of the extracted DNA were performed by plate as described by Sandoval et al. (2); and samples were run on HM450 arrays.
Calibrated mixture samples
Four proportions of M.SssI-treated sperm DNA (10, 35, 60, 85%) were prepared by titrating equal concentrations of treated and mock-treated sperm DNA to achieve near uniformity of DNA concentration at the desired proportions. One microgram of DNA from each of the four mixture proportions was then randomly arranged on each of four 96-well plates and analysed on the HM450 arrays, as part of the same study as the technical replicates described above. As the M.SssI enzyme fully methylates DNA, the expected DNA methylation proportion at normally unmethylated loci should equal the fraction of M.SssI-treated sperm in the mixture (0.10, 0.35, 0.60 and 0.85). Histograms of percent DNA methylation for the 10 and 35% mixture samples showed clear bimodal distributions (plots not shown), allowing us to distinguish normally unmethylated loci from a subset of ‘constitutively methylated loci’, loci that would not reflect the proportion of M.SssI-treated DNA in the mixture. From these bimodal distributions, we selected 0.65 as a cut-off. Probes yielding a median beta value >0.65 in the 10% M.SssI sample are omitted from all mixture samples as constitutively methylated.
Acute myeloid leukaemia patient samples
As part of The Cancer Genome Atlas (TCGA) project, 1 µg of DNA from each of 192 acute myeloid leukaemia (AML) patient samples was assayed on the Illumina Infinium HM27 platform. To interrogate a greater variety of sites, DNA from the same patient samples was again assayed on the Illumina Infinium HM450 platform. A total of 25 978 (94%) of the target sequences on the HM27 array are retained on the HM450 array. As AML is a notoriously diverse disease with significant epigenetic heterogeneity (14), the data allowed us to compare the ability of the various background-correction methods to minimize differences between platforms, without diminishing biological differences between patients. A one-way ANOVA was conducted to partition variance between subjects from variance between each subject’s two data sets (one HumanMethylation27, one HumanMethylation450) and identify methods to best improve the sensitivity of the Infinium platform for measuring biologic (between-subject) variation. The precision of the different background-correction methods was assessed by a comparison of the distribution of ANOVA F-statistics. Since we know SNPs at the CpG site can induce a DNA methylation signal across samples (15), we excluded probes with SNPs overlapping a CpG site (n = 2238, dbSNP build 135). All 384 samples for the AML patients are available as part of TCGA.
HapMap sample data
Jordana Bell and colleagues kindly provided 160 samples of raw .IDAT files of HM27 data for 77 HapMap lymphoblastoid cell lines (16), processed at the University of California, Los Angeles. Seventy-two samples were run in duplicate, four in triplicate, and one in quadruplicate. We processed these data with the methods presented above and performed a one-way analysis of variance to compare the sensitivity of the different approaches on an independent data set. Again, probes with SNPs occurring at the CpG site were omitted. The .IDAT files are now available from the Gene Expression Omnibus as GSE26133.
RESULTS
Distribution of non-specific fluorescence
Figure 1 shows the distribution of intensities for both the negative control probes and the Infinium I probes in the colour channel opposite their designed extension base (‘oob’) for four PBL replicates, two on the HM27 array (left-hand side) and two on the HM450 array (right-hand side). The two samples on each platform are selected to show the variation in background intensity that can arise between replicates of the exact same sample. Note that the number of Infinium I probes that provide information on out-of-band intensities is orders of magnitude larger than the number of control probes. This motivates our use of the opposite-channel fluorescence, rather than negative control probes, for correcting background effects. The mean of the background tends to be equally well captured by either probe population, but variances from two distributions are considerably different, and therefore warrant individual consideration. The Gamma model for non-specific fluorescence directly accommodates the skew in distributions of ‘oob’ probes, while the nonparametric ‘doob’ procedure makes no distributional assumptions at all.
Figure 1.

Distribution of negative control and out-of-band fluorescent probes for two PBL replicate samples on the HM27 and HM450 arrays.
Low-level signal processing
The substantial technical variation in raw signals from Illumina Infinium HumanMethylation450 microarrays, and the improvement yielded by low-level processing, is shown in Figure 2. For six replicate samples of PBLs, densities of the methylated allele intensities, unmethylated allele intensities and Beta values are shown (top row to bottom row), before and after processing (left and right columns, respectively). Processing included both ‘noob’ background correction (Normal-exponential convolution using out-of-band probes) and dye-bias equalization. A contributing factor to the differences between profiles reflects the differences in background distribution between identical samples run on different plates. Background fluorescence has the effect of shrinking the dynamic range of Beta values, and dye bias variations skew the values of Infinium II probes differentially across samples. By correcting for both, we spread the peaks closer to the extremes of the distribution. The median pairwise Spearman correlation between Beta (or M-) values of uncorrected replicates was 0.9798; for the corrected replicates, the median correlation was 0.9897.
Figure 2.

Density plots for six PBL replicate samples on the HM450 arrays before and after processing (left and right columns, respectively) (P = 482 421 targeted CpGs). Processed data were corrected by the Normal exponential convolution using out-of-band Infinium I probes (noob) and dye-bias equalization. Row 1: Methylated allele intensities; row 2: Unmethylated allele intensities; row 3: Beta values.
The parametric convolution models estimate the signal intensity distribution from the pool of background-subtracted methylated and unmethylated allele intensities (by colour channel). For the PBL sample intensities shown in Figure 2, the shape parameter for a Gamma distribution, which is equal to one under the exponential model, is estimated to be less than one under the Gamma convolution. This reflects a signal distribution that is even more highly skewed, and with greater variance, than the exponential distribution assumed under a Normal exponential convolution. A quantile–quantile plot shows the observed and estimated distributions for the foreground and background intensities from a randomly selected PBL sample, analysed using a Normal-exponential, or Gamma-gamma model (see Supplementary Figure S1). The estimates from the Gamma convolution show a better fit to the observed intensities than the estimates from the Normal-exponential for the middle 95% of the distribution. A better fit of background intensity is also seen by modelling a Gamma distribution compared with a Normal.
Probe-wise variance in replicate samples
Figure 3 shows the probe-wise standard deviation of the Beta values, and M-values, for the different background-correction methods. We find that methods using only negative control probes to measure background can have the undesirable property of increasing the probe-wise standard deviation for the technical replicate PBL samples on the M-value scale. The median variance is minimized by the newer convolution methods using the out-of-band intensities to estimate background, with ‘goob’ showing the clear advantage on the Beta-value scale, while the ‘noob’ procedure performs best on the M-value scale. Linear modelling of the probe-level variation as a function of the number of overlaid CpG sites per probe revealed statistically significant (P < 2.2 × 10⁻¹⁶) decreases in probe-level variation with each additional overlaid CpG locus; this relationship was present in both Infinium I and Infinium II probe designs, albeit with larger magnitude in the former.
Figure 3.

Boxplot of the probe-specific standard deviation of (a) Beta values and (b) M-values by background-correction method: none (raw), background subtraction using negative control probes (q5), background subtraction using methylated allele intensities (lumi), Normal exponential convolution using negative control probes (normexp), distribution-free convolution using negative control probes (dfcm), distribution-free convolution using out-of-band Infinium I probes (doob), Normal exponential convolution using out-of-band Infinium I probes (noob), Gamma convolution using out-of-band Infinium I probes (goob) (n = 6 PBL replicates on HM450, P = 482 421 targeted CpGs). Dye-bias equalization is also applied for all background-corrected data.
Bias, variance and RMSE as measured from mixture samples
We next quantified the probe-level bias and variance trade offs presented by the various background-correction methods using a panel of samples with titrated mixtures of DNA methylation. Specifically, we computed the bias as the difference between each sample’s Beta values and its titrated concentration of M.SssI-treated DNA, or its M-values and the logit-transformed concentrations. We find that the bias shows a strong dependency on the concentration of M.SssI-DNA, with more pronounced differences towards the extremes of 10% (mostly unmethylated) and 85% (mostly methylated) (Figure 4 and Supplementary Figure S2). For these concentrations, the bias is most reduced using the convolution models. We evaluated the probe-level variation in measurements using the sample standard deviation, whereupon a strong improvement was observed for all background-correction methods in the more numerous Infinium II probes, but Infinium I probes showed slight to moderate increases in probe-level variation (Figure 5 and Supplementary Figure S3). In evaluating the raw data, the Infinium II probes showed greater variability than Infinium I probes, but after background correction, this was no longer the case. In fact, for mixtures of 10–60%, the variability of the DNA methylation measures for Infinium II probes was lower than the variability for the Infinium I probes.
Figure 4.

Boxplot of probe-specific bias in M-values by background-correction method: none (raw), background subtraction using negative control probes (q5), Normal exponential convolution using negative control probes (normexp), distribution-free convolution using negative control probes (dfcm), distribution-free convolution using out-of-band Infinium I probes (doob), Normal exponential convolution using out-of-band Infinium I probes (noob), Gamma convolution using out-of-band Infinium I probes (goob) [n = 4 replicates each of four mixtures samples, P = 255 594 CpG targets, filtering out features methylated in the 10% M.SssI-treated fraction (average beta > 0.65)]. Dye-bias equalization is also applied for all background-corrected data, and probes are stratified by Infinium I and II design.
Figure 5.

Boxplot of probe-specific standard deviation in M-values by background correction method: none (raw), background subtraction using negative control probes (q5), Normal exponential convolution using negative control probes (normexp), distribution-free convolution using negative control probes (dfcm), distribution-free convolution using out-of-band Infinium I probes (doob), Normal exponential convolution using out-of-band Infinium I probes (noob), Gamma convolution using out-of-band Infinium I probes (goob) [n = 4 replicates each of four mixtures samples, P = 255 594 CpG targets, filtering out features methylated in the 10% M.SssI-treated fraction (average beta > 0.65)]. Dye-bias equalization is also applied for all background-corrected data, and probes are stratified by Infinium I and II design.
We also tabulated the root mean squared error (RMSE), a function of both variance and bias, across the different mixing fractions. Near the extremes (where most measurements in biological samples are expected to fall), we find that the model-based convolutions using out-of-band probes, ‘noob’ and ‘goob’, generally perform best (Figure 6 and Supplementary Figure S4). We note, however, a slight increase in RMSE after background correction for probes with 35 or 60% DNA methylation, with ‘noob’ representing the smaller increase in RMSE between ‘noob’ and ‘goob’. Thus, the models suffer mildly for probes that do not have one of their two alleles (M or U) near background. We omitted from these comparisons the method used by the lumi package, as it relies on the assumption that a large number of probes on the array are unmethylated, which is violated for these samples containing M.SssI-treated DNA.
Figure 6.

Boxplot of probe-specific root mean squared error (RMSE) of M-values by background-correction method: none (raw), background subtraction using negative control probes (q5), Normal exponential convolution using negative control probes (normexp), distribution-free convolution using negative control probes (dfcm), distribution-free convolution using out-of-band Infinium I probes (doob), Normal exponential convolution using out-of-band Infinium I probes (noob), Gamma convolution using out-of-band Infinium I probes (goob) [n = 4 replicates each of four mixtures samples, P = 255 594 CpG targets, filtering out features methylated in the 10% M.SssI-treated fraction (average beta > 0.65)]. Dye-bias equalization is also applied for all background-corrected data, and probes are stratified by Infinium I and II design.
Performance in replicated HapMap and TCGA samples
In the HapMap cell line replicates (all Infinium I probes on HM27 BeadArrays), all background-correction methods appear to improve the ability of the platform to detect biological differences, as judged by the distribution of F statistics (Figure 7a). This illustrates that, regardless of the specific method used, the differences between cell lines are more prominent after processing, relative to the differences within replicates of the same cell line. A comparison of within-subject and between-subject standard deviations shows ‘goob’ as the method that reduces the within-subject variation the most (Supplementary Figure S5). The tendency of lumi’s mode subtraction scheme to increase within-cell-line variance relative to the raw data is of concern.
Figure 7.

(a) Boxplot of probe-specific ANOVA F-statistic of M-values for 160 HM27 arrays of 77 HapMap samples (72 duplicates, 4 triplicates and 1 quadruplicate) by background-correction method: none (raw), background subtraction using negative control probes (q5), background subtraction using methylated allele intensities (lumi), Normal exponential convolution using negative control probes (normexp), distribution-free convolution using out-of-band Infinium I probes (doob), Normal exponential convolution using out-of-band Infinium I probes (noob), Gamma convolution using out-of-band Infinium I probes (goob). (P = 25 913 CpG targets, filtering out features with SNPs at targeted CpGs). (b) Boxplot of probe-specific ANOVA F-statistic of M-values for 192 acute myeloid leukaemia samples from the Cancer Genome Atlas project, run on both HM27 and HM450 arrays, arranged by background-correction method (left to right): none (raw), q5, lumi, normexp, doob, noob, goob. See part (a) for full name of method. (P = 23 740 features overlapping both platforms, SNPs omitted). There are 2243 (9%) features using chemistry I on both platforms, and there are 21 497 (91%) features using chemistry I on HM27 and chemistry 2 on HM450, among those probes shared between the two platforms.
In the AML replicate comparison (Figure 7b), only the out-of-band convolution-based methods avoid decreasing sensitivity in the distribution of the F-statistics, with only ‘noob’ providing a significant improvement in a cross-platform comparison. When comparing across platforms, 21 497 (91%) of the 23 740 targeted sequences appearing on both platforms are measured using the differently designed Infinium II probes on the HM450 platform. As the Infinium II probes have additional dye bias correction that does not affect Infinium I probes, we stratify the comparison of within- and between-subject variation by the design of the targeted sequence on the HM450 array. We observe that the out-of-band convolution methods decrease overall and within-subject variance in probes not switching chemistry between platforms (Infinium I probes) (Supplementary Figure S6). Among the probes that do switch chemistry, ‘noob’ shows greater between-subject variability than the unprocessed data, and shows the least variance inflation of the background-correction methods compared. The combination of these two events likely explains the increased ability of the assay to detect biological differences as compared with the raw data or other methods under study.
DISCUSSION
We present three novel deconvolution methods for correcting background fluorescence on Illumina Infinium DNA methylation arrays, all of which benefit from using the large number of out-of-band intensities provided by the platform’s design. The out-of-band intensities of the Infinium I probe pairs provide an extremely large feature set for measuring the additive noise component. The distribution of the non-specific fluorescence of these features is markedly non-Gaussian in many samples; thus, we implement a flexible Gamma convolution model as a competitor to the well-regarded Normal-exponential convolution. Both the Normal exponential and Gamma exponential convolution models are special cases. We also evaluated a distribution-free convolution model, in part to assess the importance of model fit as a component of performance. Our results indicate that deconvolution methods operating on out-of-band probes, as a group, outperformed subtractive methods and methods using the designed negative controls on the array. In addition, the model-based deconvolution methods appeared to perform better than the distribution-free approach. However, no one single model emerged as the uniformly best performing method across all comparisons.
Background correction has the greatest impact on signals that are near background, or correspondingly, DNA methylation proportions near 0 and 1. Indeed, the mixture samples showed that the greatest reduction in bias and RMSE from low-level processing appeared at the extremes of the Beta distribution, in mixtures of 10 and 85% M.SssI-treated DNA, especially for Infinium II probes (which also benefitted from dye-bias equalization). The Gamma convolution showed the greatest reduction in RMSE for Beta values for these samples, with the Normal exponential a close second. At the same time, the 35 and 60% mixture samples, corresponding to probes for which both the methylated and unmethylated intensities are above background, showed a slight inflation of variance from low-level processing. For these mixtures, the Normal exponential convolution showed less variance inflation than the Gamma convolution.
The observation that some probes benefit from processing whereas others suffer inflated variance suggests that the distribution of the DNA methylation in our samples may impact the relative overall performance of different processing methods. This might explain the superior performance of the Gamma convolution for the HapMap lymphoblastoid cell lines that were processed on the HM27 arrays, with a preponderance of probes in promoter CpG islands measuring low levels of DNA methylation. For the TCGA AML replicate comparisons, the results differed. As the AML samples come from subjects harbouring significant subclonal populations (17), and the disease is associated with profound genome-wide changes to DNA methylation (18), we hypothesize that the observed shifts away from the extremes and towards intermediate levels of DNA methylation reduced the impact of background correction. Stark differences between the AML patients are recovered regardless of the processing method used.
Our background correction and dye-bias equalization processing of the data tends to increase the dynamic range of the Beta values, most notably for Infinium II probes. This resembles the empirical spreading of the Infinium II probe distribution proposed by Dedeurwaerder et al. (19), though the spreading of peaks occurs in our method as a natural consequence of background correction, and affects both Infinium I and II designed probes. Further stratification and incorporation of probe sequence characteristics, both those of the out-of-band Infinium I controls and those of the analytic probes of either design, may yield greater improvement.
The distribution of the tens of thousands of Infinium I self-controls for measuring background largely matches the designed negative controls, but provides many times the sample size for estimating distributional parameters. Additionally, the probe sequences for the paired probes are available, allowing a number of sequence-based refinements that are not possible with the negative control probes because their sequences are not made available. The presence of these probes, and their large number and known sequence properties, may be of use in supervised normalization procedures, in addition to the uses we demonstrate in unsupervised processing.
Although supervised and unsupervised methods for normalization are of great interest for these arrays, we performed only the amount of processing necessary to make the two platforms (HM27 and HM450) comparable for the AML replicates. Better dye-bias correction and within-array normalization methods are of interest, but they are beyond the scope of this report. However, we did evaluate our noob and dye-bias equalization procedure in the presence of SWAN (20), a new software package that performs subset quantile normalization, and found that our method always improved the median pairwise Spearman correlation for all mixture samples and the PBL replicates. This leads us to believe that our methods will stand up to downstream processing. Another consideration for method improvement is the optimal offset value. For all signals, we used an offset of 15, the offset reported by Shi and colleagues (11) for gene expression data in their investigation of bias and sensitivity. However, as the addition of an offset affects Beta values and M-values differently, it could be that different values are preferred depending on the choice of scale. This remains to be explored.
In summary, we find that the use of out-of-band intensities for estimating the parameters of a convolution model for background correction on Illumina Infinium methylation microarrays outperform subtractive approaches for background correction. However, as the correction appeared to slightly increase variance of probes with Beta values in the interior (35 and 60% mixture samples), refinements are likely to see further improvements. Thus, the overall improvement of the method over competing approaches is primarily due to the distribution of beta values in experimental samples, falling primarily at the extremes of the scale. Data processing using the Normal exponential model is fast and computationally efficient; the Gamma convolution, in its present implementation (‘goob’), requires ∼10–15 min per HM450 sample on a 2Ghz Intel processor. Future work will investigate stratified and allele-specific designs, and normalization approaches leveraging the large population of out-of-band intensities.
SUPPLEMENTARY DATA
Supplementary Data are available at NAR Online: Supplementary Figures 1–6.
FUNDING
Norris Foundation; National Institutes of Health (NIH) [R01 CA097346 to K.S., U24 CA143882 to P.W.L. and P30 ES07048]. Funding for open access charge: NIH [R01 CA097346].
Conflict of interest statement. The content is solely the responsibility of the authors and does not necessarily represent the official views of the National Cancer Institute or the National Institutes of Health.
Supplementary Material
ACKNOWLEDGEMENTS
The authors would like to thank the investigators from ABRIDGE (Raby et al. 2011) and Dr Carrie Breton, for the use of the mixture samples, the investigators from Bell et al. (2011) for the use of the HapMap cell line data, TCGA for the use of the acute myeloid leukaemia data, with particular thanks to Dr Timothy Ley and Dr Richard Wilson at Washington University in St. Louis who provided the samples from their Genomics of AML Program Project Grant (P01 CA101937, PI: Ley). We also thank the USC High Performance Computing Center for data storage and computational resources.
REFERENCES
- 1.Bird A. DNA methylation patterns and epigenetic memory. Genes Dev. 2002;16:6–21. doi: 10.1101/gad.947102. [DOI] [PubMed] [Google Scholar]
- 2.Sandoval J, Heyn HA, Moran S, Serra-Musach J, Pujana MA, Bibikova M, Esteller M. Validation of a DNA methylation microarray for 450,000 CpG sites in the human genome. Epigenetics. 2011;6:692–702. doi: 10.4161/epi.6.6.16196. [DOI] [PubMed] [Google Scholar]
- 3.Siegmund KD. Statistical approaches for the analysis of DNA methylation microarray data. Hum. Genet. 2011;129:585–595. doi: 10.1007/s00439-011-0993-x. [DOI] [PMC free article] [PubMed] [Google Scholar]
- 4.Xie Y, Wang X, Story M. Statistical methods of background correction for Illumina BeadArray data. Bioinformatics. 2009;25:751–757. doi: 10.1093/bioinformatics/btp040. [DOI] [PMC free article] [PubMed] [Google Scholar]
- 5.Verdugo RA, Deschepper CF, Muñoz G, Pomp D, Churchill GA. Importance of randomization in microarray experimental designs with Illumina platforms. Nucleic Acids Res. 2009;37:5610–5618. doi: 10.1093/nar/gkp573. [DOI] [PMC free article] [PubMed] [Google Scholar]
- 6.Teschendorff AE, Menon U, Gentry-Maharaj A, Ramus SJ, Gayther SA, Apostolidou S, Jones A, Lechner M, Beck S, Jacobs IJ, et al. An epigenetic signature in peripheral blood predicts active ovarian cancer. PLoS One. 2009;4 doi: 10.1371/journal.pone.0008274. e8274. [DOI] [PMC free article] [PubMed] [Google Scholar]
- 7.Ritchie ME, Silver J, Oshlack A, Holmes M, Diyagama D, Holloway A, Smyth GK. A comparison of background correction methods for two-colour microarrays. Bioinformatics. 2007;23:2700–2707. doi: 10.1093/bioinformatics/btm412. [DOI] [PubMed] [Google Scholar]
- 8.Chen M, Xie Y, Story M. An exponential-gamma convolution model for background correction of Illumina BeadArray data. Commun. Stat. Theory Methods. 2011;40:3055–3069. doi: 10.1080/03610921003797753. [DOI] [PMC free article] [PubMed] [Google Scholar]
- 9.Ritchie ME, Carvalho BS, Hetrick KN, Tavare S, Irizarry RA. R/bioconductor software for Illumina's Infinium whole-genome genotyping BeadChips. Bioinformatics. 2009;25:2621–2623. doi: 10.1093/bioinformatics/btp470. [DOI] [PMC free article] [PubMed] [Google Scholar]
- 10.Chen Z, McGee M, Liu Q, Kong M, Deng Y, Scheuermann RH. A distribution-free convolution model for background correction of oligonucleotide microarray data. BMC Genomics. 2009;10(Suppl.1):S19. doi: 10.1186/1471-2164-10-S1-S19. [DOI] [PMC free article] [PubMed] [Google Scholar]
- 11.Shi W, Oshlack A, Smyth GK. Optimizing the noise versus bias trade-off for Illumina whole genome expression BeadChips. Nucleic Acids Res. 2010;38 doi: 10.1093/nar/gkq871. e204. [DOI] [PMC free article] [PubMed] [Google Scholar]
- 12.Du P, Zhang X, Huang CC, Jafari N, Kibbe WA, Hou L, Lin SM. Comparison of beta-value and m-value methods for quantifying methylation levels by microarray analysis. BMC Bioinformatics. 2010;11:587. doi: 10.1186/1471-2105-11-587. [DOI] [PMC free article] [PubMed] [Google Scholar]
- 13.Raby B, Barnes K, Beaty TH, Bosco A, Carey VJ, Castro M, Cheadle C, Gilliland FD, Islam KS, Salam MT, et al. Asthma bridge: the asthma biorepository for integrative genomic exploration. Am. J. Respir. Crit. Care Med. 2011;183 A6189. [Google Scholar]
- 14.Figueroa ME, Lugthart S, Li Y, Erpelinck-Verschueren C, Deng X, Christos PJ, Schifano E, Booth J, van Putten W, Skrabanek L, et al. DNA methylation signatures identify biologically distinct subtypes in acute myeloid leukemia. Cancer Cell. 2010;17:13–27. doi: 10.1016/j.ccr.2009.11.020. [DOI] [PMC free article] [PubMed] [Google Scholar]
- 15.Byun H-M, Siegmund KD, Pan F, Weisenberger DJ, Kanel G, Laird PW, Yang AS. Epigenetic profiling of somatic tissues from human autopsy specimens identifies tissue- and individual-specific DNA methylation patterns. Hum. Mol. Genet. 2009;18:4808–4817. doi: 10.1093/hmg/ddp445. [DOI] [PMC free article] [PubMed] [Google Scholar]
- 16.Bell JT, Pai AA, Pickrell JK, Gaffney DJ, Pique-Regi R, Degner JF, Gilad Y, Pritchard JK. DNA methylation patterns associate with genetic and gene expression variation in HapMap cell lines. Genome Biol. 2011;12:R10. doi: 10.1186/gb-2011-12-1-r10. [DOI] [PMC free article] [PubMed] [Google Scholar]
- 17.Ding L, Ley TJ, Larson DE, Miller CA, Koboldt DC, Welch JS, Ritchey JK, Young MA, Lamprecht T, McLellan MD, et al. Clonal evolution in relapsed acute myeloid leukaemia revealed by whole-genome sequencing. Nature. 2012;481:506–510. doi: 10.1038/nature10738. [DOI] [PMC free article] [PubMed] [Google Scholar]
- 18.Akalin A, Garrett-Bakelman FE, Kormaksson M, Busuttil J, Zhang L, Khrebtukova I, Milne TA, Huang Y, Biswas D, Hess JL, et al. Base-pair resolution DNA methylation sequencing reveals profoundly divergent epigenetic landscapes in acute myeloid leukemia. PLoS Genet. 2012;8 doi: 10.1371/journal.pgen.1002781. e1002781. [DOI] [PMC free article] [PubMed] [Google Scholar]
- 19.Dedeurwaerder S, Defrance M, Calonne E, Denis H, Sotiriou C, Fuks F. Evaluation of the Infinium methylation 450K technology. Epigenomics. 2011;3:771–784. doi: 10.2217/epi.11.105. [DOI] [PubMed] [Google Scholar]
- 20.Maksimovic J, Gordon L, Oshlack A. SWAN: subset-quantile within array normalization for Illumina Infinium HumanMethylation450 BeadChips. Genome Biol. 2012;13:R44. doi: 10.1186/gb-2012-13-6-r44. [DOI] [PMC free article] [PubMed] [Google Scholar]
Associated Data
This section collects any data citations, data availability statements, or supplementary materials included in this article.