Abstract
Recent advances in high-throughput sequencing technologies have enabled a comprehensive dissection of the cancer genome clarifying a large number of somatic mutations in a wide variety of cancer types. A number of methods have been proposed for mutation calling based on a large amount of sequencing data, which is accomplished in most cases by statistically evaluating the difference in the observed allele frequencies of possible single nucleotide variants between tumours and paired normal samples. However, an accurate detection of mutations remains a challenge under low sequencing depths or tumour contents. To overcome this problem, we propose a novel method, Empirical Bayesian mutation Calling (https://github.com/friend1ws/EBCall), for detecting somatic mutations. Unlike previous methods, the proposed method discriminates somatic mutations from sequencing errors based on an empirical Bayesian framework, where the model parameters are estimated using sequencing data from multiple non-paired normal samples. Using 13 whole-exome sequencing data with 87.5–206.3 mean sequencing depths, we demonstrate that our method not only outperforms several existing methods in the calling of mutations with moderate allele frequencies but also enables accurate calling of mutations with low allele frequencies (≤10%) harboured within a minor tumour subpopulation, thus allowing for the deciphering of fine substructures within a tumour specimen.
INTRODUCTION
Cancer is caused by genetic alterations in which acquired or somatic gene mutations, together with germline factors, play definitive roles in cancer development. As such, comprehensive knowledge regarding somatic mutations in the cancer genome is indispensable for the ultimate understanding of cancer pathogenesis. In this regard, the recent advances in massively parallel sequencing technologies have provided an unprecedented opportunity to decipher a full registry of somatic events in the cancer genome at a single nucleotide resolution (1). However, accurate detection of somatic mutations from high-throughput sequencing data may not always be a straightforward task because ambiguities in short read alignment and sequencing errors are inevitably introduced during sample preparation and signal processing, making it difficult to discriminate true somatic mutations from sequencing errors, especially for those mutations with low sequencing depths or allele frequencies. The detection of low allele frequency mutations is not only required for specimens with low tumour contents but is also important for capturing minor tumour subclones to understand the heterogeneity of cancer (2–5) and the underlying causes of tumour recurrence and therapeutic resistance.
For calling somatic mutations, each candidate has to be discriminated from germline variants and artifacts appearing from sequencing errors. Although germline variants can be effectively detected by relying on the base calls in paired normal samples, the elimination of sequencing errors may be a more complex task because of uncertain allele frequencies and tumour contents. Most existing approaches have adopted variants whose allele frequencies in tumour samples are significantly higher than those in normal samples, excluding variants whose allele frequencies are high enough to indicate that they are putative germline variants. Sequencing errors can be eliminated to some extent by testing the differences in allele frequencies, as they are expected to occur with equal probability between tumour and normal samples. To measure the significance of the difference in allele frequencies, SomaticSniper (6) and jointSNVmix (7) estimate the Bayesian posterior probability that tumour and normal samples have different genotypes, whereas our previous approach (8) and VarScan 2 (9) both rely on the P-values from Fisher’s exact test.
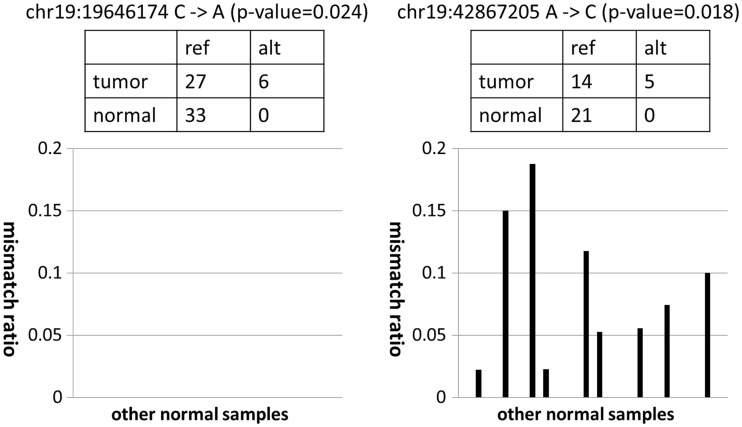
Although a direct comparison between tumour and normal samples has achieved a measure of success, a more efficient approach to discriminate between sequencing errors and genuine somatic mutations is possible when prior information on sequencing errors is given. In fact, the susceptibility to sequencing errors in each genomic position is not uniform, but there are many common sequencing error-prone sites across different experiments, as shown by several previous studies (10–12) as well as our current study. This implies that, by inferring the susceptibility to sequencing errors at each genomic site, we can achieve greater sensitivity in the detection of somatic mutations at sites with no sequencing errors while efficiently filtering false positives at sequencing error-prone sites (Figure 1).
Figure 1.
Examples of mismatch ratios of other normal samples for mutation candidates with moderate P-values. In both cases, although the mismatch ratios of the target tumour sample were relatively high, the numbers of corresponding supporting variant reads were small. For the candidate on the left, the frequencies of non-reference alleles for other normal samples were consistently zero. Therefore, this supports the prediction that the observed variant reads in the target tumour sample came from a true somatic mutation and not from sequencing errors. On the other hand, for the candidate on the right, we often observed high frequencies of non-reference alleles for several different normal samples. Therefore, the observed variant reads in the target tumour sample likely came from sequencing errors, and it was just by chance that there was no variant read in the target normal sample.
In this article, we propose a novel statistical approach for the detection of somatic mutations, which explicitly takes into account prior information of sequencing errors. By introducing a Bayesian statistical model, we propose a framework for empirically estimating the distribution of sequencing errors by using a set of non-paired normal samples. Using this approach, we can directly evaluate the discrepancy between the observed allele frequencies and the expected scope of sequencing errors. The proposed approach, which we call Empirical Bayesian mutation Calling (EBCall), is superior to several existing methods in calling somatic mutations with moderate allele frequencies. In addition, we demonstrate that EBCall can effectively detect a series of somatic mutations that have allele frequencies of <10% with a high degree of accuracy, thereby identifying subclonal structures of cancer cells that cannot otherwise be found.
MATERIALS AND METHODS
Patient samples and sequencing procedures
After receiving informed consent, paired tumour-normal samples were obtained from 20 patients with clear cell renal cell carcinoma (ccRCC) by sampling their specimens during surgical operations. Of the samples obtained, 13 paired tumour-normal samples were used for a performance evaluation of the mutation detection, and all 20 of the normal samples were used for estimating the sequencing errors as non-paired normal reference samples. In addition, to compare the choice of normal reference samples, 20 normal samples collected from patients with paediatric acute myeloid leukemia (ped-AML) were also used; the informed consent for these sample collections were obtained from the patients’ parents. This study was approved by the ethics committees of the University of Tokyo and Gunma Children’s Medical Center.
Genomic DNA and total RNA were extracted from the samples using QIAamp DNA Investigator kit (Qiagen) and the RNAeasy Total RNA kit (Qiagen) with DNase treatment, respectively, according to the manufacturers’ protocols. For whole-exome sequencing, SureSelect-enriched exon fragments were subjected to sequencing using HiSeq 2000, as previously described (8). The ccRCC samples were sequenced from October 2011 to February 2012, whereas the ped-AML samples were sequenced from April 2012 to June 2012. For 10 ccRCC samples, whole-genome sequencing and RNA sequencing were performed using HiSeq 2000, according to standard protocols recommended by Illumina. The mean sequencing depth for each sample was 65.9–223.0 (Supplementary Table S1 and S2).
Outline of the mutation calling method
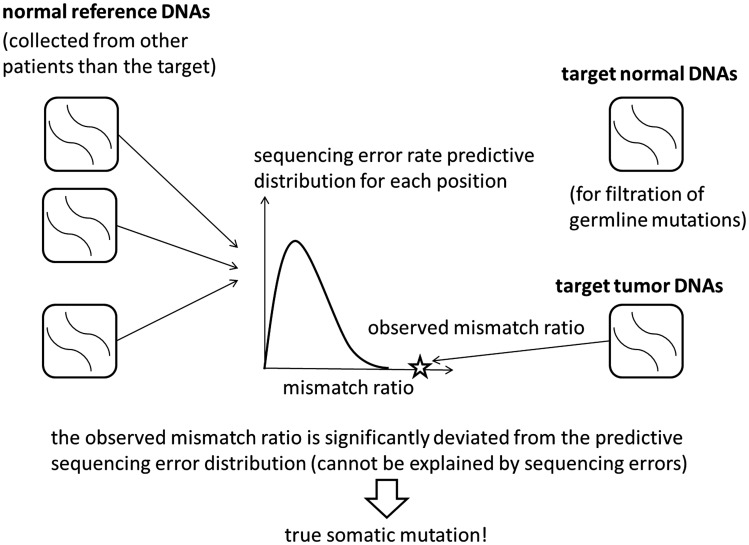
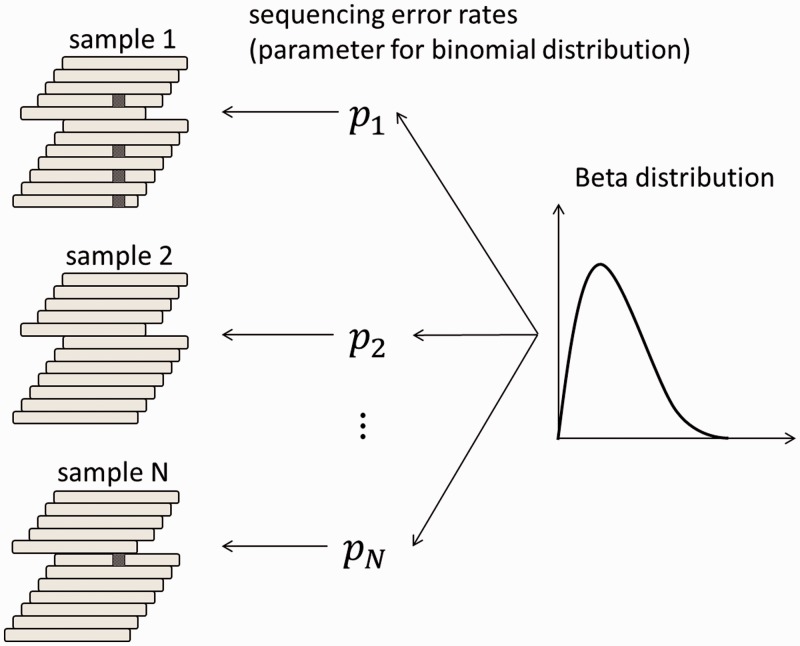
The outline of EBCall is shown in Figure 2. The key concept in EBCall is that sequencing data of multiple non-paired normal samples are used to estimate possible sequencing errors at each genomic site. For this purpose, we modelled the sequencing errors that follow a Beta-binomial distribution, the parameters of which were estimated using the sequencing data from multiple non-paired normal samples (Figure 3). The allele frequencies of the observed variants in the tumour DNA were then compared with the inferred sequencing error distribution at the corresponding genomic positions to exclude sequencing errors. Germline Single Nucleotide Polymorphism (SNPs) were eliminated using sequencing data from the paired normal DNA.
Figure 2.
An illustrative description of the proposed method. For each genomic site, the distribution of sequencing errors is estimated using non-paired normal samples from patients other than the target. The mismatch ratio of the target tumour sample is then compared with the distribution. If the mismatch ratio deviates significantly from the distribution, the corresponding variant is then extracted as a somatic mutation candidate. The target normal sample is used for filtering germline mutations.
Figure 3.
A Beta-binomial sequencing error model. First, the error rate for each sample is generated from the Beta distribution. The number of short reads with sequencing errors is then generated according to the binomial distribution using the parameters of the above error rate for each sample. The parameters of the Beta distribution, which determine the shape of the distribution, are given for each possible variant.
Alignment of sequencing data
The sequencing reads were aligned to NCBI Human Reference Genome Build 37 using Burrows-Wheeler Aligner, version 0.5.8 (13) with the default parameter settings. Polymerase chain reaction (PCR) duplications were eliminated using Picard (http://picard.sourceforge.net/). Low-quality reads showing >5 mismatches with the reference genome or those whose mapping quality was <30 were excluded from further analysis as we did in (8).
For RNA sequencing data, a two-step alignment strategy adopted in Genomon-fusion (under submission) was used, in which all sequence reads were first aligned to the known transcript sequences (UCSC known genes) using bowtie (14), and the non-aligned reads were then aligned to the genome sequences using blat (15). For the whole-genome sequencing data, all reads were aligned using blat.
Definition of variables
Let Ω be an entire set of possible nucleotide variations consisting of combinations of genomic positions and types of nucleotide changes (e.g. chr1:5, C > A or chr20:10 000, A > AAG). Because sequencing errors are often biased to one strand (6,9,16), the number of total (d ) and variant reads (x) for a given variant, v ∈ Ω, were enumerated for each strand separately to distinguish between short reads aligned with the positive (xa,v,+, da,v,+) and negative (xa,v,–, da,v,–) strands, respectively, where a denotes the type of sample, which is either tumour (T), paired normal (N) or non-paired normal reference sample ( ).
).
Evaluation of sequencing errors using a Beta-binomial model
The number of sequencing errors at a given position in multiple samples is assumed to follow a binomial distribution characterized by a pre-determined parameter, P. Here, we take a Bayesian approach in which the sequencing error rate is a random variable following the Beta distribution, a conjugate prior distribution of the binomial distribution (Figure 3). We adopted a Bayesian approach for the following two reasons. First, although we have discussed that the proneness of sequencing errors is common across multiple experiments to some extent, subtle differences in various factors such as reagents and DNA status can influence the sequencing error rates. Hence, it is inappropriate to assume a homogeneous value for the sequencing error parameters for all experiments. Second, as biological experiments tend to generate a number of outliers, considerably robust inference should be performed. Bayesian modelling, which usually covers a broader range than simple exponential family distributions, serves this purpose.
Given an observed  , caused by a sequencing error, the numbers of variant reads, (
 , in both strands in a normal sample, Ri, are binomially distributed as
where the sequencing error rate ( follows a Beta distribution:
Under these assumptions, a predictive distribution of the number of variant reads, called a Beta-binomial distribution, can be described by the following formula:
 |
where  is the Gamma function. Each Beta distribution is regarded as a prior distribution, and its parameters, αν,± and βν,±, are estimated from the observed data of non-paired normal reference samples using a maximum likelihood method, in which the parameter space was restricted to
  to avoid over-fitting:
 |
EBCall pipeline
In EBCall pipeline, somatic mutations were detected using three major steps: the exclusion of less informative variants (step 1) and possible germline variants (step 2), and the sequencing of errors (step 3).
- To reduce the computational burden, only variants satisfying all the following conditions are tested in the following steps:
- The total numbers of reads at the relevant position in each strand should be >7 in both the tumour and paired reference:


- The mismatch ratio in the tumour sample should be >0.1:

- The variant should be supported by >3 reads:

- The following are excluded as putative germline polymorphisms/variants:
- Those with a mismatch ratio of >0.02 in the paired normal sample:

- Those for which the number of observed variant reads, xN,v, is within the 99% confidential interval of the expected read number, under the assumption of a binominal distribution of Bin(dN,v, 0.5) for dichotomous germline polymorphisms; and
- Those registered in either dbSNP131, the 1000 genomes project, or our internal SNP database.
- For each of the remaining variants, the cumulative probabilities for the observed
 and
and  under the null hypothesis, H0: the variant is from sequencing errors, are provided by
The combined P-value, P (v), corresponding to two independent strands, P+ (v) and P− (v), is obtained according to Fisher’s method:
where
 is a random variable distributed from the chi-square distribution with four degrees of freedom. H0 is then tested with a type I error, (=0.001 by default), for mutation calling. For base substitution mutations, we only used reads with a base quality of ≥15 at the corresponding positions for counting sequencing depths and variant reads. Each threshold value used above can be changed according to the purpose.
Evaluation of sequencing error susceptibility among multiple samples
To examine how many error-prone sites exist and how much they correlate among different experiments, we evaluated the sequencing error proneness by using normal samples of 20 ccRCC and 20 ped-AML patients. For an accurate evaluation of sequencing errors, we included only variants whose sequencing depths of positive and negative strands are >20 for all samples. Furthermore, we removed putative germline variants satisfying the following conditions at least for one sample:
Sequencing depths are >20;
The non-reference allele frequency is >0.2; and
At least one variant read is observed in both positive and negative strands.
Furthermore, for base substitutions, we only used reads with a base quality of ≥15 at the corresponding positions for counting sequencing depths and variant reads, as variants with low quality bases are often filtered in actual mutation callings.
Comparison with other mutation calling methods
We evaluated the performance of EBCall for calling somatic mutations with moderate allele frequencies (>0.1) through a comparison with other publically available methods, along with our own previous approach (designated as Genomon-Fisher) (8), which is obtained by replacing step 3 in EBCall with Fisher’s exact test for measuring the difference in the allele frequencies of the variants between the tumour and paired normal samples. The default setting was applied for running both Genomon-Fisher and VarScan. For SomaticSniper, the -q 30 -Q 15 option was used. In all cases, low-quality reads with >5 mismatches or a mapping quality of <30 were excluded in advance, as mentioned earlier in the text for EBCall. Furthermore, the same filtering procedures as the step 1 and 2 in EBCall were applied to all the method to equalize the conditions of sequencing depths and allele frequencies. For the comparison, somatic mutations were detected for whole-exome sequencing data from 10 clear cell carcinoma samples, for which a set of true positive mutations,  , was defined using whole genome/RNA sequencing data as follows:
 |
where NG and TG/TR denote whole genome/RNA sequencing data from normal and tumour samples, respectively. Herein, we did not count mutation candidates that do not satisfy  for either true or false positives, as they may be germline mutations. Mutations in non-coding regions excluding splice-sites were removed, where the gene annotations were performed using ANNOVAR (17). In addition, as SomaticSniper does not call InDels, we mainly concentrated substitutions for this comparison.
Validation of somatic mutations with low allele frequencies (<0.1)
We evaluated the performance of EBCall for calling somatic mutations with low allele frequencies (≤0.1) by changing the threshold value for the mismatch ratio in the tumour sample to  . For somatic mutations with low allele frequencies to be accurately called, we further imposed that a somatic mutation satisfy – log10(pFisher) > 0.8, where pFisher is the P-value in Fisher’s exact test. Furthermore, we stipulated that the number of read pairs with the variant is greater than 3 so as to avoid double counting of a variant located in both the two reads of single read pair with a small insert size. Herein, we included all the mutations including those in the non-coding regions to increase the number of mutations from various clonal populations. All candidate somatic mutations were validated by deep sequencings of the PCR products of the relevant loci using HiSeq 2000, as previously described (8). A candidate variant is thought to be validated if and only if all the following conditions are satisfied:
The sequencing depth is >5000 for both positive and negative strands;
The mismatch ratio in the paired normal samples is <0.5%; and
The mismatch ratio in the tumour sample is 5 times larger than that of the normal sample.
To compare the performances of EBCall and Genomon-Fisher, we also validated several candidates that were not called from EBCall but were called from Genomon-Fisher from the top in terms of the P-values.
RESULTS
Susceptibility to sequencing errors
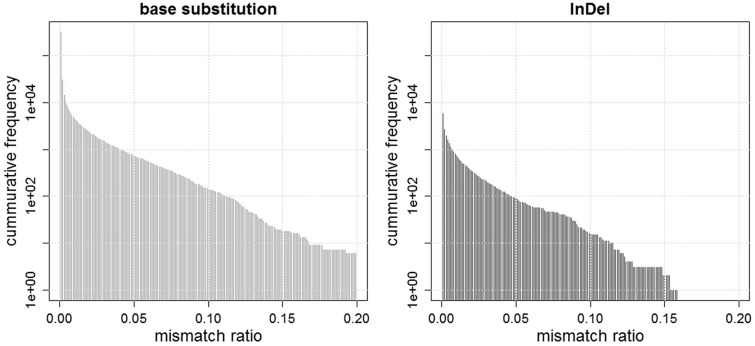
The distribution of mean sequencing error rates is shown in Figure 4. Although the error rates were calculated using high-quality sequencing reads (with a mapping quality of ≥30) and high-quality bases (with a base quality of ≥15) for substitution errors, there were many sites with relatively high sequencing error rates, indicating the existence of many sequencing error-prone sites. The higher rate of sequencing errors causes the more harm. When both the tumour and normal samples have a 2% sequencing error rate, the probability that the P-value of Fisher’s exact test is below 0.05 is ∼0.5% for the positions with a sequencing depth of 80 for tumour and normal samples. On the other hand, when the sequencing error rate is 5%, this probability increases to ∼2.2%. As there are 2582 sites with >2% mean sequencing error rate, we will obtain at least 13 false positives at the same threshold for data with a mean sequencing depth of 80. Furthermore, a subtle difference in the sequencing error rates between the tumour and normal samples caused by inconsistencies in the experimental conditions will generate an even higher rate of false positives under real situations. Although not a small proportion of sequencing errors was strand specific, there were still many variants prone to bi-directional sequencing errors (Supplementary Figure S1).
Figure 4.
Two bar plots showing the numbers of base substitutions and InDels, whose mean mismatch ratios are above the determined threshold values. For instance, the numbers of base substitutions with mean mismatch ratios of more than 0.01, 0.02, and 0.05 are 4472, 2232, and 727, respectively, while those of InDels are 717, 350, and 89, respectively.
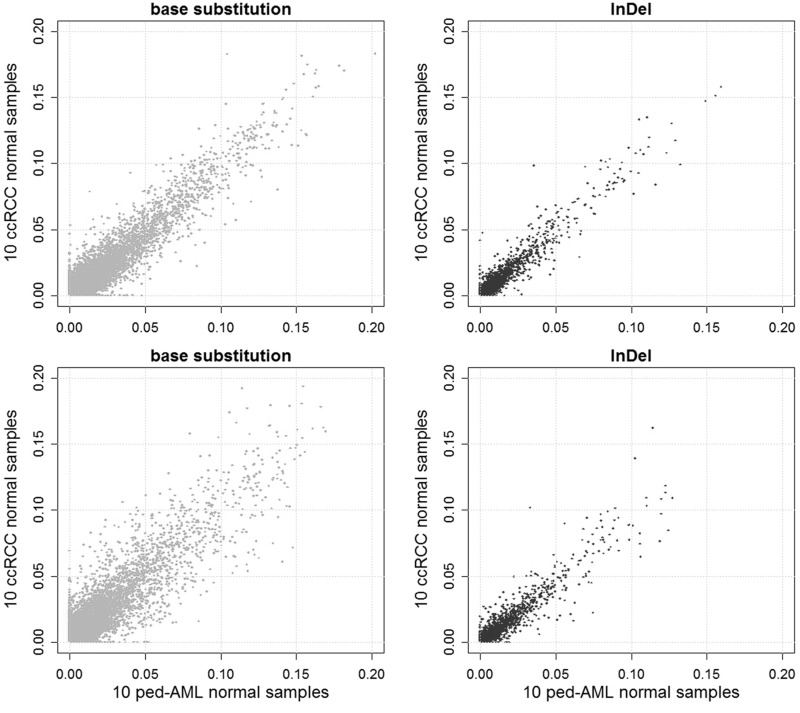
We next examined the consistency of sequencing error rates across different sets of samples (Figure 5). The sequencing error rates were highly correlated between the two sets of 10 ccRCC samples. The sequencing error rates were less consistent between the sets of 10 ccRCC samples and 10 ped-AML samples, indicating that it is better to use normal samples collected under conditions as similar as possible to predict sequencing errors. The correlations for InDels were stronger compared with the base substitutions, implying that the sequencing errors found in InDels are more systematic.
Figure 5.
A comparison of scatter plots of the mean mismatch ratios of the base substitution and InDels for two sets consisting of 10 ccRCC normal samples each (upper), and 10 ccRCC normal samples and 10 ped-AML normal samples (lower). The correlation coefficients are 0.777, 0.723, 0.943 and 0.917 for the upper-left, lower-left, upper-right and lower-right panels, respectively.
Performance comparison with other algorithms for moderate allele frequencies
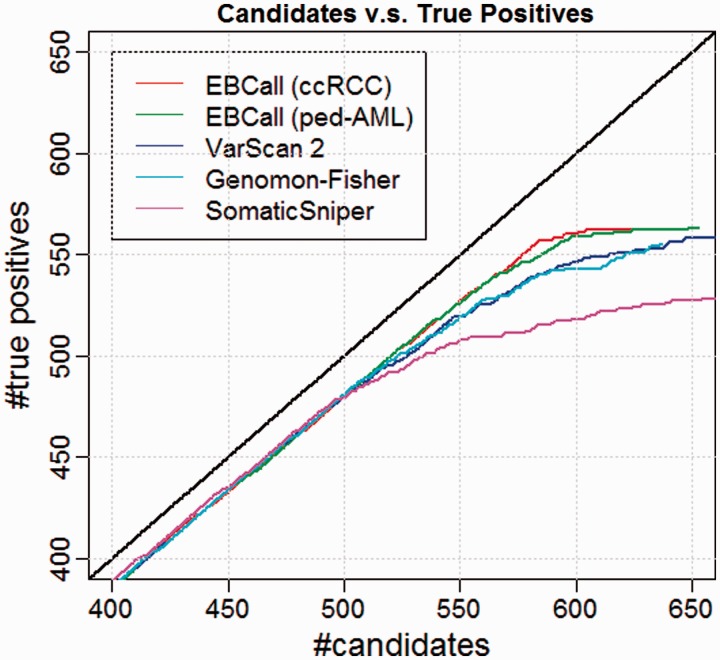
To compare the performance of different mutation calling algorithms, we first sorted the candidate mutations according to the accompanying confidence score for each method (the combined P-value for EBCall, the P-value of Fisher’s exact test for Genomon-Fisher and VarScan 2 and a somatic score for SomaticSniper) and checked the relationships between the number of candidates and the number of true positives (Figure 6). For mutations with high confidence values, there was no clear difference among the different calling methods used. However, for low confidence values (i.e. after the 500th confident mutation), EBCall showed higher true positive results than the other methods, as indicated by the upward deviation of the plot in Figure 6. The true positive rates (TPR) of SomaticSniper decreased more rapidly than those of other methods, whereas VarScan 2 and Genomon-Fisher show comparable plots probably reflecting the fact that both methods are based on Fisher’s exact test. For InDels, EBCall showed at least similar efficiency to VarScan 2 and Genomon-Fisher (Supplementary Figure S2).
Figure 6.
Comparative performance for EBCall (20 ccRCC or ped-AML normal samples used as normal reference sets), Genomon-Fisher, VarScan 2 and SomaticSniper. The horizontal and vertical axes show the number of candidate somatic mutations and true positives (when changing the threshold of the confidence score for each method) verified by whole genome and whole transcriptome data, respectively.
When using 20 ped-AML normal samples as non-paired normal reference samples, the performance of EBCall slightly worsened, which is reasonable considering the lower correlation of sequencing errors between the ccRCC samples and ped-AML samples. However, the TPR was still higher than in the other existing approaches, indicating that the proposed approach is robust to the choice of normal reference samples to a certain extent. To examine the required number of normal reference samples, the performance of EBCall for different numbers of normal reference samples was measured. As shown in Supplementary Figure S3, it took 15–17 samples for a performance saturation for both the ccRCC and ped-AML reference samples.
Next, we investigated the sample-wise sensitivity of each method, in which the threshold value for each method was determined under false positive rates of 0.05, (i.e. 6.54 × 10⁻⁴ for EBCall, 1.97 × 10⁻³ for VarScan, 60 for SomaticSniper and 5.85 × 10⁻³ for Genomon-Fisher). As shown in Supplementary Figure S4, EBCall generally outperformed the other calling methods (P < 0.0074, Mann–Whitney U test). The improvement in sensitivity varied among the samples may depend on the difference in the mean coverage of the sequencing and tumour contents.
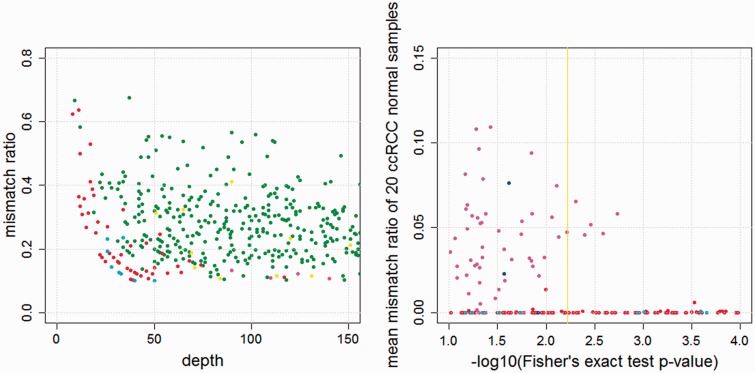
As shown in Figure 7, EBCall detected 51 more mutations with six fewer false positives at the cost of nine more false positives as compared with Genomon-Fisher. Most of the mutations captured only by EBCall showed low sequencing depths or low allele frequencies. Furthermore, EBCall detected a number of mutations whose P-value based on Fisher’s exact test is moderate (0.1–0.01), maintaining a TPR of 95%. Many candidates with low P-values showed high mean mismatch ratios in other normal samples. These were generally considered to be false positives resulting from sequencing errors that were specific to the target tumour samples at sequencing error-prone sites. To avoid these false positives and maintain a high TPR, a high threshold value had to be set for Genomon-Fisher. On the other hand, EBCall effectively removed most of these false positives and recovered a number of true somatic mutations. Furthermore, we tested EBCall by changing the threshold values for base qualities and mapping qualities and confirmed that the efficiency our method is robust against different parameter values (Supplementary Figure S5).
Figure 7.
(Left) The comparative results between EBCall and Genomon-Fisher. Each point, in which the sequencing depth and variant allele frequency are indicated, shows the candidate somatic mutations called by both or either of the two methods. The threshold values are determined such that the false positive rates are 0.05. The green and red points show true positive mutations called by both of the two methods, and only EBCall, respectively. The yellow, cyan and magenta points show false positive mutations called by both of the two methods, only EBCall, and only Genomon-Fisher, respectively. The numbers of green, red, yellow, cyan and magenta points are 506, 51, 20, 9 and 6, respectively. There are no true positive mutations called by Genomon-Fisher exclusively. (Right) The P-values of Fisher’s exact test and the mean mismatch ratio of 20 ccRCC normal samples are plotted. The red and blue points show true positive mutations called and not called by EBCall, respectively. On the other hand, the cyan and magenta points show false positive mutations called and not called by EBCall, respectively. The yellow vertical line shows the threshold value of the Genomon-Fisher determined with false positive rates of 0.05.
The processing time of EBCall for one sample was 6.5–9.7 h using single core CPU, Intel Quad Core Xeon E5450, 3.0 GHz), whereas those of VarScan 2, and SomaticSniper were 3.2–6.6 h and 0.7–1.1 h, respectively.
Detection of mutations with low allele frequencies
In total, 557 candidate somatic mutations were called from three tumour samples (RCC31, RCC88 and RCC102) by EBCall with an additional constraint for the Fisher’s P-values (see ‘Materials and Methods’ section). Among these, 395 were evaluable by deep sequencing, of which 349 were successfully confirmed as true mutations. The remaining 162 candidates were not evaluable in deep sequencing owing to either a failure in the design of the PCR primers or low sequencing depths (<5000) for either positive or negative strands. Therefore, they were excluded from the calculation of the true and false positives rates.
As shown in Table 1, high TPRs were obtained for candidates with high apparent allele frequencies (>10%): 100, 99.1 and 94.6% for RCC31, RCC88 and RCC102, respectively. For mutations with lower allele frequencies (<10%), TPRs were lower but still showed relatively high values of 79.3, 88.0 and 59.0% for RCC31, RCC88 and RCC102, respectively. Among the 10 candidates called by only Genomon-Fisher, only one was successfully validated.
Table 1.
The numbers of true and false positives for mutations with moderate (above 10%) allele frequencies
| Sample | RCC31 | RCC88 | RCC102 | RCC102 (filtered) |
|---|---|---|---|---|
| No. of true positives | 78 | 109 | 71 | 69 |
| No. of false positives | 0 | 1 | 4 | 1 |
Next, we investigated the causes of false positive results in RCC102. We found that many false positive candidates were supported by reads that were aligned more consistently with the transcriptome than with the genome sequence (Supplementary Figure S6), indicating that small amounts of RNA may have contaminated the exome sequencing library in RCC102, resulting in the calling of several false positives owing to the existence of ambiguous alignments. These false positives were successfully eliminated without affecting the sensitivities by filtering those candidates that have other mutations within 300 bp from the mutation site, through which the TPR increased to 83.6% (Table 2). As the allele frequencies for this kind of false positive were mostly below 10%, RNA contamination may have been problematic only when calling mutations with a low allele frequency.
Table 2.
The numbers of true and false positives for mutations with low (above 2% and below 10%) allele frequencies
| Sample | RCC31 | RCC88 | RCC102 | RCC102 (filtered) |
|---|---|---|---|---|
| No. of true positives | 23 | 22 | 46 | 46 |
| No. of false positives | 6 | 3 | 32 | 9 |
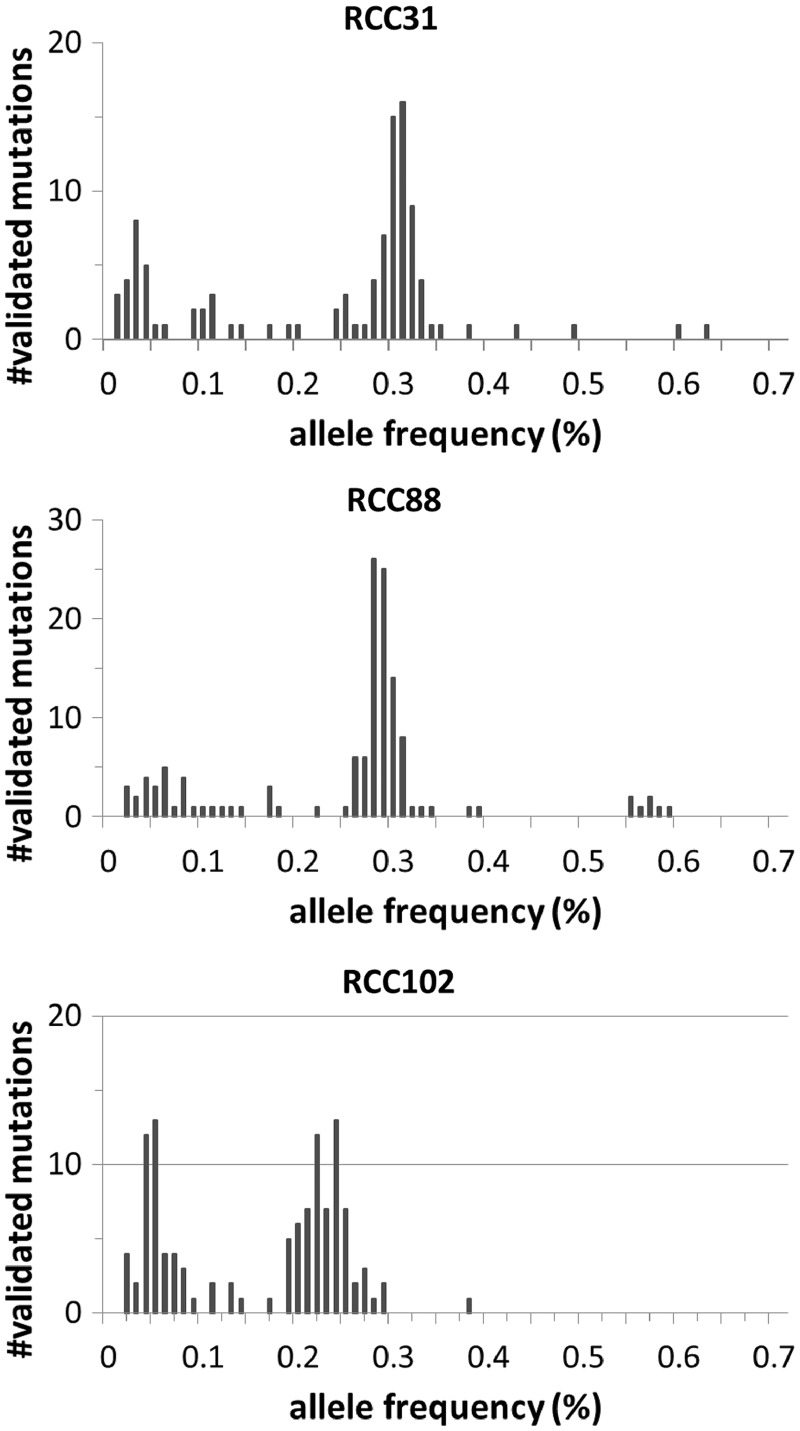
Finally, the distribution of allele frequencies calculated in deep sequencing for each sample is plotted in Figure 8. The histogram clearly shows the presence of minor tumour subpopulations of cancer cells with <10% allele frequencies in each sample, suggesting that the sensitive detection of somatic mutations with low allele frequencies is effective in capturing intratumoural heterogeneity.
Figure 8.
Histograms of the allele frequencies of validated mutations for RCC31 (left), RCC88 (centre) and RCC102 (right).
DISCUSSION
In this article, we have proposed a novel statistical framework, EBCall, for detecting somatic mutations using a massively parallel sequencing of the cancer genome. The concept of using data from multiple samples to eliminate sequencing errors is not completely new, but it has been adopted in previous studies (10,16) to discriminate true somatic mutations from errors in the targeted sequencing of much smaller regions. However, most of these approaches filter out somatic mutations with approximately the same common non-reference allele frequencies among multiple tumour samples by regarding them as common sequencing errors. Our approach, on the other hand, uses multiple non-paired normal samples to explicitly estimate the distribution of sequencing errors. Furthermore, we extended this approach to much larger genomic regions (∼50 Mb) and accomplished accurate mutation calling from whole-exome sequencing. EBCall was not only superior to several existing methods for somatic mutations with moderate-to-high allele frequencies but also effectively detected somatic mutations with low allele frequencies of <10%, which helps in the identification of a clonal architecture within a cancer population. The fact that EBCall was robust to the choice of normal reference samples implies that we could improve the accuracy of mutation calling just by using normal samples available in a regular project. Although we confined its application to exome sequencing data in this article, we expect that our approach can improve the accuracy in whole-genome sequencing data with moderate sequencing depths.
A simpler approach for the empirical elimination of sequencing errors would be to identify error-prone genomic positions that satisfy an arbitrary set of criteria (e.g. a 2% mismatch ratio for ≥3 samples among groups of 20 normal samples) and exclude all variants at these positions. However, as the number of sequencing errors has a long-tailed distribution, setting a threshold value for extracting a set of sequencing error prone sites is not a trivial task. The use of overly strict criteria may not remove false positives effectively. On the other hand, when we filter too broad a range of error prone sites, we may miss some true somatic mutations, even when their allele frequencies are considerably higher than the slightly elevated sequencing error rate at that position. Our approach is more flexible in discriminating true mutations from errors because it relies on a rigorous statistical model.
Another approach is to eliminate sequencing errors based on knowledge of the error-prone sequencing features, such as a homo-polymer sequence and specific sequence motifs (11,12). These features can be used to eliminate more sequencing errors and achieve further improvements in accuracy. However, the prediction of error-prone features may not be exhaustively identified or uniformly applied to real sequencing data, regardless of the experimental conditions.
As discussed previously, an understanding of the intratumoural architecture of gene mutations provides an important insight into the clonal evolution of tumour cells, in which the detection of mutations with low allele frequencies is of critical importance. A recent study elegantly approached this issue using deep sequencing (×200) of the whole genome in a breast cancer sample (5). Whole-genome deep sequencing is a powerful approach for detecting sufficient numbers of somatic mutations and reliably identifying tumour subclones. However, the cost of whole-genome deep sequencing for multiple samples remains expensive. Alternatively, with improved detection of low allele frequency mutations, sequencing data from more targeted regions, such as a whole exome, at a similar depth (e.g. 150–300) can provide an opportunity to capture a sufficient number of repertories of gene mutations within the coding sequences and disclose fine clonal architectures of mutations for multiple samples at acceptable costs.
SUPPLEMENTARY DATA
Supplementary Data are available at NAR Online: Supplementary Tables 1 and 2, and Supplementary Figures 1–6.
FUNDING
Funding for open access charge: Integrative Systems Understanding of Cancer for Advanced Diagnosis, Therapy and Prevention (Grant-in-Aid for Scientific Research on Innovative Areas from the Ministry of Education, Culture, Sports, Science and Technology, Japan).
Conflict of interest statement. None declared.
Supplementary Material
ACKNOWLEDGEMENT
The super-computing resource was provided by Human Genome Center, Institute of Medical Science, the University of Tokyo. The authors also thank H. Tanaka, Y. Mori and N. Mizota for their technical assistance.
REFERENCES
- 1.Meyerson M, Gabriel S, Getz G. Advances in understanding cancer genomes through second-generation sequencing. Nat. Rev. Genet. 2010;11:685–696. doi: 10.1038/nrg2841. [DOI] [PubMed] [Google Scholar]
- 2.Shah SP, Morin RD, Khattra J, Prentice L, Pugh T, Burleigh A, Delaney A, Gelmon K, Guliany R, Senz J, et al. Mutational evolution in a lobular breast tumour profiled at single nucleotide resolution. Nature. 2009;461:809–813. doi: 10.1038/nature08489. [DOI] [PubMed] [Google Scholar]
- 3.Ding L, Ley TJ, Larson DE, Miller CA, Koboldt DC, Welch JS, Ritchey JK, Young MA, Lamprecht T, McLellan MD, et al. Clonal evolution in relapsed acute myeloid leukaemia revealed by whole-genome sequencing. Nature. 2012;481:506–510. doi: 10.1038/nature10738. [DOI] [PMC free article] [PubMed] [Google Scholar]
- 4.Shah SP, Roth A, Goya R, Oloumi A, Ha G, Zhao Y, Turashvili G, Ding J, Tse K, Haffari G, et al. The clonal and mutational evolution spectrum of primary triple-negative breast cancers. Nature. 2012;486:395–399. doi: 10.1038/nature10933. [DOI] [PMC free article] [PubMed] [Google Scholar]
- 5.Nik-Zainal S, Van Loo P, Wedge DC, Alexandrov LB, Greenman CD, Lau KW, Raine K, Jones D, Marshall J, Ramakrishna M, et al. The life history of 21 breast cancers. Cell. 2012;149:994–1007. doi: 10.1016/j.cell.2012.04.023. [DOI] [PMC free article] [PubMed] [Google Scholar]
- 6.Larson DE, Harris CC, Chen K, Koboldt DC, Abbott TE, Dooling DJ, Ley TJ, Mardis ER, Wilson RK, Ding L. SomaticSniper: identification of somatic point mutations in whole genome sequencing data. Bioinformatics. 2012;28:311–317. doi: 10.1093/bioinformatics/btr665. [DOI] [PMC free article] [PubMed] [Google Scholar]
- 7.Roth A, Ding J, Morin R, Crisan A, Ha G, Giuliany R, Bashashati A, Hirst M, Turashvili G, Oloumi A, et al. JointSNVMix: a probabilistic model for accurate detection of somatic mutations in normal/tumour paired next-generation sequencing data. Bioinformatics. 2012;28:907–913. doi: 10.1093/bioinformatics/bts053. [DOI] [PMC free article] [PubMed] [Google Scholar]
- 8.Yoshida K, Sanada M, Shiraishi Y, Nowak D, Nagata Y, Yamamoto R, Sato Y, Sato-Otsubo A, Kon A, Nagasaki M, et al. Frequent pathway mutations of splicing machinery in myelodysplasia. Nature. 2011;478:64–69. doi: 10.1038/nature10496. [DOI] [PubMed] [Google Scholar]
- 9.Koboldt DC, Zhang Q, Larson DE, Shen D, McLellan MD, Lin L, Miller CA, Mardis ER, Ding L, Wilson RK. VarScan 2: somatic mutation and copy number alteration discovery in cancer by exome sequencing. Genome Res. 2012;22:568–576. doi: 10.1101/gr.129684.111. [DOI] [PMC free article] [PubMed] [Google Scholar]
- 10.Li M, Stoneking M. A new approach for detecting low-level mutations in next-generation sequence data. Genome Biol. 2012;13:R34. doi: 10.1186/gb-2012-13-5-r34. [DOI] [PMC free article] [PubMed] [Google Scholar]
- 11.Dohm JC, Lottaz C, Borodina T, Himmelbauer H. Substantial biases in ultra-short read data sets from high-throughput DNA sequencing. Nucleic Acids Res. 2008;36 doi: 10.1093/nar/gkn425. e105. [DOI] [PMC free article] [PubMed] [Google Scholar]
- 12.Nakamura K, Oshima T, Morimoto T, Ikeda S, Yoshikawa H, Shiwa Y, Ishikawa S, Linak MC, Hirai A, Takahashi H, et al. Sequence-specific error profile of Illumina sequencers. Nucleic Acids Res. 2011;39 doi: 10.1093/nar/gkr344. e90. [DOI] [PMC free article] [PubMed] [Google Scholar]
- 13.Li H, Durbin R. Fast and accurate short read alignment with Burrows-Wheeler transform. Bioinformatics. 2009;25:1754–1760. doi: 10.1093/bioinformatics/btp324. [DOI] [PMC free article] [PubMed] [Google Scholar]
- 14.Langmead B, Trapnell C, Pop M, Salzberg SL. Ultrafast and memory-efficient alignment of short DNA sequences to the human genome. Genome Biol. 2009;10:R25. doi: 10.1186/gb-2009-10-3-r25. [DOI] [PMC free article] [PubMed] [Google Scholar]
- 15.Kent WJ. BLAT–the BLAST-like alignment tool. Genome Res. 2002;12:656–664. doi: 10.1101/gr.229202. [DOI] [PMC free article] [PubMed] [Google Scholar]
- 16.Bansal V. A statistical method for the detection of variants from next-generation resequencing of DNA pools. Bioinformatics. 2010;26:i318–i324. doi: 10.1093/bioinformatics/btq214. [DOI] [PMC free article] [PubMed] [Google Scholar]
- 17.Wang K, Li M, Hakonarson H. ANNOVAR: functional annotation of genetic variants from high-throughput sequencing data. Nucleic Acids Res. 2010;38 doi: 10.1093/nar/gkq603. e164. [DOI] [PMC free article] [PubMed] [Google Scholar]
Associated Data
This section collects any data citations, data availability statements, or supplementary materials included in this article.


