

Abstract
The interplay between myosin, actin, and striated muscle regulatory proteins involves complex cooperative interactions that propagate along the thin filament. A repeating unit of the tropomyosin dimer, troponin heterotrimer, and the actin protofilament heptamer is sometimes assumed to be able to bind myosin at any of its seven actins when activated even though the regulatory proteins are asymmetrically positioned along this repeating unit. Analysis of the impact of this asymmetry on actin and myosin interactions by sensitized emission luminescence resonance energy transfer spectroscopy and a unique fluorescent nanocircuit design reveals that the troponin affects the structure and function of myosin heads bound nearby in a different manner than myosin heads bound further away from the troponin. To test this hypothesis, a fluorescent nanocircuit reported the position of the myosin lever arm only when the myosin was bound adjacent to the troponin, or in controls, only when the myosin was bound distant from the troponin. Confirming the hypothesis, the myosin lever arm is predominantly in the prepowerstroke orientation when bound near troponin, but is predominantly in the postpowerstroke orientation when bound distant from troponin. These data are consistent with the hypothesis that troponin is responsible for the formation of myosin binding target zones along the thin filament.
Keywords: troponin bridge, target zone, muscle regulation, muscle contraction, lanthanide chelates, time-resolved fluorescence
INTRODUCTION
The thin and thick filaments of striated muscle interact through intermittent crossbridges formed from the binding of myosin heads onto actin. The helical periodicity of the thick filament differs from the thin filaments suggesting crossbridges might potentially form with any actin along the thin filaments unless the thin filament was mapped into defined target zones. Evidence for such target zones has been observed previously using electron microscopy and x-ray diffration on insect flight muscle [1–6]. Subsequently, target zones in vertebrate muscle were also reported [7–10]. The cause of these target zones in vertebrate striated muscle have not been determined, but they appeared to be located between the troponin complexes along each actin protofilament.
Despite the observation of target zones, substantial in vitro evidence indicates that actin filaments decorated with troponin and tropomyosin can be saturated with myosin S1 rigor binding at a nearly one to one ratio with actin protomers [11]. The precise stoichiometry of S1 binding to the thin filament in the presence of ATP is less thoroughly investigated and may not necessarily reach the same level of saturation as rigor binding. A stoichiometry of one S1 per actin protomer produces a densely decorated filament that greatly limits the space available for troponin, tropomyosin and other thin filament binding proteins such as nebulin [12]. Thus, it is plausible that target zones may exist in vivo due to the competition for territory along the thin filament surface [13]. Alternatively, myosin heads might not bind homogeneously along the actin filament due to variations in the thin filament structure.
If asymmetries in S1 affinity for actin occur in the presence of regulatory proteins, the structure of S1 might also vary with its position along the thin filament. The orientation of the lever arm of S1 varies remarkably under different crystallization conditions as determined by X-ray crystallography [14–16]. These lever arm orientations are thought to correspond to different affinity states of S1 for actin with the intermediate angles being of higher affinity and the more extreme angles related to either weak actin attachment or dissociation. Since the orientation of the lever arm of S1 is affected by relatively slight changes in crystallization conditions, these observations suggest that the environment of the S1 can affect the this lever arm orientation. Consequently, it is not unreasonable to hypothesize that S1 bound near troponin could be induced to have a lever arm orientation that might be different from that of S1 bound further away from troponin along the thin filament. Since S1 bound near troponin could sterically interfere with the postpowerstroke structure of S1 on the thin filament based on previous structural studies [13], the possibility that the prepowerstroke state structure might be favored for S1 bound close to troponin was suggested as possible consequence.
The current investigation examines whether S1 bound near troponin would tend to have a prepowerstroke state orientation of the lever arm, while S1 bound to actin in the target zones would be more likely to possess lever arm orientations in a postpowerstroke state. To determine if such asymmetries in myosin lever arm orientations correlate with purported target zones, a novel nanocircuit assay was developed that enables measurements in three different sites as a relay of energy transfer that involve myosin as well as the muscle regulatory proteins of the thin filament. Being the first time that a third parameter is used to study conformations of the lever arm, this nanocircuit is a unique assay compared to previous FRET measurements [17–20] that now enables the position of the lever arm to be measured separately for S1 bound in the target zone and S1 bound adjacent to the troponin complex. The data are consistent with the proposal of a troponin bridge with myosin [21–22].
MATERIALS AND METHODS
Preparation of myosin subfragment-1 by papain treatment and endogenous RLC stripping
Myosin subfragment 1 (S-1) was prepared by papain digestion of polymerized rabbit skeletal myosin [13]. Myosin (stored flash-frozen) in 0.5 M KCl, 10 mM imidazole, pH 7.0 was centrifuged at 100,000 g (47,000 rpm) in a TLA 100.3 rotor (Beckman TL-100 ultracentrifuge) for 1 hour at 4°C to remove aggregates. The cleared supernatant was dialyzed against 1 L. of 0.1 M KCl, 10 mM imidazole, pH 7.0 for 15 hours (overnight) at 10°C, lowering the salt concentration causes the myosins to form filaments. The next day, MgCl2 was added to a final concentration of 2 mM prior to digestion. Fresh papain was added to a final concentration of 0.2 mg/ml (2 units/ml) to the protein solution and incubation was done for 7 minutes at 25°C or room temperature in a shaker. The proteolytic reaction was stopped by the addition of 50 ul of E-64 (from SIGMA) per ml of myosin solution. The products were dialyzed 15 hours (overnight) against 1 L. of 0.04 M KCl, 10 mM imidazole, pH 7.0. The next day ultracentrifugation at 100,000 × g (47,000 rpm in a TLA 100.3 rotor) for 1 hour at 4°C yields S1 in the supernatant.
The S1 preparation (containing the endogenous RLC) was run through a first Toyopearl 55-F gel filtration column to buffer exchange the protein to 50 mM potassium propionate, 20 mM EDTA, 10 mM potassium phosphate, 0.5 mM DTT, pH 7.0. The eluted S1 in potassium propionate buffer was heated at 30°C for 15 minutes to extract the endogenous RLC. Separation of the stripped RLC was accomplished by a second Toyopearl 55-F gel filtration step after heat removal (Fig. 1D).
Fig 1.

Labeling sites and purified proteins. A) Troponin labeling site. The structure is based on that from Takeda et al. [28–29]; however, the homologous residues have been computationally mutated to those of the chicken breast muscle troponin T that contains a single cysteine for labeling [13]. B) Tropomyosin α labeling site. Tm α molecule 7 Å resolution crystal structure from porcine ventricles crystallized by Whitby and Philips [30], showing Cys 190 highly conserved residue in pig, human, rat and rabbit. C) SDS-PAGE of purified tropomyosin and troponin. Purified and reconstituted troponin in equal molar ratios are in lane Tn. Purified tropomyosin α is shown in lane Tm. A fraction containing a mixture of tropomyosins α and is run in lane hTm for reference. D) SDS-PAGE of myosin S1 after the regulatory light chain is removed.
DTNB purification and Terbium chelate conjugation of RLC
RLC was dissociated from rabbit skeletal muscle myosin with DTNB [24] and purified by β-mercaptoethanol reduction followed by Superdex-75 gel filtration chromatography to remove excess Ellman’s reagent. RLC of high purity was obtained. The purified rabbit skeletal RLC was labeled with a 1,500 × molar excess of an equimolar mixture of carbostyril-124 and DTPA in DMSO to conjugate terbium with DTPA/CS124. DTPA is a dianhydride reagent that attaches to carbostyril via one anhydride, the other one interacts with the amine groups of lysine residues of RLC. The great excess of free reagents were dialyzed over a weekend and subjected to several rounds of buffer exchange by concentration and dilution using a Millipore Centricon centrifugal filter device with a membrane of a molecular weight cut off of 5,000; 4 times smaller than the RLC protein’s molecular weight.
CS 124-Tb-RLC exchange to S1 and labeling ratio by terbium titration
Cs-124 labeled RLC was added at molar excess to S1 to be exchanged back with overnight dialysis in 1 mM MgCl2, 0.1 M KCl and 10 mM imidazole, pH 7 overnight. The next day, excess free labeled RLC was separated by Superdex 75 gel filtration and protein was concentrated using Centricon concentrators to 2 μM (about 0.25 mg/ml) as read on a HP UV-V is spectrophotometer (extinction coefficient for S1 is 0.75 ml mg−1cm−1).
Terbium titration was carried on an SLM-Aminco Bowman II luminescence spectrometer (Spectronic Instruments, Rochester, NY) with dual xenon arc and flashlamp light sources. Titration was carried by incubating the CS 124-RLC-S1 with increasing amounts of terbium chloride solution. Excitation was set at 337 nm with emission collected at 547 nm, the intensity of emission was plotted against the concentration of terbium chloride, indicating a 100% labeling ratio.
Tropomyosin-α and troponin purification and Cy7 labeling
Tropomyosin was extracted from acetone powder from rabbit skeletal back muscle mince in 1.0 M KCl, 0.5 mM DTT at pH 7 according to a modified protocol of Bailey and further purified as α,α- and α,β-tropomyosin by hydroxyapatite chromatography as the method described by Cummins and Perry [23]. The proteins were eluted by a linear gradient of 1–200 mM phosphate buffer to separate the two subfractions: α (higher electrophoretic mobility) and β subunits (Fig. 1C). The α subunit contains a single cysteine residue, whereas the β subunit has two cysteine residues per 33 kDa. The single cysteine containing Tm-α was picked for labeling (Fig. 1). Fractions containing only α,α-tropomyosin were pooled to a final concentration of 4 mg/ml and were denatured by dialysis in 6 M urea and 10 mM imidazole pH 7. Labeling was carried under denaturing conditions of 6 M urea with Cy7-maleimide with the purpose of labeling the single Cys 190 residue in the rabbit Tm-α. Cys 190 is involved in disulphide crosslinking of the polypeptide chains of a dimer and it is highly conserved in the α tropomyosins in human, pig, rat and rabbit (Perry, 2001). The labeled protein was flash frozen for storage until needed.
The troponin subunits were purified after the tropomyosin extraction from rabbit skeletal muscle in denaturing conditions 6 M urea with FPLC chromatography in a DEAE-Sephadex A-50 column as described in Colowick [25], with an additional chromatography step with Sephadex G50/75 for the removal of lower molecular weight contaminants in the troponin I subunit isolation.
The Cy7 labeled troponin T subunit (Fig. 1A) used is a modification of a naturally occurring isoform from skeletal avian breast muscle that was labeled by a similar protocol as tropomyosin on its single cysteine that has also been used for the attachment of different fluorescent probes [26–27].
EXPERIMENTAL
Nanocircuit assay of Acto-S1-Tropomyosin-Troponin complex in solution
The acto-S1 experiments were performed in 0.1 M KCl, 2 mM MgCl 2, and 10 mM imidazole, pH 7.0. The concentrations in the assay of labeled S1 were 0.5–0.8 μM, while the molar ratios of S1 to actin assayed were 1:1 and 1:7 in order to analyze two conditions: saturating or 1 S1 per 1 actin molar ratio and at 1 S1 per 7 actin molar ratio. Since TnT repeats at every 7 actin monomers, the idea is to measure if crowding of S1 heads affects lever arm conformations in the saturated versus the non saturated conditions. No significant effect of actin saturation with myosin S1 was clearly observed, therefore for detection efficiency purposes, saturating conditions were used. Actin was reconstituted by dialysis in assay buffer and assembled with 1/7 ratio of renatured tropomyosin, troponin I, C, and Cy7 troponinT. The complex is added to the system (case I, Fig. 2). The same ratios apply to the thin filament reconstitution involving the Cy7 label at tropomyosin α (case II, Fig. 2). Other conditions are measured with no nucleotide, with CY5-ADP at final equimolar amounts to S1, with transition analogs beryllium and aluminum fluoride (at 0.1 mM final concentration) and + and – calcium removed by the addition of EGTA at also 0.1 mM final concentration of CaCl2.
Fig 2.

Components of the nanocircuit relay. Donor, 1st acceptor and two possibilities for a 2nd acceptor. Excitation of the CS-124 antenna with a pulsed laser excites the terbium chelate on the lever arm which transfers energy to its acceptor, Cy5-ADP on labeling the nucleotide binding site of myosin, which in turn relays the energy to any of the two last acceptor on the thin filament: Cy7-troponin (case I) or Cy7-tropomyosin α (case II)
All contractile protein components were mixed in a 100 ul total volume reaction in an eppendorf UVette without CY5-ATP for a “donor” only measurement of emission and decays at 540 nm, 690 nm and 780 nm in the appropriate buffer. First acceptor CY5-ADP labeling the nucleotide binding pocket was added as CY5-ATP for the nanocircuit to occur and appropriate signals were read after a 5 minute incubation (to allow ATP hydrolysis) at 540 nm, 690 nm and 780 nm as well.
Papain, DTPA, beryllium, aluminum chloride, sodium fluoride, and terbium chloride hexahydrate were obtained from Sigma Aldrich. Cy5 and Cy7 from Amersham-Pharmacia Biotech.
Nanocircuit LRET measurements
An SLM-Aminco Bowman II luminescence spectrometer (Spectronic Instruments, Rochester, NY) with dual xenon arc and flashlamp light sources was used to record luminescence spectra. Delayed lifetime measurements were collected after 200 μs following the excitation pulse of the flashlamp to the laser at 337 nm. Delayed emission spectra were accumulated after a 200 μs delay after flash with a gate width of 4.5 ms. Luminescent decay curves were accumulated at a resolution of 200 μs and averaged for 200 repetitions to increase the signal-to-noise ratio. The donor of the resonance energy transfer relay was terbium in the RLC. The terbium signal was enhanced by the chromophore carbostyril 124, which transfers energy to terbium by excitation at 337 nm with a nitrogen laser with a bandpass of 16 nm. The sensitized emission of the fluorescent acceptors were recorded at 547 nm (for terbium) with a bandpass of 4 nm; at 690 (for Cy5-ADP) with a bandpass of 4 nm; and at 780 nm (for Cy7 TnT) at high voltage and a bandpass of 8 nm. Sensitized emissions are only detected if the resonance energy transfer occurs, because the delay allowed after the pulsed excitation signal causes background fluorescence such as Raman and light scattering to decay to negligible levels before the data are collected.
Data Analysis: single and double exponential fitting of decay curves
Emission scans with donor only and in the presence of acceptors were subtracted of a baseline, instrument correction was performed to compensate for the lack of sensitivity of the photomultiplier after wavelength 600 nm. Final curves were smoothed to 15 points and exported to excel for plotting. The nanocircuit is broken if any of the three components is farther apart than their Ro distance for energy transfer to occur, so the decay of signal from the terminal acceptor reports on the conformation of myosin S1 bound near troponin (or tropomyosin) while the decays of previous fluors of the circuit report on the average conformations of all S1 regardless of their position.
The lifetimes of the decay curves were calculated by MacCurvefit Software (version 1.3.3 by Kevin Rainer). Lifetimes at 547 nm were fitted single and double exponentially to account for the molecules that are bound to actin and the ones unbound. The efficiency of energy transfer (E) and distance (R) between donor and acceptors were determined by comparing lifetime measurements of the donor without the acceptor present and the sensitized emission of the acceptor in the presence of the donor per equations 1, 2, and 3.
RESULTS
The fluorescent nanocircuit detects the conformation of the myosin lever arm when myosin is bound near a final acceptor attached to either of two different positions along the thin filament : 1) the troponin complex (specifically at troponin T isoform TnT8e16 C263) or 2) tropomyosin C190 (Fig. 1) which is located between the troponin complexes along the thin filament. This fluorescent nanocircuit enables a test for the position of the lever arm on myosin S1 bound near troponin compared with myosin S1 bound to sites in between the troponin complexes (see Fig. 2). This experiment is a unique test of the whether myosin conformation varies depending on its site of attachment to the thin filament.
Inevitably, myosin S1 is bound to multiple sites along the thin filament; therefore it is essential to effectively filter out the signal from myosin S1 bound at sites other than the desired site. To test the ability of the fluorescent nanociruit to isolate the signal of only myosin S1 bound to the desired site, a control was performed that deliberately breaks the fluorescent nanocircuit (Fig. 3). Since energy normally flows from the terbium chelate to CY5-ADP to Cy7, the substitution of unlabeled ADP for CY5-ADP was made to see if the CY7 signal was extinguished. As can be seen in Fig. 3A, the absence of CY5 eliminates any detectable time-resolved fluorescent signal from CY7 thereby breaking the relay of the fluorescent nanocircuit. In contrast, when CY5-ADP is present to complete the circuit, the CY7 signal is comparatively robust (Fig. 3B). This difference in signals is sufficient to permit lifetime measurements using the CY7 signal that only reports on myosin S1 with both the terbium chelate and CY5-ADP in close proximity.
Fig 3.

Nanocircuit: A) no CY5-ADP between donor and last acceptor. B) complete nanocircuit with CY5-ADP. Nanocircuit with second acceptor Cy7-tropomyosin α. In the presence of unlabeled ADP, no energy transfer is observed between the RLC (donor) and the last acceptor Tropomyosin α showing no cross-contamination between these two labeling sites representing a “broken” energy transfer circuit (A). Donor only and nanocircuit occurring after the addition of Cy5-ADP (first acceptor), causing time-resolved fluorescent emission changes at both 690 and 780. Consequently, Cy7 signal at 780 nm only reports RET of myosins bound to actin and adjacent to labeled tropomyosin. In each case, assay conditions were performed in the presence of Ca 2+; until removal by the addition of EGTA.
The strength of the signal from the fluorescent nanocircuit is sensitive to the affinity of myosin S1 binding near troponin on the thin filament. The affinity of myosin S1 binding to actin is weakened by the addition of the phosphate analog AlF4− in the presence of CY5-ADP with which it forms a complex. As can be seen in Fig. 4, the CY7 signal is noticeably reduced upon addition of the phosphate analog which indicates that less myosin S1-CY5-ADP+ AlF4− is bound near the troponin complex than without the phosphate analog. In contrast, the removal of calcium ion by adding EGTA produces an amplitude of CY7 signal that is only slightly higher than that of S1-CY5-ADP+ AlF4− with calcium ion.
Fig. 4.
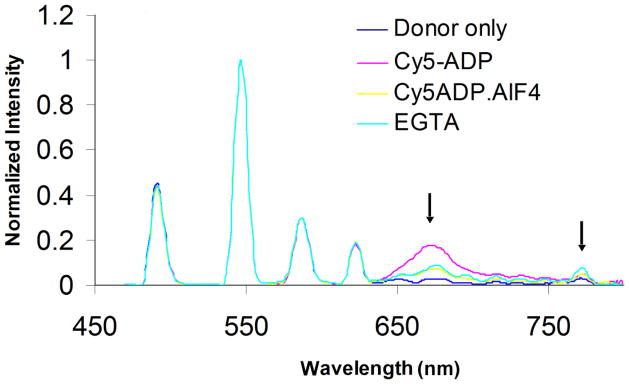
The complete emission spectra of a nanocircuit assay with Cy7-TnT as second acceptor. Donor is Tb chelate-RLC (donor only in blue), first acceptor Cy5-ADP (magenta) or Cy5-ADP.AlF4 (yellow) and second acceptor Cy7-TnT. Assay conditions were performed in the presence of Ca 2+; until removal by the addition of EGTA.
Thus, the affinity changes due to the presence of the phosphate analog are easily noticeable, but the effects of calcium ion are more subtle. As Fig. 5 illustrates, the calcium ion does not produce a detectable shift in the pre-powerstroke versus post-powerstroke orientation of the lever arm; however, the removal of calcium ion by adding EGTA does increase the energy transfer between the CY5-ADP and the troponin which is consistent with a conformational change of the troponin complex (Fig. 5B). These amplitude changes are difficult to interpret quantitatively, because they also depend on the fraction of myosin S1 bound as well as probe orientations. The effect was somewhat greater with BeFx as the phosphate analog, but in general both phosphate analogs produced similar types of results.
Fig. 5.
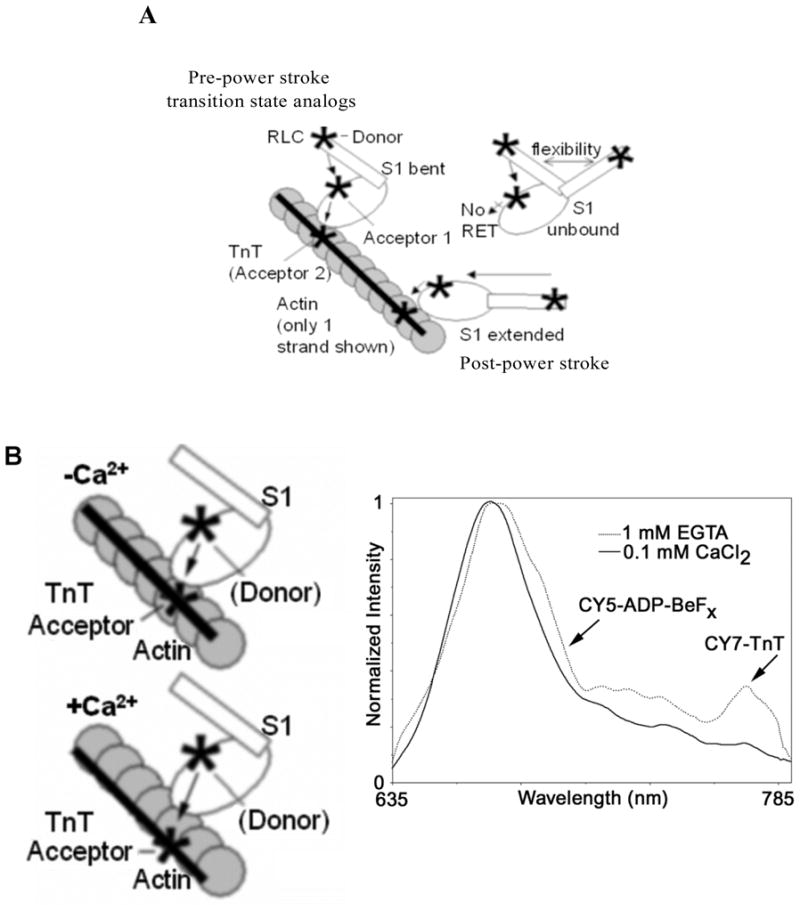
Lever arm positions and calcium effect. Lever arm positions detected by nanocircuit illustrated using TnT labeled by Cy7 as second acceptor: bent lever arm or pre-power stroke and extended lever arm or post-power stroke. Also illustrated unbound molecules that will be detected by 547 nm emissions and not by 780 emissions, explaining the single and double exponential fitting of decays obtained at 547 nm. Extended versus bent S1 conformations estimated to be 1–1.5 nm in difference (A). Calcium induced thin filament structural changes detected by nanocircuit. RET between Cy5-ADP and Cy7-troponin T detects calcium induced changes between S1 and troponin T (B)
Intriguingly, the orientation of the myosin lever arm is significantly impacted by close proximity to the troponin complex. The orientation of the myosin lever arm affects the energy transfer between the terbium chelate on the RLC and CY5 ADP in the nucleotide cleft (Fig. 5A). The efficiency of energy transfer between the terbium chelate and CY5-ADP measured at either 547 nm (terbium) or 690 nm (CY5) is measured by the reduced lifetime relative to the donor without acceptor present. This reduction in lifetime is essentially the same when measured at either 547 nm or 690 nm which indicates that the nucleotide cleft is nearly saturated with CY5-ADP (Fig. 6). These lifetimes represent an average of all myosin S1 in the sample regardless of where they are bound. However, when the lifetime is measured at 780 nm, only myosin S1 bound near the troponin complex will be measured. In this case, the lifetime was noticeably reduced indicating the myosin lever arm was closer to a pre-powerstroke oritentation (Fig. 6). These results indicate the myosin S1 bound near the troponin complex is impeded from extending its lever arm and prefers keeping the lever arm in the more compact pre-powerstroke orientation (Fig. 7).
Fig. 6.

Luminescence decay curves following excitation of CS124 in RLC with last acceptor Cy7-TnT. Measured in a luminescence spectrometer after excitation at 337 nm and estimated by single exponential curve fitting at 547, 690 and 780 nm. Lifetime of the donor changes as read at different emissions to isolate specific conformations of S1 lever arms along the thin filament. At emission 547 nm unbound and bound S1’s detected. At emission 780 nm, only S1’s bound close to troponin T are isolated.
Fig. 7.

Hindrance on lever arm rotation model. Myosins bound proximally to the troponin complex have a lever arm biased towards pre-power stroke state. Scheme based on the atomic model of troponin docking to actoS1 with less steric hindrance when the lever arm of myosin is in the pre-power stroke position.
The lifetime measurements for a variety of measured conditions are summarized in Table 1. The luminescent decays measured at 547 nm in the presence of acceptor could be deconvolved into at least two components that are consistent with a compact pre-powerstroke state and an extended post-powerstroke state. The majority of the signal was consistent with the extended post-powerstroke state and suggests that most of the myosin S1 adopts this extended conformation even in the presence of phosphate analogs. Similarly, efficiencies of energy transfer measured at 780 nm to a final acceptor on tropomyosin also were consistent with this extended conformation. However, there were significantly higher efficiencies of energy transfer measured at 780 nm to a final acceptor on the troponin complex indicating that these myosin S1 had lever arms in a compact pre-powerstroke orientation. These data suggest that myosin S1 bound adjacent to the troponin complex have a different lever arm orientation than myosin S1 bound at other locations along the thin filament.
Table 1.
Fluorescent Nanocircuit Analysis of Lever Arm Position: Comparison of Conformations of Myosins Bound to Thin Filaments Proximate to TnT versus Tropomyosin
| Sample | Nucleotide | Wave-length (nm) | Exponentials in fit | 2nd accept: TroponinT | 2nd accept: Tropomyosin | ||
|---|---|---|---|---|---|---|---|
| E | R(nm) | E | R(nm) | ||||
| Acto-S1+Ca2+ | ADP | 547 | Single | 0.22±0.07 | 6.4±0.4 | 0.19± 0.00 | 6.50±0.01 |
| Acto-S1+Ca2+ | ADP | 547 | Multiplea | 0.46±0.14 | 5.4±0.5 | N/A | N/A |
| Acto-S1+Ca2+ | ADP | 690 | Single | 0.19±0.1 | 6.6±0.6 | --- | --- |
| Acto-S1+Ca2+ | ADP | 780 | Single | 0.40±0.05 | 5.6±0.2 | 0.27±0.03 | 6.02±0.17 |
| Acto-S1+Ca2+ | ADP-BEFx | 547 | Single | 0.16±0.11 | 6.8±0.7 | 0.21±0.00 | 6.37±0.02 |
| Acto-S1+Ca2+ | ADP-BEFx | 547 | Multiplea | 0.61±0.2 | 4.8±0.6 | N/A | N/A |
| Acto-S1+Ca2+ | ADP-AlF4 | 547 | Single | 0.13±0.05 | 7.1±0.4 | 0.15±0.02 | 6.79±0.15 |
| Acto-S1+Ca2+ | ADP-AlF4 | 547 | Multiplea | 0.73±0.2 | 4.2±0.6 | N/A | N/A |
| Acto-S1+Ca2+ | ADP-BEFx | 780 | Single | 0.38±0.17 | 5.6±0.6 | 0.25±0.04 | 6.13±0.19 |
| Acto-S1+Ca2 | ADP-AlF4 | 780 | Single | 0.41±0.09 | 5.5±0.3 | 0.23±0.06 | 6.24±0.34 |
| Acto-S1+EGTA | ADP-BEFx | 547 | Single | 0.12±0.07 | 7.1±0.6 | 0.24±0.01 | 6.20±0.04 |
| Acto-S1+EGTA | ADP-BEFx | 547 | Multiplea | 0.38±0.1 | 5.7±0.1 | N/A | N/A |
| Acto-S1+EGTA | ADP-AlF4 | 547 | Single | 0.12±0.04 | 7.2±0.6 | 0.17±0.01 | 6.62±0.08 |
| Acto-S1+EGTA | ADP-AlF4 | 547 | Multiplea | 0.8±0.1 | 4.1±0.1 | N/A | N/A |
| Acto-S1+EGTA | ADP-BEFx | 780 | Single | 0.37±0.2 | 5.7±0.7 | 0.30±0.07 | 5.89±0.34 |
| Acto-S1+EGTA | ADP-AlF4 | 780 | Single | 0.41±0.16 | 5.5±0.6 | 0.23±0.02 | 6.24±0.12 |
Indicates multiple exponential fits performed by constraining additional components to the fits to both the 547 and 690 decays, so that only the fastest decaying component was extracted. By multiple fitting, the unbound donors signal is discarded and the shorter, fastest component corresponds to the bound molecules only. No multiple fitting was required for the tropomyosin data.
DISCUSSION
Interactions between troponin and myosin have been described in muscle fibers [22] and in vitro assays [21]. Specific structural impacts of these interactions on the myosin conformation require further elucidation. The results presented herein indicate that the “troponin bridge” with myosin can impede the transition from a pre-powerstroke to a post-powerstroke orientation of the lever arm. This effect would facilitate the formation of target zones on the thin filament between the troponin complexes where productive actomyosin interactions could generate force.
Electron microscopy of decorated thin filaments in vitro has often reported a consistent average position of the myosin lever arm. However, the averaging of signals could potentially overlook occasional deviations from the presumed symmetry. Furthermore, the decorated thin filaments are saturated with excess myosin S1 which can restrict the normal range of orientations that the lever arm might otherwise adopt. Efforts to image low densities of myosin bound to actin often result in a much broader range of detected myosin conformations [22].
The measurements with the fluorescent nanocircuit presented herein were performed at low ratios of myosin S1 to actin, so that the possibility of steric clashes between adjacent myosins would be minimized. However, the periodic troponin complexes along the thin filament could potentially interact with any myosin S1 that happened to bind near it. Consequently, asymmetrical myosin binding along the thin filament can readily be detected in these experiments.
The compact and extended orientations of the lever arm were measured on the average bulk myosin S1, myosin bound near troponin complexes, and myosin bound in between the troponin complexes. The compact pre-powerstroke orientation of the lever arm predominated in all conditions when the myosin S1 was bound near the troponin complex. These results suggest that a steric hindrance from the troponin may impede conversion to a post-powerstroke orientation (Fig. 7) as the Root laboratory previously proposed [13].
The fraction of myosin S1 bound near the troponin complex was relatively small in these experiments, since the low efficiency of energy transfer without the second acceptor of the nanocircuit was more similar to that of an extended post-powertroke state. Similarly, there were marked contrasts between the efficiencies of energy transfer between fluorescent nanocircuits terminating at troponins and those terminating on a tropomyosin site in between the troponins.
The physiological significance of the troponin bridge remains to be determined, but there are a number of intriguing speculations. One possibility is that myosin S1 binding near the troponin complex may provide greater leverage toward displacing the troponin-tropomyosin cooperative unit to an activated state. Another possibility is that the number of active crossbridges between thin and thick filaments needs to be limited for maximum efficiency and/or performance of a muscle, perhaps by increasing the fraction of primed myosin heads in the pre-powerstroke state. Alternatively, it may contribute to the maintenance of more uniform sarcomere lengths during contraction-relaxation cycles by limiting the locations that myosin heads can productively form crossbridges.
CONCLUSION
A newly developed spectroscopic nanocircuit successfully detected asymmetric myosin binding along the thin filament that correlates with the position of the troponin complex. Not only did it allow this identification of different conformations of the lever arm, it also exploited the fluorescent nanocircuit relay to identify the conformations of different kinetic steps using phosphate analogs and calcium ions. The skeletal muscle myosin lever arm appears to exist in multiple orientations prior to the association of myosin to actin. Upon initial binding events with actin, pre-power stroke orientations are selected on S1 molecules bound close to the troponin complex do not transition normally to a stable postpowerstroke orientation due to apparent steric hindrance [13]. S1 molecules bound along the thin filament and in between troponin complexes, are driven towards post-power stroke conformations. Future studies will be required to determine the extent to which the troponin bridge’s effect on nucleotide and crossbridge cycle kinetics also play important roles in this process.
Highlights.
A unique fluorescent nanocircuit is constructed to detect the myosin lever arm orientation at different locations along the thin filament.
Myosin subfragment-1 does not bind in the same conformation at different positions along the thin filament.
The results imply that target zones for myosin binding along the thin filament are defined by the position of troponin.
The data provides evidence supporting the occurrence of a troponin bridge with myosin.
Acknowledgments
The authors thank Dr. Zhiling Zhang for help in purification of the troponin and tropomyosin used in this work. This material is based upon work supported by the National Science Foundation under Grant No. 0842736 to DDR and by the American Recovery and Reinvestment Act and by NIH R01AR44737 to DDR.
Footnotes
Publisher's Disclaimer: This is a PDF file of an unedited manuscript that has been accepted for publication. As a service to our customers we are providing this early version of the manuscript. The manuscript will undergo copyediting, typesetting, and review of the resulting proof before it is published in its final citable form. Please note that during the production process errors may be discovered which could affect the content, and all legal disclaimers that apply to the journal pertain.
References
- 1.Reedy MK. Ultrastructure of insect flight muscle. I. Screw sense and structural grouping in the rigor cross-bridge lattice. J Mol Biol. 1968;31:155–76. doi: 10.1016/0022-2836(68)90437-3. [DOI] [PubMed] [Google Scholar]
- 2.Schmitz H, Reedy MC, Reedy MK, Tregear RT, Winkler H, Taylor KA. Electron tomography of insect flight muscle in rigor and AMPPNP at 23 degrees C. J Mol Biol. 1996;264:279–301. doi: 10.1006/jmbi.1996.0641. [DOI] [PubMed] [Google Scholar]
- 3.Tregear RT, Edwards RJ, Irving TC, Poole KJ, Reedy MC, Schmitz H, Towns-Andrews E, Reedy MK. X-ray diffraction indicates that active cross-bridges bind to actin target zones in insect flight muscle. Biophys J. 1998;74:1439–51. doi: 10.1016/S0006-3495(98)77856-7. [DOI] [PMC free article] [PubMed] [Google Scholar]
- 4.Taylor KA, Schmitz H, Reedy MC, Goldman YE, Franzini-Armstrong C, Sasaki H, Tregear RT, Poole K, Lucaveche C, Edwards RJ, Chen LF, Winkler H, Reedy MK. Tomographic 3D reconstruction of quick-frozen, Ca2+-activated contracting insect flight muscle. Cell. 1999;99:421–31. doi: 10.1016/s0092-8674(00)81528-7. [DOI] [PubMed] [Google Scholar]
- 5.Chen LF, Winkler H, Reedy MK, Reedy MC, Taylor KA. Molecular modeling of averaged rigor crossbridges from tomograms of insect flight muscle. J Struct Biol. 2002;138:92–104. doi: 10.1016/s1047-8477(02)00013-8. [DOI] [PubMed] [Google Scholar]
- 6.Tregear RT, Reedy MC, Goldman YE, Taylor KA, Winkler H, Franzini-Armstrong C, Sasaki H, Lucaveche C, Reedy MK. Cross-bridge number, position, and angle in target zones of cryofixed isometrically active insect flight muscle. Biophys J. 2004;86:3009–19. doi: 10.1016/S0006-3495(04)74350-7. [DOI] [PMC free article] [PubMed] [Google Scholar]
- 7.Varriano-Marston E, Franzini-Armstrong C, Haselgrove JC. The structure and disposition of crossbridges in deep-etched fish muscle. J Muscle Res Cell Motil. 1984;5:363–86. doi: 10.1007/BF00818256. [DOI] [PubMed] [Google Scholar]
- 8.Squire JM, Harford JJ. Actin filament organization and myosin head labelling patterns in vertebrate skeletal muscles in the rigor and weak binding states. J Muscle Res Cell Motil. 1988;9:344–58. doi: 10.1007/BF01773878. [DOI] [PubMed] [Google Scholar]
- 9.Hirose K, Wakabayashi T. Structural change of crossbridges of rabbit skeletal muscle during isometric contraction. J Muscle Res Cell Motil. 1993;14:432–45. doi: 10.1007/BF00121295. [DOI] [PubMed] [Google Scholar]
- 10.Lenart TD, Murray JM, Franzini-Armstrong C, Goldman YE. Structure and periodicities of cross-bridges in relaxation, in rigor, and during contractions initiated by photolysis of caged Ca2+ Biophys J. 1996;71:2289–306. doi: 10.1016/S0006-3495(96)79464-X. [DOI] [PMC free article] [PubMed] [Google Scholar]
- 11.Gafurov,YD B, Chalovich JM. Ca2+ and ionic strength dependencies of S1-ADP binding to actin-tropomyosin-troponin: regulatory implications. Biophys J. 2004;87:1825–35. doi: 10.1529/biophysj.104.043364. [DOI] [PMC free article] [PubMed] [Google Scholar]
- 12.Root DD, Wang K. High-affinity actin-binding nebulin fragments influence the actoS1 complex. Biochemistry. 2001;40:1171–86. doi: 10.1021/bi0015010. [DOI] [PubMed] [Google Scholar]
- 13.Patel DA, Root DD. Close proximity of myosin loop 3 to troponin determined by triangulation of resonance energy transfer distance measurements. Biochemistry. 2009;48:357–69. doi: 10.1021/bi801554m. [DOI] [PMC free article] [PubMed] [Google Scholar]
- 14.Rayment I, Rypniewski WR, Schmidt-Bäse K, Smith R, Tomchick DR, Benning MM, Winkelmann DA, Wesenberg G, Holden HM. Three-dimensional structure of myosin subfragment-1: a molecular motor. Science. 1993;261:50–58. doi: 10.1126/science.8316857. [DOI] [PubMed] [Google Scholar]
- 15.Dominguez R, Freyzon Y, Tybus KM, Cohen C. Crystal structure of a vertebrate smooth muscle myosin motor domain and its complex with the essential light chain: visualization of the pre–power stroke state. Cell. 1998;94:559–571. doi: 10.1016/s0092-8674(00)81598-6. [DOI] [PubMed] [Google Scholar]
- 16.Houdusse A, Szent-Györgyi AG, Cohen C. Three conformational states of Scallop Myosin S1. Proc Natl Acad Sci USA. 2000;97:11238–11243. doi: 10.1073/pnas.200376897. [DOI] [PMC free article] [PubMed] [Google Scholar]
- 17.Smyczynski C, Kasprzak AA. Effect on nucleotides and actin on the orientation of the light chain-binding domain in myosin subfragment 1. Biochemistry. 1997;36:13201–13207. doi: 10.1021/bi970746i. [DOI] [PubMed] [Google Scholar]
- 18.Xu J, Root DD. Domain motion between the regulatory light chain and the nucleotide site in skeletal myosin. J Struct Biol. 1998;123:150–161. doi: 10.1006/jsbi.1998.4023. [DOI] [PubMed] [Google Scholar]
- 19.Xiao M, Li H, Snyder GE, Cooke R, Yount RG, Selvin PR. Conformational changes between the active-site and regulatory light chain of myosin as determined by luminescence resonance energy transfer: the effect of nucleotides and actin. Proc Natl Acad Sci USA. 1998;95:15309–14. doi: 10.1073/pnas.95.26.15309. [DOI] [PMC free article] [PubMed] [Google Scholar]
- 20.Xu J, Root DD. Conformational selection during weak binding at the actin and myosin interface. Biophys J. 2000;79:1498–1510. doi: 10.1016/S0006-3495(00)76401-0. [DOI] [PMC free article] [PubMed] [Google Scholar]
- 21.Schoffstall B, LaBarbera VA, Brunet NM, Gavino BJ, Herring L, Heshmati S, Kraft BH, Inchausti V, Meyer NL, Moonoo D, Takeda AK, Chase PB. Interaction between troponin and myosin enhances contractile activity of myosin in cardiac muscle. DNA Cell Biol. 2011;30:653–9. doi: 10.1089/dna.2010.1163. [DOI] [PMC free article] [PubMed] [Google Scholar]
- 22.Wu S, Liu J, Reedy MC, Perz-Edwards RJ, Tregear RT, Winkler H, Franzini-Armstrong C, Sasaki H, Lucaveche C, Goldman YE, Reedy MK, Taylor KA. Structural changes in isometrically contracting insect flight muscle trapped following a mechanical perturbation. PLoS One. 2012;7:e39422. doi: 10.1371/journal.pone.0039422. [DOI] [PMC free article] [PubMed] [Google Scholar]
- 23.Cummins P, Perry SV. Subunit structure and biological activity of tropomyosin B from different muscle types. Biochem J. 1972;128:106P–107P. doi: 10.1042/bj1280106pb. [DOI] [PMC free article] [PubMed] [Google Scholar]
- 24.Wagner PD. Preparation and fractionation of myosin light chains and exchange of the essential light chains. Methods Enzymol. 1982;85:72–81. doi: 10.1016/0076-6879(82)85010-6. [DOI] [PubMed] [Google Scholar]
- 25.Colowick S, Kaplan N. Structural and Contractile Proteins. The contractile apparatus and the cytoskeleton. Methods Enzymol. 1982;85:234–259. [PubMed] [Google Scholar]
- 26.Jin JP, Root DD. Modulation of troponin T molecular conformation and flexibility by metal ion binding to the NH2-terminal variable region. Biochemistry. 2000;39:11702–11713. doi: 10.1021/bi9927437. [DOI] [PubMed] [Google Scholar]
- 27.Zhang Z, Jin JP, Root DD. Binding of calcium ions to an avian flight muscle troponin T. Biochemistry. 2004;43:2645–2655. doi: 10.1021/bi035067o. [DOI] [PubMed] [Google Scholar]
- 28.Takeda S, Yamashita A, Maéda K, Maéda Y. Structure of the core domain of human cardiac troponin in the Ca(2+)-saturated form. Nature. 2003;424:35–41. doi: 10.1038/nature01780. [DOI] [PubMed] [Google Scholar]
- 29.Vinogradova MV, Stone DB, Malanina GG, Karatzaferi C, Cooke R, Mendelson RA, Fletterick RJ. Ca(2+)-regulated structural changes in troponin. Proc Natl Acad Sci USA. 2005;102:5038–43. doi: 10.1073/pnas.0408882102. [DOI] [PMC free article] [PubMed] [Google Scholar]
- 30.Whitby FG, Phillips GN., Jr Crystal structure of tropomyosin at 7 Angstroms resolution. Proteins. 2000;38:49–59. [PubMed] [Google Scholar]