

Abstract
Microarrays have made it possible to perform high-throughput, genome-wide analyses of RNA expression from an extremely wide range of sources. This technology relies on the ability to obtain RNA of sufficient quantity and quality for this type of application. While there are means to circumvent limitations in the former, recovery of RNA suitable for microarray analysis still represents a major issue when working with some biological samples, particularly those treated with and preserved in nucleic acid-modifying organic reagents. In the present report we describe a procedure for the isolation of RNA suitable for microarray analysis from cells purified by fluorescence-activated cell sorting after fixation, permeabilization and intracellular staining with fluorochrome-conjugated antibodies. We show that – although the RNA isolated from these samples presented some degradation – it performed remarkably well in microarray analysis. The method we describe here makes it available to genome-wide expression profiling a variety of biological samples that so far were confined to single-gene analysis.
Keywords: RNA, microarray, fixation, permeabilization, intracellular staining, FACS
1. Introduction
Transcriptomics examines the expression levels of messenger RNA (mRNA) in a given cell population, using high-throughput techniques based on DNA microarray technology. The combination of transcriptomics and computational analysis has significantly advanced our knowledge of the processes governing the function of many cells, tissues and organisms in health and disease. The recent completion of several mammalian genome sequences provides the foundation to decoding the way in which genomes are translated into the functions of living organisms. The key intermediate is the transcriptome, which consists of all the individual RNA molecules (transcripts) produced by the cells. Recently, the analysis of >20 million sequences has led to a comprehensive and detailed view of the mouse transcriptome (Schena et al., 1995). At the same time, the advent of microarrays made it possible to measure the RNA expression of thousands of genes in parallel and in a single assay (Lockhart et al., 1996; Shoemaker et al., 2001) allowing a refined high-throughput mapping of the transcriptional activity of a given genome (Bertone et al., 2004; Carninci et al., 2005).
The success of microarray analysis is predicated on several factors. Fragmentation and chemical modifications influence the overall quality of the RNA sample, as well as its template activity. RNA fragmentation is a function of time and temperature of sample storage. Unless properly inhibited, nearly ubiquitous RNase enzymes digest RNA molecules into shorter fragments that might compromise downstream applications (Auer et al., 2003). In the past, RNA integrity was evaluated using agarose gel electrophoresis stained with ethidium bromide, which typically produces two major bands comprising the 28S and 18S ribosomal RNA (rRNA) species (Sambrook et al., 1989). A ratio of 28S/18S ≥2.0 indicates RNA of high quality. However, this method is highly subjective and data cannot be processed digitally. The introduction of the bioanalyzer a decade ago by Agilent Technologies has allowed the separation of nucleic acid and protein samples under fully automated, digitized and reproducible conditions. This instrument employs microfluidics technology to perform eletrophoretic separations of tiny amounts of RNA samples in the channels of microfabricated chips according to their size and then detected by laser-induced fluorescence. Moreover, digitized information deriving from a large collection of RNA sample profiles recorded with an Agilent bioanalyzer was employed to extract an algorithm that describes RNA integrity in a user-independent, automated and reliable manner that allows the calculation of an RNA integrity number (RIN) (Schroeder et al., 2006). This value classifies RNA based on a numbering system from 1 to 10, with 1 being the most degraded and 10 being the most intact. Although the RIN cannot predict whether a given sample will work in any given assay, in general samples with RINs greater that 7-8 are expected to perform well in most applications, while samples with RINs below 7 require extra validation studies.
The presence and the extent of chemical modifications also contribute to the overall quality of the RNA sample. Nucleic acid-modifying organic agents (such as formaldehyde) routinely used to preserve biological specimens introduce mono-methylol groups (CH2OH) in all four bases at rates varying from 4% to 40% (Masuda et al., 1999). In addition, some adenine residues undergo dimerization through methylene bridging (Masuda et al., 1999). The extent of chemical modifications is dependent on the length of time in the presence of formaldehyde (Masuda et al., 1999; Chung et al., 2008). A number of studies have successfully carried out microarray studies using RNA recovered from formalin-fixed, paraffin-embedded samples (Li et al., 2006; Haque et al., 2007; Linton et al., 2008; Conway et al., 2009; Budczies et al., 2011; Xie et al., 2011).
An additional factor playing a role in the success of microarray analysis is the purity of the cellular source of RNA to be analyzed. Although this is not an issue when working with established cell lines, it is particularly relevant when working with primary specimens. Fluorescence activated cell sorting (FACS) allows to enrich to near homogeneity a specific cell type from a mixed population based. The differential expression of one or more biomarkers (for which specific monoclonal antibodies are available) can be exploited to discern the cell type of interest from all others, and to isolate it at purities often >95-99%. On the other hand, the recovery of high quality RNA from FACS-purified cells poses some challenges. Indeed, the RNA can be partially degraded due to mechanical damage as well as to inefficient inactivation of RNases during cell sorting (Diez et al., 1999). Moreover, the use of fixative agents (such as formaldehyde) introduces chemical modifications that affect RNA performance in cDNA synthesis (Diez et al., 1999).
Here, we have taken an important and significant step further, and we report a method for the recovery of microarray-quality RNA from primary human cells purified to near homogeneity after fixation, permeabilization, intracellular staining with fluorochrome-conjugated antibodies, and FACS sorting. This method expands the application of microarray analysis to cells isolated from mixed populations (oligo- and polyclonal cell lines, cultured primary cells, clinical specimens) based upon differential expression of intracellular markers.
2. Materials and Methods
2.1 Generation of latently infected cells
Fore the studies described below we used cells from 4 different HIV-1 negative, healthy volunteers (4 biological replicates). The specimens used for this study were unmarked and could not be identified directly or through identifiers linked to the subjects, by any investigator on this study. As such, the Office of Research Subjects IRB at the University of Maryland, Baltimore has determined that studies involving these samples do not qualify as Human Subject Research, and do not require IRB approval. CD4+ T cells latently infected with HIV-1 were generated essentially as described previously (Marini et al., 2008), with some modifications. Briefly, PBMCs were isolated from peripheral blood of healthy volunteers by Ficoll-Paque PLUS (GE Healthcare). Total CD4+ T cells were enriched by negative selection (CD4+ T Cell Isolation Kit from Miltenyi Biotec), and activated in plates coated with anti-CD3 (eBioscience) and anti-CD28 (Beckman Coulter) in the presence of 50 U/ml IL-2 (Roche Biochemicals). Activated cells were infected 3 days post-activation with 5×10³ 50% tissue culture infective dose (TCID50) per 106 cells of gradient-purified HIV-1IIIB (Advanced Biotechnologies Inc.) for 2 h at 37°C. Finally, cells were plated at 0.5×10⁶ cells/ml in fresh RPMI 1640 supplemented with 1% penicillin/streptomycin, 1% glutamine, 1% nonessential amino acids, 1% sodium pyruvate, 50 μM 2- mercaptoethanol (all from Invitrogen), 50 μg/ml gentamicin (Sigma), 10% human AB serum (Cellgro), 50 U/ml IL-2, and cultured until 10-15% cells were infected. Cells were then allowed to rest for a week in the presence of 1 ng/ml IL-7 (R&D Systems).
2.2 Immunostaining and cell sorting
All the steps described below were carried out with RNase-free buffers and reagents. Cells were washed with PBS, fixed in 1% paraformaldehyde (PFA, Sigma-Aldrich) in PBS at 4°C for 20 minutes, permeabilized with 0.1% saponin (Sigma-Aldrich) for 5 minutes at 4°C, stained for the detection of intracellular HIV-1 p24gag with FITC-labeled KC57 antibody (Beckman Coulter) for 20 minutes on ice, and finally washed twice with ice-cold PBS. Latently infected (HIV-1 p24+) and uninfected cells (HIV-1 p24−) from the same culture were then sorted on a fee-for-service at the Flow Cytometry Core Facility of the Johns Hopkins Bloomberg School of Public Health (Dr. Hao Zhang, Core Director) with a DAKO-Cytomation MoFlo High Speed cell sorter.
2.3 Total RNA isolation
Total RNA was isolated from sorted cells using the RNeasy FFPE Kit (Qiagen) following manufacturer’s protocol with a few modifications. The treatment with xylene and the subsequent ethanol precipitation step were omitted. The incubation steps at 55°C, and at 80°C were shortened (12 minutes instead of 15) to reduce RNA degradation. RNA was eluted from the column with RNase-free water, quantified by NanoDrop, and stored at -80°C. RNA quality was confirmed by UV spectrophotometry and by analysis with an Agilent 2100 Bioanalyzer.
2.4 Microarray
Microarray analyses were performed on a fee-for-service at the Microarray Core Facility of the Johns Hopkins Sidney Kimmel Comprehensive Cancer Center (Dr. Wayne Yu, Core Director), using the Agilent microarray platform. Sample amplification and labeling procedures were carried out by using Low RNA Input Fluorescent Linear Amplification Kit (Agilent Technologies). Briefly, 400 nanograms of total RNA were reverse-transcribed into first strand and second strand cDNA by MMLV-RT using the Full Spectrum™ MultiStart Primers (System Bioscience) for T7 IVT, which are a mixture of non-degenerate primers and oligo-dT primer – all with T7 promoters attached – that initiate first strand cDNA synthesis at multiple points along the mRNA as well as from the poly A tail. The cDNA is then used as a template for in vitro transcription in the presence of T7 RNA polymerase and Cyanine labeled CTPs. Paired RNA samples from p24+ and p24− cells were labeled using a two-color design with dye-swap control. Thus, paired RNA samples from p24+ cells and p24− cells of two donors were labeled with Cy3 and Cy5, respectively; whereas, paired RNA samples from p24+ cells and p24− cells of the other two donors were labeled with Cy5 and Cy3, respectively. The labeled cRNA was purified using RNeasy Mini Kit (Qiagen). RNA spike-in controls (Agilent Technologies) were added to RNA samples before amplification and labeling according to manufacturer’s protocol. 825 nanograms of samples labeled with Cy3 or Cy5 were mixed with control targets (Agilent Technologies). Fragmentation was carried out by incubating at 60°C for 30 minutes, and stopped by adding an equal volume of 2× GE Hi-RPM hybridization buffer (Agilent Technologies). Samples were denatured at 95°C before hybridizing to arrays. Agilent whole human genome microarrays (G4112F) were used, which contain 41,000 unique probes for transcripts. Hybridization was carried out at 60°C for 17 hours in a hybridization oven with rotation. Hybridized microarrays were washed and dried according to the Agilent microarray processing protocol. Microarrays were scanned using an Agilent G2505B Scanner controlled by Agilent Scan Control 7.0 software. Data were extracted with Agilent Feature Extraction software. Raw expression data, along with the Minimum Information About a Microarray Experiment (MIAME) required information, were deposited to the GEO database under the accession number GSE40550.
2.5 Reverse transcriptase quantitative PCR (RT-QPCR) validation
cDNA was generated using the high capacity RNA to cDNA Kit (Applied Biosystems). QPCRs were performed in triplicate on a BioRad IQ5 using Taqman gene expression assays (Applied Biosystems), following manufacturer instructions. Expression levels were compared to MED19, since it did not show differential expression in the microarray.
2.6 Microarray quality assessment
The impact of RNA quality – as measured by RIN, OD readings, and 28S/18S ratio – on the microarray hybridization quality, was analyzed with standard diagnostic plots, including intensity distribution plots, foreground-to-background plots, MA-plots, and 2D-intensity plots. Moreover, the effect of any RNA quality parameter, dichotomized using the median value, on the measures of microarray hybridizations quality – such as the observed dynamic range, median and mean foreground and background intensities, and overall intensity variance – was also evaluated using both parametric and non-parametric approaches (two-sided Student’s t-test and the Wilcoxon rank-sum test). Finally the presence of RNA degradation was investigated by systematically comparing hybridization signal intensities between probes aligning to distinct portions of each transcript analyzed by the Agilent platform. To this end, we first assembled the microarray features genomic locations (available from the eArray Agilent website https://earray.chem.agilent.com/earray/) with the genomic location of the NCBI Entrez Genes (available from the GoldenPath database UCSC Genome Browser http://genome.ucsc.edu/) using the NCBI human genome build 37.1. Then we selected the genes for which multiple probes were available, computing the within-gene differential expression between 5′-end and 3′-end probes. Therefore we used the Student’s t-test and the Wilcoxon rank-sum test to investigate systematic association between within-gene differential expression for 5′-end vs. 3′-end probes and RNA quality parameters. In addition we used a linear regression approach to investigate the 5′-end to 3′-end inter-probe distance.
3. Results and Discussion
We have established an in vitro model to generate primary human CD4+ T cells latently infected with HIV-1 (Marini et al., 2008). Our model yields a cell culture containing quiescent cells, both latently infected and uninfected. In order to gain a deeper understanding of the basic biology of HIV-1 latency, we sought to perform whole-genome expression profiling of latently infected CD4+ T cells in comparison to their uninfected counterparts. Currently, there are no known cellular biomarkers that are differentially expressed in latently infected versus uninfected cells, which could be used to purify these two cell types from the same culture. However, in the course of our studies we discovered that a viral antigen – the capsid protein, p24gag, which is expressed during the phase of productive viral infection – persisted in the cytoplasm of quiescent infected cells for several days during the latency phase (Marini et al., 2008). Therefore, we chose to isolate latently infected and uninfected cells from the same culture by fluorescence activated cell sorting (FACS) based on the presence of intracellular p24gag.
This approach presented a number of technical challenges in terms of our ability to recover RNA suitable for microarray analysis. RNA fragmentation may occur during and following cell permeabilization. Although the cells are subjected to fixation with PFA prior to permeabilization, RNases present in the staining and wash buffers may gain access into the cells and degrade the RNA. Therefore, all the steps leading to cell sorting – including fixation, permeabilization, antibody staining and all washing steps – were carried out with RNase-free buffers and reagents. Moreover, we washed extensively the FACS instrument with RNase-free water to further reduce the risk of RNA degradation during cell sorting. An additional cause of RNA fragmentation is the cell sorting process itself. Indeed, it is worth remembering that after fixation, permeabilization, immunostaining, and several washing steps, the cells are then subjected to pressures of ~60 psi, rapid acceleration to 20 m/sec, expulsion through a small orifice, sudden return to atmospheric pressure, irradiation with laser beams, charging to few hundreds volts, passing through an electric field of several Kilovolts/cm, and finally hitting a liquid surface while still traveling at 20 m/sec. The cell sorter we used can sort cells at rates as high as 50,000 events/second, but in order to minimize the considerable physical and mechanical stress that sorting exerts on cells and RNA, we used rates ≤10,000 events/sec. Figure 1 shows FACS analysis of latently infected and uninfected cells after intracellular staining with FITC-labeled anti-p24gag KC57 antibody. The left two panels show the total, unseparated culture; the next two pairs of panels show uninfected and infected cells, respectively, obtained after cell sorting. Finally the rightmost plots show an overlay of the sorted populations.
Figure 1.

Purification of HIV-1 infected and uninfected cells by fluorescence activated cell sorting after fixation, permeabilization and intracellular staining with FITC-labeled anti-HIV-1 p24gag antibodies (clone KC57). The left two panels show a bivariate density plot and a histogram plot of cells stained with 7AAD and anti-HIV-1 p24gag antibodies. The rectangles within the density plot show the gates chosen for the sorting of HIV-1 infected and uninfected cells. The subsequent two pairs of panels show histogram and density plots of HIV-1 uninfected and infected cells, respectively, analyzed immediately after sorting. The rightmost plots show an overlay of the two populations obtained by cell sorting. 7AAD, 7-actinomycin D; SSC-H, side scatter light-height.
As discussed above, cell fixation in paraformaldehyde introduces chemical modifications in the RNA molecule, which interfere with its performance in downstream applications. The extent to which these modifications are introduced is time-dependent. We used a 20-minute incubation in PFA to fix the cells, which was long enough to preserve the cell structure and morphology upon permeabilization, but short enough to minimize chemical modifications of the RNA. Nevertheless, it is critical to implement steps that remove crosslinking and revert chemical modifications in the RNA. Therefore, for extraction of total RNA from the two cell samples, we used the Qiagen RNeasy FFPE Kit. We modified the protocol by skipping the treatment with xylene, which is only necessary to remove paraffin. The treatment with Proteinase K frees the RNA from crosslinked proteins. In addition, the subsequent incubation at 80°C removes CH2OH groups from bases, thus restoring the template activity of RNA (Masuda et al., 1999). However, in order to reduce RNA degradation, we shortened these two incubations from 15 to 12 minutes each.
We have determined four pre-chip quality measures (A260/A280, A260/A230, 28S/18S, and RIN) for all eight RNA samples used in this study (Table 1). Although the A260/A280 and A260/A230 ratios suggest that there was not any major contamination with proteins or organic solvents, both the 28S/18S ratios and the RIN values suggested that the RNA samples were partially degraded. Indeed, as shown in Figure 2, all samples presented some degree of degradation. However, a previous study reported that the 28S/18S ratio represents a very poor predictor of RNA performance in microarray experiments (Schoor et al., 2003). Moreover, even though the RIN value has been shown to be a more reliable parameter (Kiewe et al., 2009; Raman et al., 2009), a recent study by Fedorowicz et al. comparing gene expression profiles from matched FFPE and frozen tissue using the Agilent platform demonstrated that RIN is not associated with poor microarray performance (Fedorowicz et al., 2009). Therefore, these RNA samples were subsequently used to carry out microarray analyses using the Agilent platform. To allow dual-color competitive hybridization, paired RNA samples from infected and uninfected cells were labeled with Cy3 and Cy5. Moreover, to control for the dye bias in our experiments, we implemented a dye swap protocol (reciprocal labeling) for paired RNA samples from 2 donors, as described in Materials and Methods. Complete results from this comparative host gene expression profiling can be found in the public Gene Expression Omnibus (GEO) database under the accession number GSE40550.
Table 1.
RNA quality measures
| Sample Name | A260/A280 | A260/A230 | 28S/18S | RIN |
|---|---|---|---|---|
| #3-POS | 2.01 | 1.70 | 1.7 | 6.0 |
| #3-NEG | 2.06 | 2.20 | 2.2 | 6.6 |
| #111-POS | 2.04 | 1.90 | 1.9 | 4.0 |
| #111-NEG | 2.10 | 1.60 | 1.6 | 4.0 |
| #112-NEG | 1.98 | 1.60 | 1.6 | 5.8 |
| #112-POS | 2.02 | 1.30 | 1.3 | 5.0 |
| #113-NEG | 2.08 | 2.00 | 2.0 | 4.0 |
| #113-POS | 2.07 | 1.90 | 1.9 | 4.0 |
POS = HIV-1 positive cells; NEG = HIV-1 negative cells; #3 = cells from donor #3; #111 = cells from donor #111; #112 = cells from donor #112; #113 = cells from donor #113; POS = RNA from HIV-1 infected cells; NEG = RNA from uninfected cells; A2n0 = absorbance of the RNA sample at 2n0 nm; 28S/18S = ratio between 28S rRNA and 18S rRNA; RIN = RNA integrity number.
Figure 2.
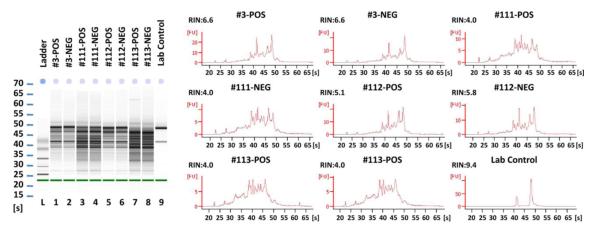
Bioanalyzer traces of RNA samples extracted from sorted HIV-1 positive and negative cells from four donors. The traces are shown both as gel files and as histograms. The RNA samples show various degrees of degradation compared to the RNA control used a standard.
To validate the results obtained in the microarray analysis, we analyzed expression levels of 35 genes by reverse transcriptase real time PCR (RT-QPCR) using RNA samples from infected and uninfected cells from two of the four donors included in the microarray analysis. As shown in Figure 3, normalized differential expression of 20 up-regulated and 15 down-regulated genes showed a significant correlation between the two platforms.
Figure 3.
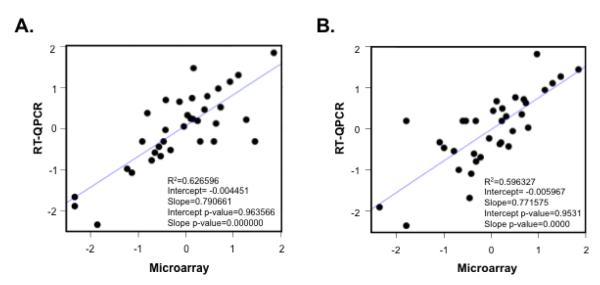
Scatter plot showing the linear correlation between RT-QPCR (y-axis) and microarray (x-axis) analyses of normalized differential expression for 35 genes in HIV-1 positive and negative cells from two distinct donors (p112 and p113, panel A and B respectively). The R-squared, intercept and slope, and the relative p-values from linear regression models are reported inside each panel.
After using the four pairs of RNA samples in microarray analyses with the Agilent platform, we also performed several post-chip diagnostic analyses (distribution plots, foreground-to-background plots, MA-plots, and 2D-intensity plots), which failed to reveal any artifactual results (data not shown). Moreover, we performed t-test and Wilcoxon rank-sum test to evaluate whether the gene expression range, variance, mean, median and other expression quantiles (.05, .25, .75, .95) were statistically different between RNA samples stratified by distinct levels of RIN, 28S/18S, A260/A280 and A260/A230 (using the median as dichotomization threshold). This systematical analysis failed to demonstrate any significant association between standard RNA quality parameters and global microarray quality measures (data not shown). These results are in line with those published previously (Fedorowicz et al., 2009). Finally, our analyses failed to identify any statistically significant association between the within-gene differential expression of 5′-end vs. 3′-end probes and RNA quality or the inter-probe distance (Figure 4).
Figure 4.

Within-gene differential expression of 5′-end vs. 3′-end probes. Panel A: Distribution of the log2 fold-change between 5′-end and 3′-end probes aligning to the same gene for all RNA samples that were analyzed. Panel B: Distribution of the log2 absolute distance between 5′-end and 3′-end probe aligning to the same gene for all RNA samples that were analyzed. Panel C: Box-plots showing the comparable within-gene log2 fold-change between 5′-end and 3′-end probe across the individual samples that were analyzed. Panel D: Smoothed scatter-plots showing the lack of correlation between inter-probe distance and within-gene log2 fold-change for each analyzed sample. The red lines correspond to the linear regression fitted line, while the shades of blue represent points’ density.
In the present study we showed that RNA extracted from cells obtained after fixation, permeabilization, intracellular immunostaining, and FACS sorting presented variable degrees of degradation as assessed by RIN values ranging from 4.0 to 6.6. In particular, the possible presence of residual RNA modifications due to fixation of the cell samples with paraformaldehyde represented a concern. Nevertheless, all our RNA samples performed equally well in microarray analysis with the Agilent platform. The use of a random priming plus oligo-dT priming strategy to generate cDNA from our RNA samples allowed us to circumvent issues associated with RNA fragmentation and modification, which might have arisen with a simple oligo-dT priming strategy. Therefore, the method described in this report extends the use of microarray analysis to a new set of biological samples previously precluded from this type of investigation.
In conclusion, we developed a method to recover total RNA from human primary cells purified by FACS following fixation, permeabilization and intracellular antibody staining. The RNA isolated from these cells showed some degree of degradation, but was suitable for transcriptome analysis. Therefore, this method allows the extension of gene expression profiling to a wide variety of biological and clinical specimens that until now were limited to single-gene analysis.
We describe a method to isolate microarray-quality RNA from cells purified by FACS
Cells were sorted after fixation, permeabilization and intracellular antibody staining
Despite some degradation, recovered RNA performed remarkably well in microarray
It allows gene expression profiling of samples so far limited to single-gene study
Acknowledgements
This work was supported by National Institutes of Health grant AI084711 and by Bill & Melinda Gates Foundation Grand Challenges Explorations grant OPP1035926 (F.R.). L.M. was also supported by NIH-NCI grant P30CA006973. This paper is subject to the NIH Public Access Policy.
Footnotes
Publisher's Disclaimer: This is a PDF file of an unedited manuscript that has been accepted for publication. As a service to our customers we are providing this early version of the manuscript. The manuscript will undergo copyediting, typesetting, and review of the resulting proof before it is published in its final citable form. Please note that during the production process errors may be discovered which could affect the content, and all legal disclaimers that apply to the journal pertain.
Competing Interests The authors declare no competing interests.
References
- Auer H, Lyianarachchi S, Newsom D, Klisovic MI, Marcucci G, Kornacker K. Chipping away at the chip bias: RNA degradation in microarray analysis. Nat Genet. 2003;35:292–3. doi: 10.1038/ng1203-292. [DOI] [PubMed] [Google Scholar]
- Bertone P, Stolc V, Royce TE, Rozowsky JS, Urban AE, Zhu X, Rinn JL, Tongprasit W, Samanta M, Weissman S, Gerstein M, Snyder M. Global identification of human transcribed sequences with genome tiling arrays. Science. 2004;306:2242–6. doi: 10.1126/science.1103388. [DOI] [PubMed] [Google Scholar]
- Budczies J, Weichert W, Noske A, Muller BM, Weller C, Wittenberger T, Hofmann HP, Dietel M, Denkert C, Gekeler V. Genome-wide gene expression profiling of formalin-fixed paraffin-embedded breast cancer core biopsies using microarrays. J Histochem Cytochem. 2011;59:146–57. doi: 10.1369/jhc.2010.956607. [DOI] [PMC free article] [PubMed] [Google Scholar]
- Carninci P, Kasukawa T, Katayama S, Gough J, Frith MC, Maeda N, Oyama R, Ravasi T, Lenhard B, Wells C, Kodzius R, Shimokawa K, Bajic VB, Brenner SE, Batalov S, Forrest AR, Zavolan M, Davis MJ, Wilming LG, Aidinis V, Allen JE, Ambesi-Impiombato A, Apweiler R, Aturaliya RN, Bailey TL, Bansal M, Baxter L, Beisel KW, Bersano T, Bono H, Chalk AM, Chiu KP, Choudhary V, Christoffels A, Clutterbuck DR, Crowe ML, Dalla E, Dalrymple BP, de Bono B, Della Gatta G, di Bernardo D, Down T, Engstrom P, Fagiolini M, Faulkner G, Fletcher CF, Fukushima T, Furuno M, Futaki S, Gariboldi M, Georgii-Hemming P, Gingeras TR, Gojobori T, Green RE, Gustincich S, Harbers M, Hayashi Y, Hensch TK, Hirokawa N, Hill D, Huminiecki L, Iacono M, Ikeo K, Iwama A, Ishikawa T, Jakt M, Kanapin A, Katoh M, Kawasawa Y, Kelso J, Kitamura H, Kitano H, Kollias G, Krishnan SP, Kruger A, Kummerfeld SK, Kurochkin IV, Lareau LF, Lazarevic D, Lipovich L, Liu J, Liuni S, McWilliam S, Madan Babu M, Madera M, Marchionni L, Matsuda H, Matsuzawa S, Miki H, Mignone F, Miyake S, Morris K, Mottagui-Tabar S, Mulder N, Nakano N, Nakauchi H, Ng P, Nilsson R, Nishiguchi S, Nishikawa S, et al. The transcriptional landscape of the mammalian genome. Science. 2005;309:1559–63. doi: 10.1126/science.1112014. [DOI] [PubMed] [Google Scholar]
- Chung JY, Braunschweig T, Williams R, Guerrero N, Hoffmann KM, Kwon M, Song YK, Libutti SK, Hewitt SM. Factors in tissue handling and processing that impact RNA obtained from formalin-fixed, paraffin-embedded tissue. J Histochem Cytochem. 2008;56:1033–42. doi: 10.1369/jhc.2008.951863. [DOI] [PMC free article] [PubMed] [Google Scholar]
- Conway C, Mitra A, Jewell R, Randerson-Moor J, Lobo S, Nsengimana J, Edward S, Sanders DS, Cook M, Powell B, Boon A, Elliott F, de Kort F, Knowles MA, Bishop DT, Newton-Bishop J. Gene expression profiling of paraffin-embedded primary melanoma using the DASL assay identifies increased osteopontin expression as predictive of reduced relapse-free survival. Clin Cancer Res. 2009;15:6939–46. doi: 10.1158/1078-0432.CCR-09-1631. [DOI] [PMC free article] [PubMed] [Google Scholar]
- Diez C, Bertsch G, Simm A. Isolation of full-size mRNA from cells sorted by flow cytometry. J Biochem Biophys Methods. 1999;40:69–80. doi: 10.1016/s0165-022x(99)00020-2. [DOI] [PubMed] [Google Scholar]
- Fedorowicz G, Guerrero S, Wu TD, Modrusan Z. Microarray analysis of RNA extracted from formalin-fixed, paraffin-embedded and matched fresh-frozen ovarian adenocarcinomas. BMC Med Genomics. 2009;2:23. doi: 10.1186/1755-8794-2-23. [DOI] [PMC free article] [PubMed] [Google Scholar]
- Haque T, Faury D, Albrecht S, Lopez-Aguilar E, Hauser P, Garami M, Hanzely Z, Bognar L, Del Maestro RF, Atkinson J, Nantel A, Jabado N. Gene expression profiling from formalin-fixed paraffin-embedded tumors of pediatric glioblastoma. Clin Cancer Res. 2007;13:6284–92. doi: 10.1158/1078-0432.CCR-07-0525. [DOI] [PubMed] [Google Scholar]
- Kiewe P, Gueller S, Komor M, Stroux A, Thiel E, Hofmann WK. Prediction of qualitative outcome of oligonucleotide microarray hybridization by measurement of RNA integrity using the 2100 Bioanalyzer capillary electrophoresis system. Ann Hematol. 2009;88:1177–83. doi: 10.1007/s00277-009-0751-5. [DOI] [PubMed] [Google Scholar]
- Li HR, Wang-Rodriguez J, Nair TM, Yeakley JM, Kwon YS, Bibikova M, Zheng C, Zhou L, Zhang K, Downs T, Fu XD, Fan JB. Two-dimensional transcriptome profiling: identification of messenger RNA isoform signatures in prostate cancer from archived paraffin-embedded cancer specimens. Cancer Res. 2006;66:4079–88. doi: 10.1158/0008-5472.CAN-05-4264. [DOI] [PubMed] [Google Scholar]
- Linton KM, Hey Y, Saunders E, Jeziorska M, Denton J, Wilson CL, Swindell R, Dibben S, Miller CJ, Pepper SD, Radford JA, Freemont AJ. Acquisition of biologically relevant gene expression data by Affymetrix microarray analysis of archival formalin-fixed paraffin-embedded tumours. Br J Cancer. 2008;98:1403–14. doi: 10.1038/sj.bjc.6604316. [DOI] [PMC free article] [PubMed] [Google Scholar]
- Lockhart DJ, Dong H, Byrne MC, Follettie MT, Gallo MV, Chee MS, Mittmann M, Wang C, Kobayashi M, Horton H, Brown EL. Expression monitoring by hybridization to high-density oligonucleotide arrays. Nat Biotechnol. 1996;14:1675–80. doi: 10.1038/nbt1296-1675. [DOI] [PubMed] [Google Scholar]
- Marini A, Harper JM, Romerio F. An in vitro system to model the establishment and reactivation of HIV-1 latency. J Immunol. 2008;181:7713–20. doi: 10.4049/jimmunol.181.11.7713. [DOI] [PubMed] [Google Scholar]
- Masuda N, Ohnishi T, Kawamoto S, Monden M, Okubo K. Analysis of chemical modification of RNA from formalin-fixed samples and optimization of molecular biology applications for such samples. Nucleic Acids Res. 1999;27:4436–43. doi: 10.1093/nar/27.22.4436. [DOI] [PMC free article] [PubMed] [Google Scholar]
- Raman T, O’Connor TP, Hackett NR, Wang W, Harvey BG, Attiyeh MA, Dang DT, Teater M, Crystal RG. Quality control in microarray assessment of gene expression in human airway epithelium. BMC Genomics. 2009;10:493. doi: 10.1186/1471-2164-10-493. [DOI] [PMC free article] [PubMed] [Google Scholar]
- Sambrook J, Fritsch EF, Maniatis T. Molecular cloning : a laboratory manual. Cold Spring Harbor Laboratory Press; Cold Spring Harbor, N.Y.: 1989. [Google Scholar]
- Schena M, Shalon D, Davis RW, Brown PO. Quantitative monitoring of gene expression patterns with a complementary DNA microarray. Science. 1995;270:467–70. doi: 10.1126/science.270.5235.467. [DOI] [PubMed] [Google Scholar]
- Schoor O, Weinschenk T, Hennenlotter J, Corvin S, Stenzl A, Rammensee HG, Stevanovic S. Moderate degradation does not preclude microarray analysis of small amounts of RNA. Biotechniques. 2003;35:1192–6. 1198–201. doi: 10.2144/03356rr01. [DOI] [PubMed] [Google Scholar]
- Schroeder A, Mueller O, Stocker S, Salowsky R, Leiber M, Gassmann M, Lightfoot S, Menzel W, Granzow M, Ragg T. The RIN: an RNA integrity number for assigning integrity values to RNA measurements. BMC Mol Biol. 2006;7:3. doi: 10.1186/1471-2199-7-3. [DOI] [PMC free article] [PubMed] [Google Scholar]
- Shoemaker DD, Schadt EE, Armour CD, He YD, Garrett-Engele P, McDonagh PD, Loerch PM, Leonardson A, Lum PY, Cavet G, Wu LF, Altschuler SJ, Edwards S, King J, Tsang JS, Schimmack G, Schelter JM, Koch J, Ziman M, Marton MJ, Li B, Cundiff P, Ward T, Castle J, Krolewski M, Meyer MR, Mao M, Burchard J, Kidd MJ, Dai H, Phillips JW, Linsley PS, Stoughton R, Scherer S, Boguski MS. Experimental annotation of the human genome using microarray technology. Nature. 2001;409:922–7. doi: 10.1038/35057141. [DOI] [PubMed] [Google Scholar]
- Xie Y, Xiao G, Coombes KR, Behrens C, Solis LM, Raso G, Girard L, Erickson HS, Roth J, Heymach JV, Moran C, Danenberg K, Minna JD, Wistuba II. Robust gene expression signature from formalin-fixed paraffin-embedded samples predicts prognosis of non-small-cell lung cancer patients. Clin Cancer Res. 2011;17:5705–14. doi: 10.1158/1078-0432.CCR-11-0196. [DOI] [PMC free article] [PubMed] [Google Scholar]