

Abstract
During influenza virus infection, it is unclear how much alveolar cell loss can be tolerated before the host succumbs to the disease. We sought to define relevant correlates of disease severity in the mouse influenza model, hypothesizing that a susceptibility threshold exists for alveolar epithelial cell loss. We compared lung pathology, virus spread, alveolar epithelial cell depletion, arterial blood oxygenation, physiological responses measured by unrestrained plethysmography, and oxygen consumption and carbon dioxide production by gas analysis in mice at intervals after infection with virus strains and doses that cause mild (x31) or severe (PR/8) influenza. Both mild and severe infections showed similar degrees of lung damage and virus dissemination until day 6 after inoculation but diverged in survival outcomes from day 9. Day 6 PR/8-infected mice had normal respiratory and gas exchange functions with 10% type I cell loss. However, day 10 PR/8-infected mice had 40% type I cell loss with a concomitant drastic decreases in tidal and minute volumes, V̇o2, V̇co2, and arterial blood oxygenation, compared with a maximum 3% type I cell loss for x31 on day 10 when they recovered body weight and respiratory functions. Alterations in breaths per minute, expiratory time, and metabolic rate were observed in both infections. A threshold for maintenance of proper respiratory function appears to be crossed once 10% of alveolar type I cells are lost. These data indicate that lethality in influenza virus infection is a matter of degree rather than quality.
Keywords: influenza, pneumocytes, pulmonary, gas exchange
recurrent influenza epidemics and pandemics can be “mild,” with a relatively low incidence of hospitalizations and deaths, or “severe,” with a much higher prevalence of fatal events (as in the 1918 pandemic) (22). This difference in outcomes can be correlated with the distribution of pathology. Although both the upper and lower respiratory tracts (URT, LRT) are affected in most influenza cases, mild infections tend to be characterized by URT symptoms of nasal congestion and sinusitis whereas severe disease manifests with LRT injury and respiratory difficulty (7).
Airway pathology is characterized by inflammation, necrosis, and edema, with accompanying denudation of the bronchiolar and alveolar epithelia. Such damage can be mediated directly by virus invasion and the consequent lysis of respiratory tract cells, whereas further, more indirect compromise follows from immune cell activities, including neutrophils, macrophages, CD8+ T cells, and NK cells (1, 8, 17, 19). The pattern of virus distribution throughout the lung (e.g., proximal vs. proximal+distal airways) likely determines the nature and pattern of tissue damage (3), defining the overall pathogenicity profile.
The lung alveoli contain type I and type II pneumocytes. The cuboidal type II cells occupy roughly 5% of the alveolar surface, produce surfactant, and are thought to serve as progenitors for both type I and II pneumocytes (23). Type I cells cover most of the remaining surface area of alveoli. The thin, squamous type I cell population allows for the passage of oxygen and carbon dioxide between the alveolar space and the network of capillaries immediately opposing the shared basement membrane. These capillaries, which surround the alveolar sacs, are responsible for the delivery of oxygenated blood to and the removal of deoxygenated blood from the host.
Severe influenza virus strains A/PR/8/34 (H1N1), A/HK/483/97 (H5N1), and A/HK/54/98 (H1N1) replicate productively in differentiated human primary alveolar cells (4, 28), and PR/8 infection of human alveolar cells induces their apoptosis (12). Type II pneumocytes are thought to be preferential targets, although infection, virus replication, and cell death of both categories of pneumocyte have been reported (4, 5, 8, 26). Alveolar cell death is frequently observed in autopsies of patients with severe respiratory infections, such as H5N1 influenza and SARS (11, 20, 24). Although significant influenza-associated epithelial cell death will result in clinical impairment, the extent of alveolar cell loss may have the largest impact on the overall health and recovery ability of the host.
Although reports have shown that severe influenza is associated with increased alveolar damage, the “whole animal” physiological impact of mild vs. severe influenza virus-induced airway epithelial cell depletion has not been well documented. Importantly, it is not definitively known whether severe infections are the result of qualitative vs. quantitative differences in the extent of virus spread and tissue damage. We have used a spectrum of physiological and pathological assessments to probe this key question.
MATERIALS AND METHODS
Mice and infections.
Female 11- to 14-wk-old C57BL/6J (B6) mice (Jackson Laboratory, Bar Harbor, ME) were used in all experiments. Prior to virus inoculation, mice were anesthetized by intraperitoneal injection of 2,2,2-tribromoethanol. Sedated mice were given 30 μl PBS intranasally containing 4 × 10³ EID50 (egg infectious dose 50) A/Puerto Rico/8/34 (PR/8) and 1 × 10⁶ EID50 A/Aichi/02/68 (HA, NA) × A/Puerto Rico/8/34 (x31). Both strains are mouse adapted and grow only in the murine respiratory tract. All procedures were done according to an institutionally approved IACUC protocol following guidelines established by the Institute of Laboratory Animal Resources and approved by the Governing Board of the U.S. National Research Council, which includes a requirement for daily observation and euthanasia following evidence (body index score) of severe morbidity, based on clinical observation and measurement of substantial weight loss.
Arterial blood gas measurements.
Left ventricle cardiac puncture for arterial blood collection was performed under sedation with an isoflurane-100% oxygen mix, and samples were analyzed immediately for blood gases by handheld diagnostics (VetScan i-STAT 1 Analyzer, Abaxis, Union City, CA).
Unrestrained whole-body plethysmography with gas analysis.
Respiratory and gas measurements were acquired by using an animal plethysmograph with gas analysis capabilities (Buxco, Wilmington, NC). Briefly, unanesthetized animals were placed in chambers that measure slight changes in pressure due to respiratory behaviors. Uninfected mice and relatively healthy mice were acclimated to chamber environments for an hour before data acquisition, whereas mice that were clearly ill (and much less mobile) were acclimated for 20 min. No measures involved forced actions. For individual mice, respiratory measurements were taken every 2 s for 6 min, and gas measurements every 2 s in 30-s intervals.
The plethysmographic measurements were breath frequency (counts/min), expiratory time (s), tidal volume (ml, calculated), and minute volume (ml/min, calculated). Gas measurements determined the volume of oxygen consumed (V̇o2) and the volume of carbon dioxide (V̇co2) produced (both ml/min). Metabolic rate was calculated from V̇co2 and V̇o2. V̇o2, V̇co2, minute volume, and tidal volume values are used for direct comparison of animal groups in our experiments; however, because of technique, absolute values of these parameters may be different in others' hands. Data analysis was performed by one-way ANOVA with Tukey's correction.
Histopathological evaluation.
Following euthanasia by CO2 inhalation, mouse lungs underwent gravity inflation (reservoir placed 23 cm above the animal) via tracheal infusion with 10% neutral-buffered formalin solution (vol/vol). After removal, lungs were immediately fixed in the same formalin solution for a minimum of 24 h before embedding, sectioning, and staining for conventional histopathology [hematoxylin and eosin (H&E)], viral influenza virus (US Biological, Swampscott, MA), podoplanin (T1a, gp38, and aggrus) (eBioscience, San Diego, CA), and surfactant C (Santa Cruz Biotechnology, Santa Cruz, CA). One slide including all lung lobes per mouse was used for evaluations.
The podoplanin- and surfactant C-stained sections were blinded for pathology evaluation and the loss of type I pneumocytes was quantified by capturing digital images of whole lung sections stained for podoplanin using an Aperio ScanScope XT Slide Scanner (Aperio Technologies, Vista, CA), then manually outlining entire fields together with areas with noticeably decreased (or absent) staining for podoplanin. The percentage of lung field with reduced type I pneumocyte coverage was calculated by use of Aperio's ImageScope software.
Five types of pulmonary lesions were scored histologically for H&E sections on a 1–5 scale, as follows: 0 = no lesions; 1 = minimal, focal to multifocal, inconspicuous; 2 = mild, multifocal, prominent; 3 = moderate, multifocal, prominent; 4 = marked, multifocal or coalescing, lobar; 5 = severe, extensive, and diffuse, with multilobar consolidation.
Detecting virus.
Tissue sections were stained for influenza virus as described above. Whole lungs were homogenized in infection medium (double-distilled H2O, 0.3% BSA, 0.45% NaHCO3, 1× MEM), and added to confluent monolayers of Madin-Darby canine kidney (MDCK) cells in 10-fold dilutions (10−1 to 10−6) for 1 h. The supernatant fluid was then removed and the cultures were overlaid with agar containing 1 μg/ml trypsin (TPCK treated, Sigma-Aldrich, St. Louis, MO). After 37°C incubation for 72 h, agar plugs were removed, cell layers were stained with crystal violet, and plaques were counted for titer calculation.
RESULTS
Significant illness, measured by percent weight loss, occurred following intranasal challenge with both the “mild” x31 and “severe” PR/8 virus strains (Fig. 1A). Following x31 infection, mice lost more weight initially than PR8-infected animals, but they lost less weight overall and recovered completely by day (d) 10. At the virus doses used, all the x31 mice survived whereas there was a 60% morbidity/mortality rate following PR/8 infection (Fig. 1B).
Fig. 1.

Comparison of weight loss and necessary euthanasia in PR/8- vs. x31-infected mice after infection. A: weight loss as a percentage of original weight. B: percent mice not reaching guidelines for euthanasia (severely moribund). x31, n = 27; PR/8, n = 16 mice. Means ± SE shown.
Respiration patterns for nonlethal and lethal infections.
We tracked the respiration of individual x31- and PR/8-infected mice for 14 days using unrestrained whole body plethysmography with gas analysis. Here, we determined breaths per minute (BPM), tidal volume, minute volume, and expiratory time on d2–d15 in at least four mice per influenza strain. Breath waveforms of uninfected vs. d9 mild and severe infections showed virus-strain related alterations in respiration (Fig. 2A). On d2, the x31 mice were distinctly different from the uninfected and PR/8 mice, as shown by decreased BPM, increased tidal volume, and increased expiratory time (Fig. 2, B, C, and E). The two groups of infected mice began to converge on d3, and were well matched for most measures by d6. BPM was normal for both viruses by d9, and expiratory time was no longer elevated in either infection by d8 (Fig. 2, B and E). Inspiratory time changed only at later times after x31 infection (data not shown), whereas tidal and minute volumes were significantly decreased in the PR/8 mice, beginning on d10 and d6, respectively (Fig. 2, C and D). Surprisingly, these two volume measures increased above uninfected mouse levels in the x31-infected group. Enhanced Pause and Pause, although considered controversial, are thought to be influenced by changes in respiratory patterns (2, 22). These patterns were similar to those of expiratory time (Fig. 2E and data not shown).
Fig. 2.

PR/8-infected mice have more severe respiratory functions than x31-infected mice. Respiratory functions of mice days 2–15 after infection. A: box flow waveform of uninfected vs. day (d) 9 postinfection mice; 0.8 s acquisition (ml/s). B: breaths per minute. C: tidal volume (ml). D: minute volume (ml/min). E: expiratory time (s). Four to 6 mice per time point until d13. d13–15 PR/8, n = 2; x31, n = 3. SE shown. *P < 0.05, **P < 0.005, ***P < 0.0005. Asterisks by bars: significance between uninfected (uninf.) and specified group on that day. Significance between x31 and PR/8 groups on specific days (not shown on graph): breaths per minute (B) d2 P < 0.0005, d12 P < 0.05; tidal volume (C) d2 P < 0.005, d6 P < 0.05; d7, d8, d9 P < 0.005; d10, d11 P < 0.0005; d12 P < 0.05; minute volume (D) d5 P < 0.05, d6 P < 0.005; d7 P < 0.05; d8 P < 0.005; d9 P < 0.05; d10, d11, d12 P < 0.0005; d13 P < 0.005; d14 P < 0.05; expiratory time (E) d2 P < 0.0005, d3, d4, d11 P < 0.05.
Compromised arterial blood oxygenation in lethal infection.
Oxygen levels were determined for arterial blood over the course of the disease. Partial pressure of oxygen (ppO2, mmHg) is a measure of O2 in arterial blood and is indicative of the effectiveness of gas exchange. Analysis of arterial blood oxygenation showed similarly decreased levels on d3 and d6 after either infection, although these were not statistically significant from the values for uninfected mice (Fig. 3A). However, ppO2 levels clearly diverged, with x31-infected mice returning to normal by d12, whereas PR/8-infected mice exhibited substantially lower levels beginning d9. This ppO2 nadir overlaps with the time PR/8-infected mice succumb to disease (Fig. 1B). Although not statistically significant, the ppO2 levels of PR/8 survivors were still lower than normal on d30, suggesting persistent pulmonary damage and compromised function. Oxygen saturation levels, which represent the percentage of occupied oxygen binding sites on hemoglobin compared with the total number of possible binding sites, reflected ppO2 throughout in these groups of mice (Fig. 3C) although arterial blood carbon dioxide remained constant (Fig. 3B).
Fig. 3.
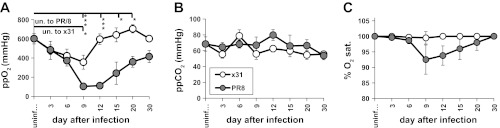
Comparison of arterial blood oxygen and carbon dioxide in PR/8- vs. x31-infected mice up to 30 days. A: partial pressure of arterial blood oxygen (ppO2) (mmHg). B: partial pressure arterial blood carbon dioxide (ppCO2). C: percent oxygen saturation (sat.) in arterial blood was determined by clinical diagnostics. x31, n = 3–6 mice/time point; PR/8, n = 3–8 mice/time point. Means ± SE shown. *P < 0.05, **P < 0.005, ***P < 0.0005. Asterisks by bars: significance between uninfected (un.) and specified group on that day. Significance between x31 and PR/8 groups on specific days (not shown on graph): ppO2 d9 P < 0.05, d12 P < 0.0005, d15 P < 0.05, d20 P < 0.005.
Poor gas exchange in lethal infection begins by day 6 after infection.
Given the decreased blood oxygenation seen after d6 in the PR/8 mice, we investigated the kinetics of respiratory gas exchange by quantifying V̇o2 and V̇co2 in discrete time units and calculating the MR, or energy expenditure due to metabolism. As with other respiratory measures, the V̇o2, V̇co2, and MR responses to the two viruses were similar from d3–d6 (Fig. 4, A–C), with the x31 group experiencing only minor shifts in these parameters before returning to normal by d9. However, PR/8-infected mice exhibited drastically decreased tidal volume, V̇o2, V̇co2, and MR by d9 through d12 (Figs. 2C and 4, A–C). By d15, however, the PR/8 survivors regained normal levels for all these measures, despite their reduced ppO2 levels.
Fig. 4.
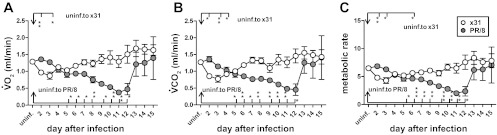
PR/8-infected mice consumed less oxygen and produced less carbon dioxide during times of peak illness. Gas exchange functions of BL/6 mice days 2–15 after infection with either x31 or PR/8. A: volume oxygen consumed (V̇o2). B: volume carbon dioxide produced (V̇co2). C: metabolic rate (MR). V̇o2, V̇co2 units are ml/min; 4–6 mice per time point up to d12. d13–15 PR/8, n = 2; x31, n = 3. SE shown. *P < 0.05, **P < 0.005, ***P < 0.0005. Asterisks by bars: significance between uninfected and specified group on that day. Significance between x31 and PR/8 groups on specific days (not shown on graph): V̇o2 (A) d2 P < 0.005; d3, d6, d7 P < 0.05; d8, d9, d10, d11 P < 0.005; d12 P < 0.05; V̇co2 (B) d2 P < 0.005; d3 P < 0.05; d6, d7, d8 P < 0.005; d9 P < 0.05; d10, d11, d12 P < 0.005; MR (C) d2 P < 0.005; d3 P < 0.05; d6 P < 0.05; d8, d9 P < 0.005; d10 P < 0.0005; d11 P < 0.005; d12 P < 0.05.
Lung damage is more severe in lethal infection after day 9 and the virus persists longer.
We hypothesized that lethal infection caused increased tissue damage and thus functional deficit. Whole lungs were removed on d3, d6, d9, d12, and d15 after infection and H&E-stained sections were analyzed for five categories of lung lesions: alveolitis (necrosis and inflammation), bronchiolitis (necrosis, inflammation, and plugging of the bronchioles), peribronchiolitis (edema and inflammation), perivasculitis (margination and cuffing), and interstitial pneumonitis (septal thickening and inflammation). The x31 mice had slightly higher levels of alveolitis and interstitial pneumonitis than the PR/8 group on d6 (Fig. 5, A and E), whereas PR/8 infection caused slightly elevated levels of bronchiolitis on d3 when such damage was maximal (Fig. 5B). Lesion scores early on did not correlate with mortality (Fig. 1B). Overall, all five measures of lung damage were comparable in severity for both viruses until d9 but diverged from d12, decreasing in the x31 group and remaining elevated in the PR/8-infected animals through d30 (Fig. 5, B–E). Blinded sections were also scored (scale 0–5) for virus staining. Comparable levels of influenza were detected in bronchioles and alveoli on d3 and d6 for x31 and PR/8, coinciding with the lung virus titer (plaque assay) results (Fig. 6, A–C). By both methods, x31 was controlled by d9 whereas PR/8 virus could be found until d12.
Fig. 5.
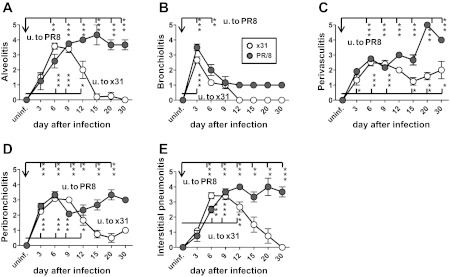
Histological damage of lung tissues from mice infected with x31 or PR/8. Whole lung tissue removed from 3 (uninfected; u.) or 6 (infected) mice on noted days after infection (x-axis) were stained with hematoxylin and eosin. A pathologist scored tissues on a 1–5 scale for severity of bronchiolitis (A), peribronchiolitis (B), pervasculitis (C), alveolitis (D), and interstitial pneumonitis (E). Means ± SE shown. *P < 0.05, **P < 0.005, ***<0.0005. Asterisks by bars: significance between uninfected and specified group on that day. Significance between x31 and PR/8 groups on specific days (not shown on graph): alveolitis (A) d12 P < 0.05; d15, d20, d30 P < 0.0005; bronchiolitis (B) d3 P < 0.05; perivasculitis (C) d15 P < 0.05, d20 P < 0.0005, d30 P < 0.05; peribronchiolitis (D) d9 P < 0.0005, d15 P < 0.005, d20 P < 0.0005; interstitial pneumonitis (E) d6 P < 0.05, d12 P < 0.005, d15 P < 0.05, d20 P < 0.005, d30 P < 0.0005.
Fig. 6.
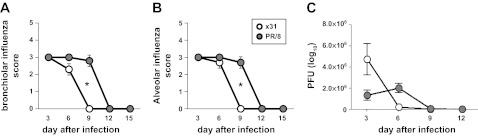
Viral presence in lung tissues from mice infected with x31 or PR/8 over time. Whole lung tissue removed from mice on noted days after infection was stained for influenza A (A and B) or analyzed for plaque-forming units (PFU) on MDCK cell monolayers (C). A pathologist blindly scored tissues on a 1–5 scale for influenza A presence in bronchioles (A) and alveoli (B). C: PFU of 3 lungs per treatment group per day, calculated from plaque counts. Means ± SE. *P < 0.05.
Lethal infection is associated with at least 10% type I pneumocyte loss.
To pinpoint the amount of type I cell loss that associates with a negative impact on physiological functions in vivo, we quantified lung sections for type I (podoplanin/T1a/gp38/aggrus) and type II (surfactant C) pneumocytes on d3, d6, and d10 after x31 or PR/8 infection (Table 1, Fig. 7). Podoplanin/T1a is a known marker for type I pneumocytes and has been documented in lung injury models to demonstrate loss of these cells (6, 14, 15). PR/8 induced a progressive loss of type I pneumocytes, with coverage of alveolar septa declining from 95% (d3), to 91% (d6), to 60% on d10 (Table 1, Fig. 7, E, G, and H). By d10, most alveoli in affected areas of PR/8-infected lungs had markedly reduced coverage by type I and type II pneumocytes (Table 1, Fig. 7, E and F, and data not shown). This loss was accompanied by increased amounts of intra-alveolar and septal collagen, thickened alveolar septa, and associated intra-alveolar edema. Conversely, type I pneumocyte coverage of alveolar septa for the x31 group was 100% (d3), 99% (d6), and 97% (d10), with any type II pneumocyte loss reflecting the profile for type I cells in being limited to restricted foci (Table 1, Figs. 7, C and D, and data not shown). In addition, the d10 x31-infected lungs showed evidence of more advanced bronchiolar and alveolar repair, characterized by an absence of denuded bronchiolar airways and the presence of alveolar epithelial hyperplasia around some terminal airways.
Table 1.
Assessment of type I and type II alveolar epithelial cell presence in lungs of x31- and PR/8-infected mice
| Treatment | Day After Infection | Type I AEC | AEC I % Lung Field with Decreased or Absent Podoplanin | Type II AEC |
|---|---|---|---|---|
| Uninfected | Diffusely positive | 0 | Uniform distribution | |
| x31 | 3 | Diffusely positive | 0 | Multifocal mild reduction |
| 6 | Small foci with reduced positivity | 1.2 ± 0.2 | Type II reduced in affected areas | |
| 10 | Small multiple foci negative | 2.6 ± 0.7 | Type II reduced in small areas only | |
| PR/8 | 3 | Multifocal patches with reduced positivity | 4.9 ± 0.7 | Multifocal moderate reduction |
| 6 | Multifocal patches with reduced positivity | 9.1 ± 0.8 | Type II reduced in affected areas | |
| 10 | Extensive areas negative | 41 ± 2.6 | Type II reduced in affected areas |
Whole lung tissues removed from mice on noted days after infection were sectioned and stained with podoplanin [type I alveolar epithelial cells (AEC)] or surfactant C (type II AEC). A pathologist blindly graded alveolar areas of lung tissues for intensity and localization of staining. Means ± SE are shown for 3–4 mice per virus examined per day.
Fig. 7.
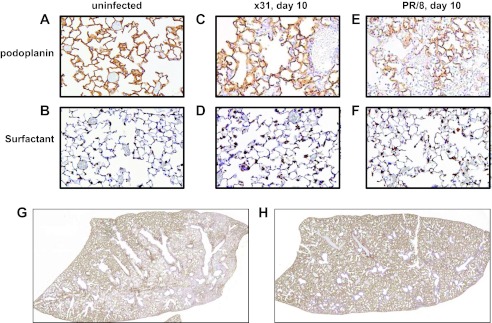
Increased depletion of type I and type II alveolar epithelial cells (AEC) in PR/8-infected vs. x31-infected mice. Whole lung tissue from uninfected or d10 postinfection mice were stained with podoplanin (type I AEC) or surfactant C (type II AEC). Representative images of uninfected mouse lung podoplanin staining (A), uninfected mouse lung surfactant C staining (B), d10 podoplanin staining in x31-infected mouse lungs (C), d10 surfactant C staining in x31-infected mouse lungs (D), d10 podoplanin staining in PR/8-infected mouse lungs (E), and d10 surfactant C staining in PR/8-infected mouse lungs (F). Whole lungs from mice d10 after PR/8 (G) or x31 (H) infection were removed, sectioned, and stained for podoplanin. Representative whole lobe section shown.
DISCUSSION
Severe influenza virus infections, including those caused by the avian H5N1 and historical pandemic strains, result in substantial respiratory incapacitation and have been shown to induce significant alveolar epithelial cell death in patients, animal models, and in vitro cell cultures (4, 5, 8, 11, 12, 20, 22, 24, 26, 28). In the present analysis, analyzing in vivo physiological responses in mice following infection with two influenza viruses that cause mild vs. severe disease has allowed us to link altered respiratory function to the extent of type I pneumocyte depletion assessed by subsequent histopathology.
The extent and severity of infection and inflammation did not diverge appreciably at early time points (d3 and d6), although they differed thereafter for the more (PR/8) and less (x31) virulent strains. Curiously, although x31 virus titers and deep lung location scores were highest early, and there was significantly increased alveolar inflammation, histological analysis on d6 showed only small foci of type I cell depletion. In contrast, despite comparable lung titers and alveolar inflammatory profiles, d6 PR/8 lungs showed type I cell loss in excess of that seen at any time point for the x31-infected respiratory tract. Many of the PR/8-infected mice generally succumbed by d9–d12, whereas the clinical status of the x31 set was greatly improved. Evidence of morbidity in the PR/8 group corresponded to the extent of alveolar damage, with functional measures (tidal volume, minute volume, V̇o2, V̇co2, and arterial blood oxygen) reaching a nadir then showing improvement in the d15 survivors, likely reflecting the removal (by euthanasia) of severely affected mice.
Analysis of the data set from d9–d12 time reveals two curious findings. First, despite the absence of virus at d9, the x31 mice had high alveolitis scores indicative of continued inflammation. However, this had little effect on respiration or gas exchange and did not lead to the severe loss of type I pneumocytes. Second, although virus titration assays detected only very low levels of replicating virus in d9 PR/8-infected lungs, there was widespread virus staining in both the alveolar and bronchiolar compartments. This persistence of PR/8 virus appears to be a major distinguishing factor between the two infections, suggesting that cells with virus protein in their cytoplasm are indeed damaged and contribute to a downward spiral of ever diminished gas exchange and decreased arterial blood oxygenation with the net result being major functional compromise. Even so, increased alveolar epithelial cell loss (>x31) was noted in PR/8 lungs from d3, indicating that the damage cycle establishes early and that the effect of d9 virus persistence may be additive rather than a primary determinant of pathology. Such phenomenon is suggestive of differences between the two viruses' effects on host tolerance, a concept long identified in plant biology but only recently introduced to animal infectious disease (16). Our data indicate that despite the equivalent capacities of the two viruses to replicate in lungs (titration on MDCK cells) and to invade both alveolar (and bronchiolar) epithelial cells, PR/8 infection results in more rapid and diffuse type I alveolar cell loss than is caused by the x31 virus.
Because it is unclear whether type I pneumocytes can be directly infected by influenza and support viral replication, the cause of type I pneumocyte loss in our hands is unknown (4, 8, 10, 26). The large surface area of type I cells lends them to increased susceptibility to environmental insults, which may result from direct virus-induced or “bystander” damage (25). This characteristic of type I cells may explain their quick demise during influenza infection. In addition, type I cell loss may reflect the lack of type II pneumocyte secretory products that are normally protective and limit type I cell apoptosis (13, 18, 27). Furthermore, as type II cells are the precursors of the type I cells, loss of the former could compromise the rapid repair of the alveolar epithelial lining and favor the development of interstitial and intra-alveolar fibrosis.
Coincident with the increased loss of type I pneumocytes, the PR/8 lungs show a reduced capacity to take in oxygen and expel carbon dioxide. It is likely that the higher mortality in these mice is due to the basic lack of proper respiration. Besides epithelial cell depletion, another possible contributor to poor respiration is edema. This condition generally occurs as a result of decreased barrier function. Therefore, despite the direct effect edema has on respiration, it can be attributable to the epithelial cell loss.
An overlay of time progression of V̇o2 and V̇co2 (Figs. 4, A and B), arterial blood oxygenation (Fig. 3A), and animal survival (Fig. 1B) illustrates the coincidence of gas exchange nadirs with peak concession to disease. By adding in type I and type II staining scores to this time overlay, we can observe the degree of alveolar cell loss that corresponds to negative impact on systemic respiration. Combining measurements of d6–d9 V̇o2, V̇co2, tidal volume, and arterial blood oxygenation with alveolar cell staining, we see that mice lose the ability to respire properly coincident with a 10–40% depletion of type I cells. We can also consider the converse situation: how much alveolar cell loss can an organism experience and still retain adequate lung function? Assuming that d6 is the last time point when PR/8-infected mice respire and oxygenate their blood well, the data suggest that ∼10% loss of type I cells in multifocal patches, and comparable type II loss in affected areas, is survivable.
By extending studies out to 30 days after infection, we observed long-term damage and recovery in mice after acute influenza virus infection. Our findings are in accord with previous work showing extended lung impairment by histopathology and mean breath volume despite early virus clearance (9). Overall, alveolar cell loss can simply be too great to allow functional recovery in mice exposed to a virulent influenza virus.
GRANTS
This study was funded by National Institute of Allergy and Infectious Diseases (NIAID) contract HHSN272200800058C, American Lebanese Syrian Associated Charities (ALSAC), National Heart, Lung, and Blood Institute Grant F32HL099168, and NIAID contract HHSN266200700005C.
DISCLOSURES
No conflicts of interest, financial or otherwise, are declared by the author(s).
AUTHOR CONTRIBUTIONS
C.J.S., P.V., P.C.D., and P.G.T. conception and design of research; C.J.S., J.L.M., and R.B. performed experiments; C.J.S., P.V., P.C.D., and P.G.T. interpreted results of experiments; C.J.S. and P.V. prepared figures; C.J.S. drafted manuscript; C.J.S., P.V., P.C.D., and P.G.T. edited and revised manuscript; C.J.S., P.C.D., and P.G.T. approved final version of manuscript; P.V. analyzed data.
ACKNOWLEDGMENTS
We thank the St. Jude Animal Resource Center and Veterinary Pathology Core for animal care and technical assistance and Alan Diercks for critical review of the manuscript.
REFERENCES
- 1. Abdul-Careem MF, Mian MF, Yue G, Gillgrass A, Chenoweth MJ, Barra NG, Chew MV, Chan T, Al-Garawi AA, Jordana M, Ashkar AA. Critical role of natural killer cells in lung immunopathology during influenza infection in mice. J Infect Dis 206: 167–177, 2012 [DOI] [PubMed] [Google Scholar]
- 2. Bates J, Irvin C, Brusasco V, Drazen J, Fredberg J, Loring S, Eidelman D, Ludwig M, Macklem P, Martin J, Milic-Emili J, Hantos Z, Hyatt R, Lai-Fook S, Leff A, Solway J, Lutchen K, Suki B, Mitzner W, Pare P, Pride N, Sly P. The use and misuse of Penh in animal models of lung disease. Am J Respir Cell Mol Biol 31: 373–374, 2004 [DOI] [PubMed] [Google Scholar]
- 3. Bruder D, Srikiatkhachorn A, Enelow RI. Cellular immunity and lung injury in respiratory virus infection. Viral Immunol 19: 147–155, 2006 [DOI] [PubMed] [Google Scholar]
- 4. Chan MC, Chan RW, Yu WC, Ho CC, Chui WH, Lo CK, Yuen KM, Guan YI, Nicholls JM, Peiris JS. Influenza H5N1 virus infection of polarized human alveolar epithelial cells and lung microvascular endothelial cells. Respir Res 10: 102, 2009 [DOI] [PMC free article] [PubMed] [Google Scholar]
- 5. Chan MC, Cheung CY, Chui WH, Tsao SW, Nicholls JM, Chan YO, Chan RW, Long HT, Poon LL, Guan Y, Peiris JS. Proinflammatory cytokine responses induced by influenza A (H5N1) viruses in primary human alveolar and bronchial epithelial cells. Respir Res 6: 135, 2005 [DOI] [PMC free article] [PubMed] [Google Scholar]
- 6. Frank JA, Gutierrez JA, Jones KD, Allen L, Dobbs L, Matthay MA. Low tidal volume reduces epithelial and endothelial injury in acid-injured rat lungs. Am J Respir Crit Care Med 165: 242–249, 2002 [DOI] [PubMed] [Google Scholar]
- 7. Guarner J, Falcon-Escobedo R. Comparison of the pathology caused by H1N1, H5N1, and H3N2 influenza viruses. Arch Med Res 40: 655–661, 2009 [DOI] [PubMed] [Google Scholar]
- 8. Herold S, Steinmueller M, von Wulffen W, Cakarova L, Pinto R, Pleschka S, Mack M, Kuziel WA, Corazza N, Brunner T, Seeger W, Lohmeyer J. Lung epithelial apoptosis in influenza virus pneumonia: the role of macrophage-expressed TNF-related apoptosis-inducing ligand. J Exp Med 205: 3065–3077, 2008 [DOI] [PMC free article] [PubMed] [Google Scholar]
- 9. Julander JG, Hagloch J, Latimer S, Motter N, Dagley A, Barnard DL, Smee DF, Morrey JD. Use of plethysmography in assessing the efficacy of antivirals in a mouse model of pandemic influenza A virus. Antiviral Res 92: 228–236, 2011 [DOI] [PubMed] [Google Scholar]
- 10. Koerner I, Matrosovich MN, Haller O, Staeheli P, Kochs G. Altered receptor specificity and fusion activity of the haemagglutinin contribute to high virulence of a mouse-adapted influenza A virus. J Gen Virol 93: 970–979, 2012 [DOI] [PubMed] [Google Scholar]
- 11. Korteweg C, Gu J. Pathology, molecular biology, and pathogenesis of avian influenza A (H5N1) infection in humans. Am J Pathol 172: 1155–1170, 2008 [DOI] [PMC free article] [PubMed] [Google Scholar]
- 12. Kosmider B, Messier EM, Janssen WJ, Nahreini P, Wang J, Hartshorn KL, Mason RJ. Nrf2 protects human alveolar epithelial cells against injury induced by influenza A virus. Respir Res 13: 43, 2012 [DOI] [PMC free article] [PubMed] [Google Scholar]
- 13. Mason RJ. Biology of alveolar type II cells. Respirology 11 Suppl: S12–S15, 2006 [DOI] [PubMed] [Google Scholar]
- 14. McElroy MC, Kasper M. The use of alveolar epithelial type I cell-selective markers to investigate lung injury and repair. Eur Respir J 24: 664–673, 2004 [DOI] [PubMed] [Google Scholar]
- 15. McElroy MC, Pittet JF, Hashimoto S, Allen L, Wiener-Kronish JP, Dobbs LG. A type I cell-specific protein is a biochemical marker of epithelial injury in a rat model of pneumonia. Am J Physiol Lung Cell Mol Physiol 268: L181–L186, 1995 [DOI] [PubMed] [Google Scholar]
- 16. Medzhitov R, Schneider DS, Soares MP. Disease tolerance as a defense strategy. Science 335: 936–941, 2012 [DOI] [PMC free article] [PubMed] [Google Scholar]
- 17. Moskophidis D, Kioussis D. Contribution of virus-specific CD8+ cytotoxic T cells to virus clearance or pathologic manifestations of influenza virus infection in a T cell receptor transgenic mouse model. J Exp Med 188: 223–232, 1998 [DOI] [PMC free article] [PubMed] [Google Scholar]
- 18. Mura M, Binnie M, Han B, Li C, Andrade CF, Shiozaki A, Zhang Y, Ferrara N, Hwang D, Waddell TK, Keshavjee S, Liu M. Functions of type II pneumocyte-derived vascular endothelial growth factor in alveolar structure, acute inflammation, and vascular permeability. Am J Pathol 176: 1725–1734, 2010 [DOI] [PMC free article] [PubMed] [Google Scholar]
- 19. Narasaraju T, Yang E, Samy RP, Ng HH, Poh WP, Liew AA, Phoon MC, Van Rooijen N, Chow VT. Excessive neutrophils and neutrophil extracellular traps contribute to acute lung injury of influenza pneumonitis. Am J Pathol 179: 199–210, 2011 [DOI] [PMC free article] [PubMed] [Google Scholar]
- 20. Ng WF, To KF, Lam WW, Ng TK, Lee KC. The comparative pathology of severe acute respiratory syndrome and avian influenza A subtype H5N1—a review. Hum Pathol 37: 381–390, 2006 [DOI] [PMC free article] [PubMed] [Google Scholar]
- 21. Sly PD, Turner DJ, Collins RA, Hantos Z. Penh is not a validated technique for measuring airway function in mice. Am J Respir Crit Care Med 172: 256, 2005 [DOI] [PubMed] [Google Scholar]
- 22. Taubenberger JK, Morens DM. The pathology of influenza virus infections. Annu Rev Pathol 3: 499–522, 2008 [DOI] [PMC free article] [PubMed] [Google Scholar]
- 23. Uhal BD, Flowers KM, Rannels DE. Type II pneumocyte proliferation in vitro: problems and future directions. Am J Physiol Lung Cell Mol Physiol 261: L110–L117, 1991 [DOI] [PubMed] [Google Scholar]
- 24. Uiprasertkul M, Kitphati R, Puthavathana P, Kriwong R, Kongchanagul A, Ungchusak K, Angkasekwinai S, Chokephaibulkit K, Srisook K, Vanprapar N, Auewarakul P. Apoptosis and pathogenesis of avian influenza A (H5N1) virus in humans. Emerg Infect Dis 13: 708–712, 2007 [DOI] [PMC free article] [PubMed] [Google Scholar]
- 25. Wang D, Morales JE, Calame DG, Alcorn JL, Wetsel RA. Transplantation of human embryonic stem cell-derived alveolar epithelial type II cells abrogates acute lung injury in mice. Mol Ther 18: 625–634, 2010 [DOI] [PMC free article] [PubMed] [Google Scholar]
- 26. Weinheimer VK, Becher A, Tonnies M, Holland G, Knepper J, Bauer TT, Schneider P, Neudecker J, Ruckert JC, Szymanski K, Temmesfeld-Wollbrueck B, Gruber AD, Bannert N, Suttorp N, Hippenstiel S, Wolff T, Hocke AC. Influenza A viruses target type II pneumocytes in the human lung. J Infect Dis 206: 1685–1694, 2012 [DOI] [PMC free article] [PubMed] [Google Scholar]
- 27. White MK, Baireddy V, Strayer DS. Natural protection from apoptosis by surfactant protein A in type II pneumocytes. Exp Cell Res 263: 183–192, 2001 [DOI] [PubMed] [Google Scholar]
- 28. Yu WC, Chan RW, Wang J, Travanty EA, Nicholls JM, Peiris JS, Mason RJ, Chan MC. Viral replication and innate host responses in primary human alveolar epithelial cells and alveolar macrophages infected with influenza H5N1 and H1N1 viruses. J Virol 85: 6844–6855, 2011 [DOI] [PMC free article] [PubMed] [Google Scholar]