Abstract
Perivascular adipose tissue (PVAT) is implicated as a source of proatherogenic cytokines. Phenotypic differences in local PVAT depots may contribute to differences in disease susceptibility among arteries and even regions within an artery. It has been proposed that PVAT around the abdominal and thoracic aorta shares characteristics of white and brown adipose tissue (BAT), respectively; however, a detailed comparison of the phenotype of these PVAT depots has not been performed. Using young and older adult rats, we compared the phenotype of PVATs surrounding the abdominal and thoracic aorta to each other and also to epididymal white and subscapular BAT. Compared with young rats, older rats exhibited greater percent body fat (34.5 ± 3.1 vs. 10.4 ± 0.9%), total cholesterol (112.2 ± 7.5 vs. 58.7 ± 6.3 mg/dl), HOMA-insulin resistance (1.7 ± 0.1 vs. 0.9 ± 0.1 a.u.), as well as reduced ACh-induced relaxation of the aorta (maximal relaxation: 54 ± 10 vs. 77 ± 6%) (all P < 0.05). Expression of inflammatory genes and markers of immune cell infiltration were greater in abdominal PVAT than in thoracic PVAT, and overall, abdominal and thoracic PVATs resembled the phenotype of white adipose tissue (WAT) and BAT, respectively. Histology and electron microscopy indicated structural similarity between visceral WAT and abdominal PVAT and between BAT and thoracic PVAT. Our data provide evidence that abdominal PVAT is more inflamed than thoracic PVAT, a difference that was by and large independent of sedentary aging. Phenotypic differences in PVAT between regions of the aorta may be relevant in light of the evidence in large animals and humans that the abdominal aorta is more vulnerable to atherosclerosis than the thoracic aorta.
Keywords: brown fat, obesity, perivascular fat, vascular function, white fat
it is now established that white adipose tissue (WAT) plays a wide-ranging physiological role far beyond the simple paradigm of fat storage (23, 24, 40, 45). The finding that measures of adiposity relate to vascular function outcomes (29) suggests the existence of signaling pathways, or crosstalk, between adipose tissue and vascular cells. Indeed, adipose tissue functions as a highly active endocrine and paracrine organ, producing a variety of cytokines that mediate the communication with vascular cells (23, 24, 40, 45). As such, recent studies implicate adipose tissue that surrounds large arteries, i.e., perivascular adipose tissue (PVAT), as a local source of inflammatory cytokines that may be involved in the initiation of vascular dysfunction and atherosclerotic disease (6, 8, 13, 14, 28, 34, 35, 45).
The nonuniform distribution of atherosclerosis throughout the arterial tree suggests that localized factors modulate the susceptibility of vascular cells to disease. While it is well recognized that alterations in shear stress play a key role in the regulation of phenotypic heterogeneity of vascular cells (5, 22, 48, 50, 52), it is also possible that phenotypic differences among local PVAT depots may contribute to differences in disease susceptibility among arteries and even regions within an artery. In this regard, it has been proposed that PVAT around the abdominal and thoracic aorta shares characteristics of WAT and brown adipose tissue (BAT) (11, 12, 37), respectively. For example, Fitzibbons et al. (11) recently performed a genome-wide microarray study in mice to compare thoracic PVAT and interscapular brown adipose tissue and concluded that PVAT from the thoracic aorta is virtually identical to interscapular brown adipose tissue. However, whether the extent of phenotypic differences between abdominal and thoracic PVAT depots is similar to that found between WAT and BAT remains unclear. Accordingly, the study presented herein was designed to directly compare the phenotype of abdominal and thoracic PVAT depots using visceral WAT and subscapular BAT as references in young and older adult overfed sedentary rats. Because WAT is more prone to the expansion of adipocytes and infiltration of immune cells than BAT (11), we hypothesized that expression of inflammatory genes and markers of immune cell infiltration would be greater in abdominal PVAT than in thoracic PVAT. Further, we reasoned that increased adiposity associated with sedentary aging would result in greater magnitude of inflammation in abdominal PVAT, relative to thoracic PVAT, such that phenotypic differences between fat depots would be more pronounced.
METHODS
Animal protocol.
The animal protocol was approved by the Institutional Animal Care and Use Committee at the University of Missouri. Male Wistar rats (n = 12) were used for the present study. All rats were housed in the College of Veterinary Medicine's animal care facility since the time of birth. Rats were maintained in a temperature-controlled (21°C) environment on a 12:12-h light-dark cycle (7 AM to 7 PM) and remained sedentary throughout the course of the study. All animals were given ad libitum access to standard chow with a macronutrient composition of 56% carbohydrate, 17% fat, and 27% protein (Formulab 5008, Purina Mills, St. Louis, MO). At the time of death, rats were 3 (n = 6) and 13 (n = 6) mo of age. Rats were anesthetized, between 8 AM and 9 AM, with an intraperitoneal injection of pentobarbital sodium (100 mg/kg). Tissues were then harvested, and animals were euthanized by removal of the heart in full compliance with the American Veterinary Medical Association Guidelines on Euthanasia. Food was removed from the cages 12 h prior to death.
Body composition.
Body composition was assessed by dual-energy X-ray absorptiometry (DXA; Hologic QDR-1000, calibrated for rodents) on the day of death. Epididymal adipose tissue depots were removed and weighed to the nearest 0.01 g. To control for age-related changes in growth, epididymal fat weight was normalized to total body weight and tibia length. The measurement of tibia length was obtained from the DXA scan. PVAT and subscapular BAT weights were not determined because priority was given to the assessment of gene expression, which requires immediate freezing of the tissues to accurately reflect the in vivo phenotype.
Adipose tissue sampling.
Epididymal white adipose tissue, subscapular BAT, PVAT surrounding the abdominal aorta, and PVAT surrounding the thoracic aorta were quickly excised from the anesthetized rat. For each fat depot, a portion was flash frozen for examination of gene expression, a portion was placed in neutral-buffered 10% formalin for histology analysis, and a portion was placed in 2% paraformaldehyde and 2% gluteraldehyde in 0.1 M sodium cacodylate solution for electron microscopy analysis.
Blood parameters.
Plasma samples were prepared by centrifugation and stored at −80°C until analysis. Glucose, triglycerides, and nonesterified fatty acids assays were performed by a commercial laboratory (Comparative Clinical Pathology Services, Columbia, MO) on an Olympus AU680 automated chemistry analyzer (Beckman-Coulter, Brea, CA) using commercially available assays, according to manufacturer's guidelines. Plasma insulin concentrations were determined using a commercially available, rat-specific ELISA (Alpco Diagnostics, Salem, NH). In addition, plasma samples were assayed in duplicate for concentrations of leptin, IL-6, monocyte chemotactic protein-1 (MCP-1), and TNF-α using a multiplex cytokine assay (Millipore Milliplex, cat no. RCYTOMAG-80K; Billerica, MA) on a MAGPIX instrument (Luminex Technologies; Luminex, Austin, TX), according to the manufacturer's instructions (16).
RNA extraction and real-time PCR.
We selected a panel of 14 adipose tissue-related genes to provide information regarding the regulation of inflammatory gene expression and immune cell infiltration. In addition, we included peroxisome proliferator-activated receptor gamma (PPAR-γ) and uncoupling protein 1 (UCP-1), a marker of BAT-like fat. Adipose tissue samples were homogenized in TRIzol solution using a tissue homogenizer (TissueLyser LT, Qiagen, Valencia, CA). Total RNA was isolated using the Qiagen's RNeasy lipid tissue kit and assayed using a Nanodrop spectrophotometer (ThermoScientific, Wilmington, DE) to assess purity and concentration. First-strand cDNA was synthesized from total RNA using the high-capacity cDNA reverse transcription kit (Applied Biosystems, Foster City, CA). The reactions were incubated in a PCR Express Hybaid thermal cycler (Hybaid, Franklin, MA). Quantitative real-time PCR was performed as previously described (32) using the ABI StepOne Plus sequence detection system (Applied Biosystems). Primer sequences (Table 1) were designed using the NCBI Primer Design tool. All primers were purchased from Integrated DNA Technologies (Coralville, IA). A 12.5-μl reaction mixture containing 10 μl of Maxima SYBR Green/ROX qPCR Master Mix (Thermo Scientific) and the appropriate concentrations of gene-specific primers plus 2.5 μl of cDNA template was loaded in each well of a 96-well plate. All PCR reactions were performed in duplicate. PCR was performed with thermal conditions as follows: 95°C for 10 min, followed by 40 cycles of 95°C for 15 s, and 60°C for 45 s. A dissociation melt curve analysis was performed to verify the specificity of the PCR products. 18S primers were used to amplify the endogenous control product. Our group has established that 18S is a suitable housekeeping gene for real-time PCR when examining adipose tissue gene expression. In the present study, 18S CTs were not different between fat depots or groups of animals. mRNA expression values are presented as 2ΔCT, whereby ΔCT = 18S CT − gene of interest CT (32). mRNA levels were normalized to WAT in the young group of rats, which was always set at 1.
Table 1.
Forward and reverse primer sequences for quantitative real-time PCR
| Primer sequence (5′→3′) |
||
|---|---|---|
| Gene | Forward | Reverse |
| 18S | GCCGCTAGAGGTGAAATTCTTG | CATTCTTGGCAAATGCTTTCG |
| Leptin | GTGCTGAGAGGACTTTGTGGGCC | CCTTCGCTCCAGACTGTGGCAC |
| TNF-α | CCCAGAAAAGCAAGCAACCA | CCTCGGGCCAGTGTATGAGA |
| MCP-1 | CTGTCTCAGCCAGATGCAGTTAA | AGCCGACTCATTGGGATCAT |
| IL-6 | AGAGACTTCCAGCCAGTTGC | AGCCTCCGACTTGTGAAGTG |
| IL-10 | CTGGCTCAGCACTGCTATGT | GCAGTTATTGTCACCCCGGA |
| IL-18 | ACAGCCAACGAATCCCAGAC | ATAGGGTCACAGCCAGTCCT |
| IL1-RA | GAGGCTGATCATCCCGTGAG | GCCAGAGTGATCAGGCAGTT |
| Adiponectin | CAAGGCCGTTCTCTTCACCT | CCCCATACACTTGGAGCCAG |
| OB-Rb | GCAGCTATGGTCTCACTTCTTTTG | GGTTCCCTGGGTGCTCTGA |
| TNFR1 | TTGTAGGGATTCAGCTCCTGTC | CTCTTACAGGTGGCACGAAGTT |
| TNFR2 | TGCAACAAGACTTCAGACACCGTG | AGGCATGTATGCAGATGGTTCCAG |
| IL-6R | AAGCAGGTCCAGCCACAATGTAG | CCAACTGACTTTGAGCCAACGAG |
| AdipoR1 | GCAGACAAGAGCAGGAGTGT | ACTGTGGTGGCCTTGACAAA |
| F4/80 | GCCATAGCCACCTTCCTGTT | ATAGCGCAAGCTGTCTGGTT |
| CD11c | CTGTCATCAGCAGCCACGA | ACTGTCCACACCGTTTCTCC |
| FoxP3 | CTCCAGTACAGCCGGACAC | GGTTGGGCATCAGGTTCTTG |
| PPAR-γ | TGCTGCAGGCCCTGGAACTC | AGCACCTTGGCGAACAGCTGG |
| UCP-1 | CCGGTGGATGTGGTAAAAAC | CTCCAAGTCGCCTATGTGGT |
Histology assessments.
Formalin-fixed adipose tissue samples were processed through paraffin embedment, sectioned at 5 μm, and stained with hematoxylin and eosin for morphometric determinations. Sections were examined using an Olympus BX60 photomicroscope (Olympus, Melville, NY) and photographed at ×10 magnification using with a Spot Insight digital camera (Diagnostic Instruments, Sterling Heights, MI). Adipocyte diameter measurements were performed using Image Pro imaging software (Media Cybernetics, Bethesda, MD), as recently described (16).
Electron microscopy.
All reagents were purchased from Electron Microscopy Sciences (Hatfield, PA) unless otherwise stated. Primary fixation of adipose tissue (1 mm3) was performed immediately postharvest in 2% paraformaldehyde, 2% glutaralderhyde, in 100 mM sodium cacodylate pH 7.35. Samples were then postfixed using 1% osmium tetroxide in 100 mM sodium cacodylate, pH 7.35. Next, a graded dehydration series was performed using ethanol. Dehydrated tissues were then embedded in Epon/Spurr's resin. Sections were cut to a thickness of 85 nm using an ultramicrotome (Ultracut UCT, Leica Microsystems, Wetzlar, Germany) and a diamond knife (Diatome, Hatfield, PA). These sections were stained using Sato's triple lead solution stain (41) and 5% aqueous uranyl acetate. Images were acquired on the JEOL JEM 1400 transmission electron microscope (JEOL, Peabody, MA) at 80 kV at the Electron Microscopy Core Facility, University of Missouri.
Functional assessment of isolated aortic rings.
The thoracic aortas were harvested, trimmed of fat and connective tissue, and sectioned into 2-mm rings in cold Krebs. Rings were then mounted on wire feet connected to isometric force transducers and submerged in 20-ml baths containing physiological Krebs solution maintained at 37°C for 1 h to allow for equilibration. Aortic rings were stretched to optimal length, which ranged from 130 to 140% of passive diameter. Aortic vasomotor function was investigated with cumulative concentration-response curves of ACh, an endothelium-dependent dilator (ACh, 10−10 to 10−4 M) and sodium nitroprusside (SNP), an endothelium-independent dilator (10−10 to 10−4 M). A submaximal concentration of phenylephrine (3e−7 M) was used to preconstrict all vessels prior to ACh and SNP relaxation curves. The contribution of nitric oxide in mediating ACh-induced relaxation was assessed by incubating the rings with NG-nitro-l-arginine methyl ester (l-NAME, an NOS inhibitor, 300 μM, 20 min), respectively. Relaxation at each concentration was measured and expressed as percent maximum relaxation, where 100% is equivalent to loss of all tension developed in response to phenylephrine (4).
Statistical analysis.
Between-group differences for all descriptive variables were determined by using an independent t-test. Concentration-response curves from vasomotor function experiments were analyzed using a 2 × 6 (group × concentration) mixed design, repeated-measures ANOVA. In addition, 2 × 4 (group × fat depot) mixed-design, repeated-measures ANOVAs were used to evaluate the effects of group and fat depot on adipose tissue gene expression. When a significant group by fat depot interaction was found, simple effects were evaluated. All data are presented as means ± SE. For all statistical tests, the α level was set at 0.05.
RESULTS
The significant increases in body weight, percent body fat, and epididymal fat weight induced by aging (all P < 0.05) are presented in Table 2. In addition, plasma levels of total cholesterol, low-density lipoprotein (LDL), high-density lipoprotein (HDL), LDL:HDL ratio, nonesterified fatty acids, triglycerides, insulin, but not fasting glucose, were significantly higher in older adult compared with the young rats (Table 2; P < 0.05). HOMA of insulin resistance index was also higher (P < 0.05) in older compared with young rats (Table 2). Plasma cytokine levels are presented in Table 2. Leptin and MCP-1 were significantly higher (P < 0.05) in older than young rats. As shown in Fig. 1, endothelium-dependent dilation of the aorta was blunted in older rats compared with young rats. This difference was abolished when aortic rings were treated with l-NAME, a nitric oxide synthase inhibitor. Endothelium-independent dilation was similar between groups.
Table 2.
Body composition and plasma markers in young and older adult rats
| Variable | Young | Older | P value |
|---|---|---|---|
| Body weight, g | 363.2 ± 12.5 | 756.0 ± 42.6 | <0.0001 |
| Body fat, % | 10.4 ± 0.9 | 34.5 ± 3.1 | <0.0001 |
| Epididymal fat weight, g | 2.0 ± 0.2 | 10.6 ± 1.0 | <0.0001 |
| Epididymal fat weight/body weight | 0.028 ± 0.002 | 0.045 ± 0.002 | <0.0001 |
| Epididymal fat weight, g/tibia length, mm | 0.051 ± 0.005 | 0.228 ± 0.021 | <0.0001 |
| Total cholesterol, mg/dl | 58.7 ± 6.3 | 112.2 ± 7.5 | 0.0003 |
| LDL, mg/dl | 22.3 ± 2.6 | 45.5 | 0.006 |
| HDL, mg/dl | 23.3 ± 1.9 | 32.2 ± 1.2 | 0.003 |
| LDL/HDL | 0.9 ± 0.1 | 1.4 ± 0.2 | 0.035 |
| Triglycerides, mg/dl | 65.3 ± 16.2 | 172.3 ± 27.2 | 0.007 |
| NEFA, mmol/l | 0.64 ± 0.1 | 0.95 ± 0.1 | 0.049 |
| Insulin, ng/ml | 2.4 ± 0.2 | 4.8 ± 0.1 | <0.0001 |
| Glucose, mg/dl | 163.3 ± 9.8 | 146.8 ± 6.0 | 0.182 |
| HOMA-IR index | 0.9 ± 0.1 | 1.7 ± 0.1 | 0.001 |
| Leptin, pg/ml | 7038 ± 2101 | 33279 ± 5280 | 0.0009 |
| TNF-α, pg/ml | 0.9 ± 0.3 | 1.4 ± 0.6 | 0.409 |
| MCP-1, pg/ml | 21.2 ± 2.5 | 32.7 ± 4.0 | 0.042 |
| IL-6, pg/ml | 27.0 ± 7.2 | 37.8 ± 8.6 | 0.359 |
Values are expressed as means ± SE.
LDL, low-density lipoprotein; HDL, high-density lipoprotein; NEFA, nonesterified fatty acids; HOMA-IR, homeostasis model assessment of insulin resistance; TNF-α, tumor necrosis factor-alpha; MCP-1, monocyte chemotactic protein-1; IL-6, interleukin 6.
Fig. 1.
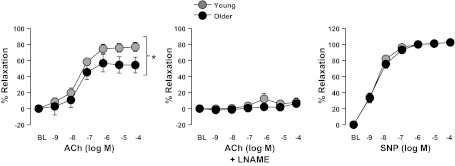
Vasomotor function of thoracic aortic rings in young and older adult rats. Values are expressed as means ± SE. ACh, acetylcholine; l-NAME, l-NG-Nitro-l-arginine; SNP, sodium nitroprusside. *Significant main effect of group (P < 0.05).
Figures 2 and 3 illustrate representative photographs obtained via histology and electron microscopy, respectively, of epididymal WAT, subscapular BAT, abdominal PVAT, and thoracic PVAT in young and older adult rats. Structural similarity can be appreciated between visceral white and abdominal PVAT and between subscapular BAT and thoracic PVAT. In addition, older adult rats exhibited increased adipocyte diameter in abdominal PVAT (young = 55.5 ± 3.9 μm vs. older = 108.1 ± 5.8 μm; P < 0.05) and epididymal adipose tissue (young = 83.4 ± 5.8 μm vs. older = 161.6 ± 12.6 μm; P < 0.05), as well as increased lipid deposition in thoracic PVAT and BAT. The increased adipocyte size in epididymal fat with aging resulted in greater fat mass. Similarly, increased adipocyte size in abdominal PVAT also appeared to result in greater fat mass; however, PVAT mass was visually inspected and not objectively measured. Electron microscopy data revealed that PVAT surrounding thoracic aortas was composed of multilocular brown adipocytes and abundant mitochondria, whereas adipocytes surrounding abdominal aortas were primarily unilocular, thus resembling white adipose tissue.
Fig. 2.
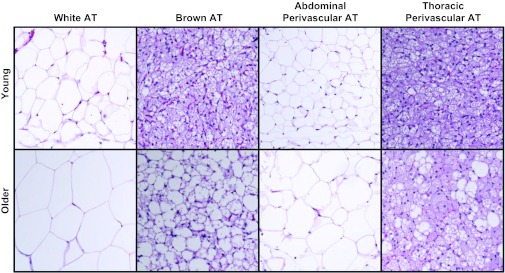
Representative histology photographs of epididymal white adipose tissue, subscapular brown adipose tissue, abdominal perivascular adipose tissue (PVAT), and thoracic PVAT in young and older adult rats. Pictures were captured at ×10 magnification. AT, adipose tissue.
Fig. 3.
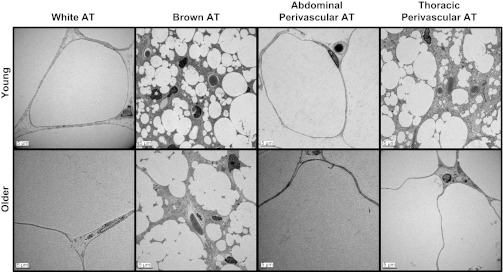
Representative electron microscopy photographs of epididymal white adipose tissue, subscapular brown adipose tissue, abdominal PVAT, and thoracic PVAT in young and older adult rats. Pictures were captured at ×500 magnification.
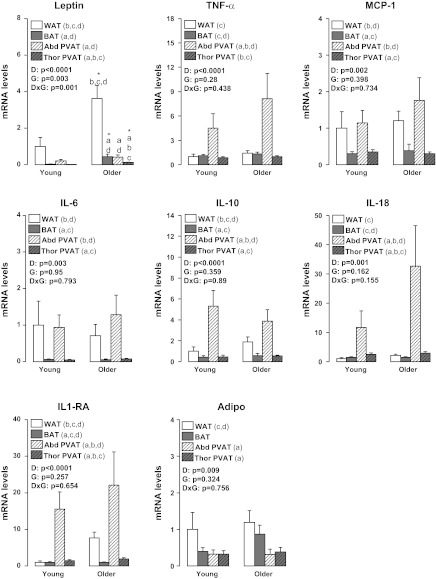
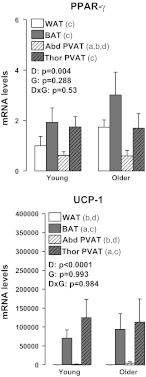
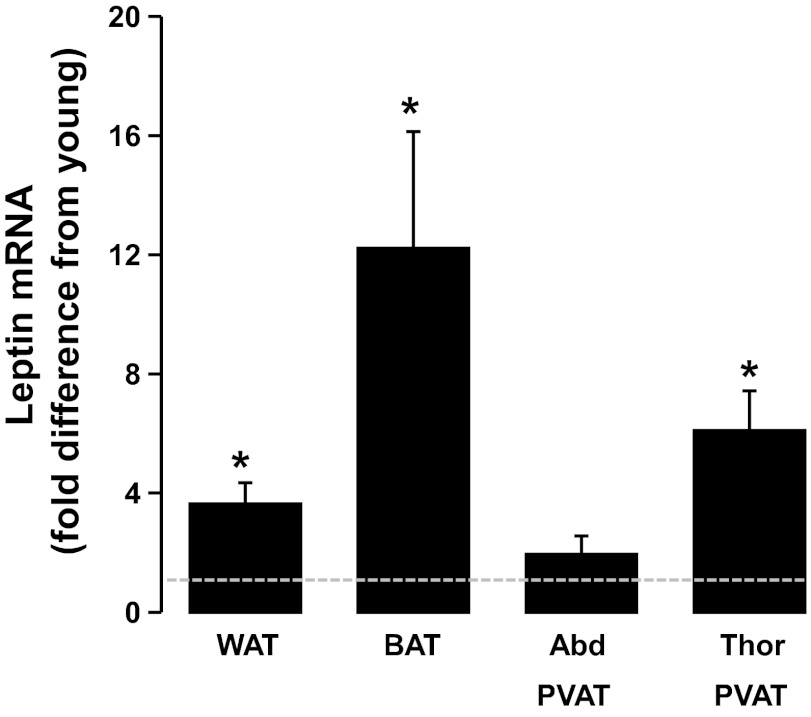
Figures 4 to 7 summarize the results on adipose tissue gene expression. As shown, a group × fat depot interaction was found for leptin and leptin receptor (OB-Rb) (P < 0.05). Main effects of group were observed for leptin and CD11c for which greater gene expression was found in older than young rats (P < 0.05). Main effects of fat depot (P < 0.05) were observed for leptin, TNF-α, MCP-1, IL-6, IL-10, IL-18, IL-1 receptor antagonist (IL1-RA), adiponectin, OB-Rb, TNF receptor 1 (TNFR1), TNFR2, IL-6 receptor (IL-6R), F4/80, CD11c, forkhead box P3 (FoxP3), PPAR-γ, and UCP-1 (Figs. 4–7). Figure 8 depicts the differences in leptin mRNA between groups within each fat depot.
Fig. 4.
Effects of adipose tissue depots on expression of inflammation-related genes in young and older adult rats. Values are expressed as means ± SE. WAT in the young group of rats is used as the reference tissue and set at 1. TNF-α, tumor necrosis factor-alpha; MCP-1, monocyte chemotactic protein-1; IL-6, interleukin 6; IL-10, interleukin 10; IL-18, interleukin 18; IL1-RA, interleukin 1 receptor antagonist; Adipo, adiponectin; WAT, epididymal white adipose tissue; BAT, subscapular brown adipose tissue; Abd PVAT, abdominal perivascular adipose tissue; Thor PVAT, thoracic perivascular adipose tissue; D, fat depot main effect; G, group main effect; DxG, fat depot by group interaction effect; Letter a denotes significantly different (P < 0.05) from WAT; letter b denotes significantly different (P < 0.05) from BAT; c denotes significantly different (P < 0.05) from Abd PVAT; and d denotes significantly different (P < 0.05) from Thor PVAT.
Fig. 7.
Effects of adipose tissue depots on expression of peroxisome proliferator-activated receptor gamma (PPAR-γ) and uncoupling protein-1 (UCP-1) in young and older adult rats. Values are expressed as means ± SE. WAT in the young group of rats is used as the reference tissue and set at 1. Letter a denotes significantly different (P < 0.05) from WAT; b denotes significantly different (P < 0.05) from BAT; c denotes significantly different (P < 0.05) from Abd PVAT; and d denotes significantly different (P < 0.05) from Thor PVAT.
Fig. 5.
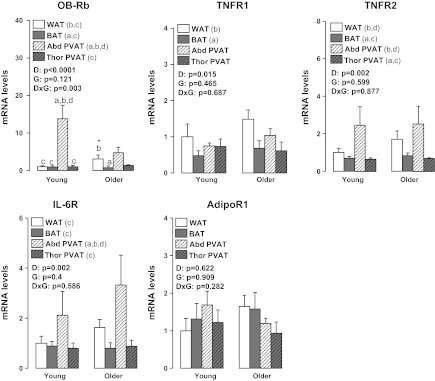
Effects of adipose tissue depots on expression of inflammatory receptor-related genes in young and older adult rats. Values are expressed as means ± SE. WAT in the young group of rats is used as the reference tissue and set at 1. OB-Rb, leptin receptor; TNFR1, tumor necrosis factor receptor 1; TNFR2, tumor necrosis factor receptor 2; IL-6R, interleukin 6 receptor; AdipoR1, adiponectin receptor 1; DxG, fat depot by group interaction effect. Letter a denotes significantly different (P < 0.05) from WAT; b denotes significantly different (P < 0.05) from BAT; c denotes significantly different (P < 0.05) from Abd PVAT; and d denotes significantly different (P < 0.05) from Thor PVAT.
Fig. 6.
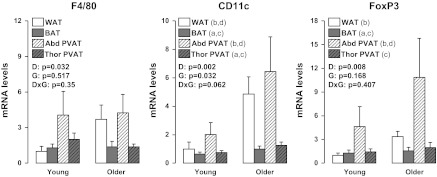
Effects of adipose tissue depots on expression of immune cell infiltration-related genes in young and older adult rats. Values are expressed as means ± SE. WAT in the young group of rats is used as the reference tissue and set at 1. FoxP3, forkhead box P3; a denotes significantly different (P < 0.05) from WAT; b denotes significantly different (P < 0.05) from BAT; c denotes significantly different (P < 0.05) from Abd PVAT; and d denotes significantly different (P < 0.05) from Thor PVAT.
Fig. 8.
Effects of aging on leptin gene expression across all adipose tissue depots. Values are expressed as means ± SE. Data are expressed as fold difference from young rats (i.e., dotted line) within each fat depot. *Older rats significantly different (P < 0.05) from young.
DISCUSSION
The purpose of this study was to perform a direct detailed comparison between PVAT depots surrounding different regions of the rat aorta using visceral white and subscapular brown adipose tissue as reference tissues. We found that expression of inflammatory genes and markers of immune cell infiltration were greater in abdominal PVAT than in thoracic PVAT, and that overall, abdominal and thoracic PVATs resembled the phenotype of WAT and BAT, respectively. Examination of the tissue with standard histology and electron microscopy indicated structural similarity between white and abdominal PVAT and between brown and thoracic PVAT. Examination of differences between groups indicated age-related increases in adipocyte size in white and abdominal PVAT and lipid deposition in BAT and thoracic PVAT. These effects were largely independent of age-related changes in gene expression in these depots, with the notable exceptions of leptin (a potent proinflammatory adipokine) and CD11c (a marker of proinflammatory macrophages), in which mRNA expression was elevated with aging.
Understanding the factors responsible for the heterogeneous distribution of atherosclerosis throughout the arterial tree is an area of intense investigation. A factor that has received extensive attention as a local regulator of vascular cell phenotype is shear stress (5, 22, 48, 50, 52). Nonetheless, the observation that even arteries with similar structure and presumably exposed to comparable hemodynamic forces exhibit distinct vascular phenotypes (2, 42) suggests the idea that other local factors besides shear stress influence the regulation of vascular health. A putative candidate is PVAT. Indeed, because it is recognized that adipose tissue adjacent to the vessel wall of large conduit arteries is implicated in the pathogenesis of vascular disease through the local secretion of proinflammatory cytokines (6, 8, 13, 14, 28, 34, 35, 45), it is possible that phenotypic differences in local PVAT depots may contribute to differences in disease susceptibility among arteries and even regions within an artery. The role of PVAT in modulating vascular cell phenotype is supported by data indicating that atherosclerotic lesions primarily develop in arteries encased by PVAT (15), and studies reporting a relationship between PVAT volume and the severity of vascular disease (14, 17). In vitro experiments also indicate that the detrimental effect of PVAT on vascular function is markedly exacerbated in obese swine with metabolic syndrome (34). Other studies have also documented similar effects of PVAT from obese rodents on vascular function in aortic (25) and mesenteric arteries (18, 26). With the increasing evidence that PVAT plays an important role in the modulation of vascular disease susceptibility, the need to further understand the extent to which the phenotype of PVAT varies along the arterial wall appears fundamental.
Herein, we provide evidence that thoracic and abdominal PVATs display striking differences in their phenotype, thus suggesting that they differ markedly in their potential to modulate the health of the underlying vascular cells. In particular, at the structural level (Figs. 2 and 3), we found that PVAT surrounding thoracic aortas was composed of multilocular brown adipocytes and abundant mitochondria, whereas adipocytes surrounding abdominal aortas were primarily unilocular, thus resembling WAT. Our observations using electron microscopy confirm the findings by Police et al. (37) using histological measures in a mouse model. At the molecular level (Figs. 4 to 7), we found that expression of inflammatory genes, including leptin, TNF-α, MCP-1, IL-6, IL-18, OB-Rb, TNFR2, IL-6R, as well as markers of immune cell infiltration, such as F4/80, CD11c, and FoxP3, were greater in abdominal PVAT than thoracic PVAT. As expected, expression of anti-inflammatory genes, such as IL-10 and IL1-RA, which typically track with changes in inflammation were also elevated in abdominal PVAT. Notably, the magnitude of these between-PVAT differences in gene expression was similar to those observed when comparing epididymal WAT vs. subscapular BAT. Furthermore, we found that expression of UCP-1 mRNA, a marker of BAT, was greatly increased in thoracic PVAT and subscapular BAT, but not in abdominal PVAT and epididymal WAT. Together, these data provide strong evidence that abdominal and thoracic PVAT depots exhibit divergent phenotypic features distinguished by their similarity with white and brown adipose tissues, respectively.
Another important question that we addressed in the present study was whether differences among fat depots were modulated with sedentary aging and the associated comorbidities, such as increased adiposity. This was accomplished by studying young adult and older adult rats exposed to standard laboratory conditions; that is, an environment characterized by inactivity and continuous access to food (27). These conditions, although routine standard of care for laboratory animals, have been described by others as “metabolically morbid” (27). Hence, we mimicked the natural progression of obesity that occurs during adulthood in Western cultures. Relative to the young rats, our older adult rats were markedly obese, hypercholesterolemic, insulin resistant, and exhibited increased circulating levels of cytokines, such as leptin and MCP-1 (Table 2), as well as impaired aortic endothelium-dependent relaxation (Fig. 1). Older obese rats also exhibited increased adipocyte size in abdominal PVAT and visceral white adipose tissue, as well as increased lipid deposition in thoracic PVAT and BAT (Figs. 2 and 3). Contrary to what would be expected in an obese dysregulated metabolic state, except for leptin and CD11c, adipose tissue expansion induced by sedentary aging was not accompanied by robust increases in the expression of other inflammatory genes and/or markers of macrophage cell infiltration in all fat depots that we examined. It should be acknowledged here that this study was not intended to investigate adipose tissue inflammation in the traditional high-fat diet (HFD)-induced obesity model (11, 37), but rather to characterize adipose tissue depot differences in a model of normal aging. In fact, many studies that provide evidence of extensive inflammation in adipose tissue depots have used commercial HFDs, which are high in saturated fatty acids; these fatty acids are known to directly induce an inflammatory adipose tissue phenotype (39). Thus, it appears that high-fat feeding may be more injurious to the adipose tissue than the obesity resulting from standard rodent housing conditions as used in the present study. Although our results generally do not indicate that the adipose tissue of the old rats is more inflamed than that of the young rats, we believe the differences in expression of CD11c and leptin genes that are upregulated in the older obese rat are important because that CD11c upregulation in adipose tissue has been shown to be associated with the onset of insulin resistance (49), which we observe in this model.
The increased expression of leptin in older adult rats was particularly remarkable in thoracic PVAT and subscapular BAT (Fig. 8), suggesting that brown-like adipose tissue depots, like white fat, have the capacity to upregulate expression of leptin in the obese state. Our finding of increased expression of leptin in adipose tissue is especially important in light of the vast amount of literature supporting a proatherogenic role of leptin when secreted in excess (i.e., hyperleptinemia) (1, 3, 9, 19–21, 33, 38, 43, 44, 51). It is possible that the thoracic aorta endothelial dysfunction observed in our group of older obese rats (Fig. 1) was mediated, in part, by the increased adipose tissue expression and secretion of leptin into circulation. Indeed, plasma levels of leptin were ∼5-fold higher in older adult rats compared with young (Table 2). Notably, we have recently shown that secretion of leptin from visceral adipose tissue correlates well with plasma levels of leptin (16). Furthermore, because sedentary aging induced a ∼6-fold increase in thoracic PVAT leptin gene expression, it is also plausible that the blunted endothelial function in the thoracic aorta was locally mediated by enhanced leptin signaling from the adjacent PVAT. In this regard, there is direct evidence that implicates PVAT-derived leptin as a potential contributor to vascular dysfunction. Payne et al. (34) elegantly demonstrated that epicardial PVAT exacerbated endothelial dysfunction in arteries from swine with metabolic syndrome; however, PVAT-induced impairment of vascular function was reversed with a recombinant leptin antagonist.
Future experiments are needed to establish whether and/or the extent to which phenotypic differences in thoracic vs. abdominal PVAT contribute to differences in vascular phenotype between these two regions of the aorta. In this context, functional studies in vitro should evaluate whether the presence or absence of thoracic vs. abdominal PVAT differentially alters the vasomotor responses to dilatory and constricting agents. In addition, further research is warranted to determine whether advanced aging produces more robust changes in adipose tissue phenotype to those observed in the present study using adult rats. Finally, the influence of aging on adipose tissue immune cell inflammation should be assessed in future studies using comprehensive phenotyping through highly sensitive techniques, such as fluorescence-activated cell sorting analysis.
Perspectives and Significance
In summary, we provide evidence that expression of inflammatory genes and markers of immune cell infiltration are greater in abdominal PVAT than in thoracic PVAT, and that, generally, abdominal and thoracic PVATs resemble the phenotype of WAT and BAT, respectively. These findings are relevant when considering that in large animals and humans, the abdominal aorta is more vulnerable to atherosclerosis than the thoracic aorta (10, 30, 36). While it is likely that differences in disease susceptibility between these two arterial regions are largely attributed to known differences in shear stress profiles (7, 30, 31, 36, 46, 47), the current data stimulate the hypothesis that phenotypic differences in PVAT depots may also contribute to the heterogeneous distribution of atherosclerosis throughout the aorta.
GRANTS
This work was supported by National Institutes of Health (NIH) Grant RO1-HL-036088 (to M. H. Lauglin), American Heart Association Grant 11POST5080002 (to J. Padilla), NIH T32-AR048523 (to N. T. Jenkins), and University of Missouri Institute for Clinical and Translational Sciences (to J. Padilla).
DISCLOSURES
No conflicts of interest, financial or otherwise, are declared by the authors.
AUTHOR CONTRIBUTIONS
Author contributions: J.P. and N.T.J. conception and design of research; J.P. and N.T.J. performed experiments; J.P. and N.T.J. analyzed data; J.P., N.T.J., V.J.V.P., and M.H.L. interpreted results of experiments; J.P. prepared figures; J.P. drafted manuscript; J.P., N.T.J., V.J.V.P., and M.H.L. edited and revised manuscript; J.P., N.T.J., V.J.V.P., and M.H.L. approved final version of manuscript.
ACKNOWLEDGMENTS
The authors are grateful to Pam Thorne, Claire Manse, Nick Fleming, Juliana Vinson, and Tommi White for their technical assistance on this project. We also thank Dr. Frank Booth for providing us with the animals.
REFERENCES
- 1.Beltowski J. Leptin and the regulation of endothelial function in physiological and pathological conditions. Clin Exp Pharmacol Physiol 39: 168–178, 2012 [DOI] [PubMed] [Google Scholar]
- 2.Blair JM, Glagov S, Zarins CK. Mechanisms of superficial femoral artery adductor canal stenosis. Surg Forum 41: 359–360, 1990 [Google Scholar]
- 3.Bouloumie A, Marumo T, Lafontan M, Busse R. Leptin induces oxidative stress in human endothelial cells. FASEB J 13: 1231–1238, 1999 [PubMed] [Google Scholar]
- 4.Bunker A, Arce-Esquivel AA, Rector RS, Booth FW, Ibdah JA, Laughlin MH. Physical activity maintains aortic endothelium dependent relaxation in the obese, type 2 diabetic OLETF rat. Am J Physiol Heart Circ Physiol 298: H1889–H1901, 2010 [DOI] [PMC free article] [PubMed] [Google Scholar]
- 5.Caro CG, Fitz-Gerald JM, Schroter RC. Arterial wall shear and distribution of early atheroma in man. Nature 223: 1159–1161, 1969 [DOI] [PubMed] [Google Scholar]
- 6.Chatterjee TK, Stoll LL, Denning GM, Harrelson A, Blomkalns AL, Idelman G, Rothenberg FG, Neltner B, Romig-Martin SA, Dickson EW, Rudich S, Weintraub NL. Proinflammatory phenotype of perivascular adipocytes. Circ Res 104: 541–549, 2009 [DOI] [PMC free article] [PubMed] [Google Scholar]
- 7.Cheng CP, Herfkens RJ, Taylor CA. Abdominal aortic hemodynamic conditions in healthy subjects aged 50–70 at rest and during lower limb exercise: in vivo quantification using MRI. Atherosclerosis 168: 323–331, 2003 [DOI] [PubMed] [Google Scholar]
- 8.Cheng KH, Chu CS, Lee KT, Lin TH, Hsieh CC, Chiu CC, Voon WC, Sheu SH, Lai WT. Adipocytokines and proinflammatory mediators from abdominal and epicardial adipose tissue in patients with coronary artery disease. Int J Obes 32: 268–274, 2008 [DOI] [PubMed] [Google Scholar]
- 9.Cirillo P, Angri V, De Rosa S, Cali G, Petrillo G, Maresca F, D'Ascoli GL, Maietta P, Brevetti L, Chiariello M. Pro-atherothrombotic effects of leptin in human coronary endothelial cells. Thromb Haemost 103: 1065–1075, 2010 [DOI] [PubMed] [Google Scholar]
- 10.Civelek M, Grant GR, Irolla CR, Shi C, Riley RJ, Chiesa OA, Stoeckert CJ, Karanian JW, Pritchard WF, Davies PF. Prelesional arterial endothelial phenotypes in hypercholesterolemia: universal ABCA1 upregulation contrasts with region-specific gene expression in vivo. Am J Physiol Heart Circ Physiol 298: H163–H170, 2010 [DOI] [PMC free article] [PubMed] [Google Scholar]
- 11.Fitzgibbons TP, Kogan S, Aouadi M, Hendricks GM, Straubhaar J, Czech MP. Similarity of mouse perivascular and brown adipose tissue and their resitance to diet-induced inflammation. Am J Physiol Heart Circ Physiol 301: H1425–H1437, 2011 [DOI] [PMC free article] [PubMed] [Google Scholar]
- 12.Galvez-Prieto B, Bolbrinker J, Stucchi P, De las Heras AI, Merino B, Arribas S, Ruiz-Gayo M, Huber M, Wehland M, Kreutz R, Fernandez-Alfonso MS. Comparative expression analysis of the renin-angiotensin system components between white and brown perivascular adipose tissue. J Endocrinol 197: 55–64, 2008 [DOI] [PubMed] [Google Scholar]
- 13.Gorter PM, van Lindert AS, de Vos AM, Meijs MF, van der Graaf Y, Doevendans PA, Prokop M, Visseren FL. Quantification of epicardial and peri-coronary fat using cardiac computed tomography: reproducibility and relation with obesity and metabolic syndrome in patients suspected of coronary artery disease. Atherosclerosis 197: 896–903, 2008 [DOI] [PubMed] [Google Scholar]
- 14.Greif M, Becker A, von Ziegler F, Lebherz C, Lehrke M, Broedl UC, Tittus J, Parhofer K, Becker C, Reiser M, Knez A, Leber AW. Pericardial adipose tissue determined by dual source CT is a risk factor for coronary atherosclerosis. Arterioscler Thromb Vasc Biol 29: 781–786, 2009 [DOI] [PubMed] [Google Scholar]
- 15.Ishikawa Y, Ishii T, Asuwa N, Masuda S. Absence of atherosclerosis evolution in the coronary arterial segment covered by myocardial tissue in cholesterol-fed rabbits. Virchows Arch 430: 163–171, 1997 [DOI] [PubMed] [Google Scholar]
- 16.Jenkins NT, Padilla J, Arce-Esquivel AA, Bayless DS, Martin JS, Leidy HJ, Booth FW, Rector RS, Laughlin MH. Effects of endurance exercise training, metformin, and their combination on adipose tissue leptin and IL-10 secretion in OLETF rats. J Appl Physiol 113: 1873–1883, 2012 [DOI] [PMC free article] [PubMed] [Google Scholar]
- 17.Jeong JW, Jeong MH, Yun KH, Oh SK, Park EM, Kim YK, Rhee SJ, Lee EM, Lee J, Yoo NJ, Kim NH, Park JC. Echocardiographic epicardial fat thickness and coronary artery disease. Circ J 71: 536–539, 2007 [DOI] [PubMed] [Google Scholar]
- 18.Ketonen J, Shi J, Martonen E, Mervaala E. Periadventitial adipose tissue promotes endothelial dysfunction via oxidative stress in diet-induced obese C57BL/6. Circ J 74: 1479–1487, 2010 [DOI] [PubMed] [Google Scholar]
- 19.Knudson JD, Dincer UD, Zhang C, Swafford AN, Koshida R, Picchi A, Focardi M, Dick GM, Tune JD. Leptin receptors are expressed in coronary arteries, and hyperleptinemia causes significant coronary endothelial dysfunction. Am J Physiol Heart Circ Physiol 289: H48–H56, 2005 [DOI] [PubMed] [Google Scholar]
- 20.Knudson JD, Payne GA, Borbouse L, Tune JD. Leptin and mechanisms of endothelial dysfunction and cardiovascular disease. Curr Hypertens Rep 10: 434–439, 2008 [DOI] [PubMed] [Google Scholar]
- 21.Korda M, Kubant R, Patton S, Malinski T. Leptin-induced endothelial dysfunction in obesity. Am J Physiol Heart Circ Physiol 295: H1514–H1521, 2008 [DOI] [PMC free article] [PubMed] [Google Scholar]
- 22.Ku DN, Giddens DP, Zarins CK, Glagov S. Pulsatile flow and atherosclerosis in the human carotid bifurcation. Positive correlation between plaque location and low oscillatory shear stress. Atherosclerosis 5: 293–302, 1985 [DOI] [PubMed] [Google Scholar]
- 23.Lau DCW, Dhillon B, Yan H, Szmitko PE, Verma S. Adipokines: molecular links between obesity and atheroslcerosis. Am J Physiol Heart Circ Physiol 288: H2031–H2041, 2005 [DOI] [PubMed] [Google Scholar]
- 24.Li FY, Cheng KK, Lam KS, Vanhoutte PM, Xu A. Cross-talk between adipose tissue and vasculature: role of adiponectin. Acta Physiol (Oxf) 203: 167–180, 2011 [DOI] [PubMed] [Google Scholar]
- 25.Ma L, Ma S, He H, Yang D, Chen X, Luo Z, Liu D, Zhu Z. Perivascular fat-mediated vascular dysfunction and remodeling through the AMPK/m TOR pathway in high-fat diet-induced obese rats. Hypertens Res 33: 446–453, 2010 [DOI] [PubMed] [Google Scholar]
- 26.Marchesi C, Ebrahimian T, Angulo O, Paradis P, Schiffrin EL. Endothelial nitric oxide synthase uncoupling and perivascular adipose oxidative stress and inflammation contribute to vascular dysfunction in a rodent model of metabolic syndrome. Hypertension 54: 1384–1392, 2009 [DOI] [PubMed] [Google Scholar]
- 27.Martin B, Ji S, Maudsley S, Mattson MP. “Control” laboratory rodents are metabolically morbid: Why it matters. Proc Natl Acad Sci USA 107: 6127–6133, 2009 [DOI] [PMC free article] [PubMed] [Google Scholar]
- 28.Mazurek T, Zhang L, Zalewski A, Mannion JD, Diehl JT, Arafat H, Sarov-Blat L, O'Brien S, Keiper EA, Johnson AG, Martin J, Goldstein BJ, Shi Y. Human epicardial adipose tissue is a source of inflammatory mediators. Circulation 108: 2460–2466, 2003 [DOI] [PubMed] [Google Scholar]
- 29.Montero D, Walther G, Perez-Martin A, Roche E, Vinet A. Endothelial dysfunction, inflammation, and oxidative stress in obese children and adolescents: markers and effect of lifestyle intervention. Obes Rev 13: 441–455, 2012 [DOI] [PubMed] [Google Scholar]
- 30.Moore JE, Xu C, Glagov S, Zarins CK, Ku DN. Fluid wall shear stress measurements in a model of the human abdominal aorta: oscillatory behavior and relationship to atherosclerosis. Atherosclerosis 110: 225–240, 1994 [DOI] [PubMed] [Google Scholar]
- 31.Oyre S, Pedersen EM, Ringgaard S, Boesiger P, Paaske WP. In vivo wall shear stress measured by magnetic resonance velocity mapping in the normal human abdominal aorta. Eur J Vasc Endovasc Surg 13: 263–271, 1997 [DOI] [PubMed] [Google Scholar]
- 32.Padilla J, Jenkins NT, Roberts MD, Arce-Esquivel AA, Martin JS, Laughlin MH, Booth FW. Differential changes in vascular mRNA levels between rat iliac and renal arteries produced by cessation of voluntary running. Exp Physiol 98: 337–347, 2013 [DOI] [PMC free article] [PubMed] [Google Scholar]
- 33.Payne GA, Borbouse L, Kumar S, Neeb Z, Alloosh M, Sturek M, Tune JD. Epicardial perivascular adipose-derived leptin exacerbates coronary endothelial dysfunction in metabolic syndrome via a protein kinase C-beta pathway. Arterioscler Thromb Vasc Biol 30: 1711–1717, 2010 [DOI] [PMC free article] [PubMed] [Google Scholar]
- 34.Payne GA, Borbouse Ln Kumar S, Neeb Z, Alloosh M, Sturek M, Tune JD. Epicardial perivascular adipose-derived leptin exacerbates coronary endothelial dysfunction in metabolic syndrome via a protein kinase C-β pathway. Arterioscler Thromb Vasc Biol 30: 1711–1717, 2012 [DOI] [PMC free article] [PubMed] [Google Scholar]
- 35.Payne GA, Kohr MC, Tune JD. Epicardial perivascular adipose tissue as a therapeutic target in obesity-related coronary artery disease. Br J Pharmacol 165: 659–669, 2012 [DOI] [PMC free article] [PubMed] [Google Scholar]
- 36.Pedersen EM, Oyre S, Agerbaek M, Kristensen IB, Ringgaard S, Boesiger P, Paaske WP. Distribution of early atherosclerostic lesions in the human abdominal aorta correlates with wall shear stresses measured in vivo. Eur J Vasc Endovasc Surg 18: 328–333, 1999 [DOI] [PubMed] [Google Scholar]
- 37.Police SB, Thatcher SE, Charnigo R, Daugherty A, Cassis LA. Obesity promotes inflammation in periaortic adipose tissue and angiotensin II-induced abdominal aortic aneurysm formation. Arterioscler Thromb Vasc Biol 29: 1458–1464, 2009 [DOI] [PMC free article] [PubMed] [Google Scholar]
- 38.Quehenberger P, Exner M, Sunder-Plassmann R, Ruzicka K, Bieglmayer C, Endler G, Muellner C, Speiser W, Wagner O. Leptin induces endothelin-1 in endothelial cells in vitro. Circ Res 90: 711–718, 2002 [DOI] [PubMed] [Google Scholar]
- 39.Rahman SM, Janssen RC, Choudhury M, Baquero KC, Aikens RM, de la Houssaye BA, Friedman JE. CCAA/enhancer-binding protein beta (C/EBP beta) expression regulates dietary-induced inflammation in macrophages and adipose tissue in mice. J Biol Chem 287: 34349–34360, 2012 [DOI] [PMC free article] [PubMed] [Google Scholar]
- 40.Ronti T, Lupattelli G, Mannarino E. The endocrine function of adipose tissue: an update. Clin Endocrinol 64: 355–365, 2006 [DOI] [PubMed] [Google Scholar]
- 41.Sato T. A modified method for lead staining of thin sections. J Electron Microsc (Tokyo) 17: 158–159, 1968 [PubMed] [Google Scholar]
- 42.Simmons GH, Padilla J, Laughlin MH. Heterogeneity of endothelial cell phenotype within and amongst conduit vessels of the swine vasculature. Exp Physiol 97: 1074–1082, 2012 [DOI] [PubMed] [Google Scholar]
- 43.Singh P, Peterson TE, Barber KR, Kuniyoshi FS, Jensen A, Hoffmann M, Shamsuzzaman ASM, Somers VK. Leptin upregulates the expression of plasminogen activator inhibitor-1 in human vascular endothelial cells. Biochem Biophys Res Commun 392: 47–52, 2010 [DOI] [PMC free article] [PubMed] [Google Scholar]
- 44.Singh P, Peterson TE, Sert-Kuniyoshi FH, Jensen MD, Somers VK. Leptin upregulates caveolin-1 expression: Implications for development of atherosclerosis. Atherosclerosis 217: 499–502, 2011 [DOI] [PMC free article] [PubMed] [Google Scholar]
- 45.Szasz T, Webb RC. Perivascular adipose tissue: more than just structural support. Clin Sci 122: 1–12, 2012 [DOI] [PMC free article] [PubMed] [Google Scholar]
- 46.Tang BT, Cheng CP, Draney MT, Wilson NM, Tsao PS, Herfkens RJ, Taylor CA. Abdominal aortic hemodynamics in young healthy adults at rest and during lower limb exercise: quantification using image-based computer modeling. Am J Physiol Heart Circ Physiol 291: H668–H676, 2006 [DOI] [PubMed] [Google Scholar]
- 47.Taylor CA, Cheng CP, Espinosa LA, Tang BT, Parker D, Herfkens R. In vivo quantification of blood flow and wall shear stress in the human abdominal aorta during lowe limb exercise. Annals Biomed Eng 30: 402–408, 2002 [DOI] [PubMed] [Google Scholar]
- 48.Van der Laan PA, Reardon CA, Getz GS. Site specificity of atherosclerosis: site-selective responses to atherosclerotic modulators. Arterioscler Thromb Vasc Biol 24: 12–22, 2004 [DOI] [PubMed] [Google Scholar]
- 49.Vieira Potter V, Strissel KJ, Xie C, Chang E, Bennett G, Defuria J, Obin MS, Greenberg AS. Adipose tissue inflammation and reduced insulin sensitivity in ovariectomized mice occurs in the absence of increased adiposity. Endocrinology 153: 4266–4277, 2012 [DOI] [PMC free article] [PubMed] [Google Scholar]
- 50.Wissler WR, Strong JP. Risk factors and progression of atherosclerosis in youth. Am J Pathol 153: 1023–1033, 1998 [DOI] [PMC free article] [PubMed] [Google Scholar]
- 51.Yang R, Barouch LA. Leptin signaling and obesity. Circ Res 101: 545–559, 2007 [DOI] [PubMed] [Google Scholar]
- 52.Zarins CK, Giddens DP, Bharadvaj BK, Sottiurai VS, Mabon RF, Glagov S. Carotid bifurcation atherosclerosis. Quantitative correlation of plaque localization with flow velocity profiles and wall shear stress. Circ Res 53: 502–514, 1983 [DOI] [PubMed] [Google Scholar]


