

Abstract
Neural dynamics generated within cortical networks play a fundamental role in brain function. However, the learning rules that allow recurrent networks to generate functional dynamic regimes, and the degree to which these regimes are themselves plastic, are not known. In this study we examined plasticity of network dynamics in cortical organotypic slices in response to chronic changes in activity. Studies have typically manipulated network activity pharmacologically; we used chronic electrical stimulation to increase activity in in vitro cortical circuits in a more physiological manner. Slices were stimulated with “implanted” electrodes for 4 days. Chronic electrical stimulation or treatment with bicuculline decreased spontaneous activity as predicted by homeostatic learning rules. Paradoxically, however, whereas bicuculline decreased evoked network activity, chronic stimulation actually increased the likelihood that evoked stimulation elicited polysynaptic activity, despite a decrease in evoked monosynaptic strength. Furthermore, there was an inverse correlation between spontaneous and evoked activity, suggesting a homeostatic tradeoff between spontaneous and evoked activity. Within-slice experiments revealed that cells close to the stimulated electrode exhibited more evoked polysynaptic activity and less spontaneous activity than cells close to a control electrode. Collectively, our results establish that chronic stimulation changes the dynamic regimes of networks. In vitro studies of homeostatic plasticity typically lack any external input, and thus neurons must rely on “spontaneous” activity to reach homeostatic “set points.” However, in the presence of external input we propose that homeostatic learning rules seem to shift networks from spontaneous to evoked regimes.
Keywords: chronic stimulation, homeostatic, network, organotypic slices, spontaneous activity
the brain's ability to perform complex computations emerges in part from the complex dynamic patterns generated within recurrently connected networks of neurons. Controlling this dynamics poses a challenging, and as yet unresolved, computational problem (Buonomano and Maass 2009; Pearlmutter 1995). However, it is generally accepted that homeostatic forms of plasticity likely play a critical role in governing dynamics in recurrent networks (Buonomano 2005; Houweling et al. 2005; Kawaguchi and Kubota 1997; Lazar et al. 2009; Renart et al. 2003; Turrigiano et al. 1998).
Implicit in the notion of homeostatic plasticity is that neurons exhibit some activity “set point” and that mechanisms are in place to up- or down-modulate the average activity in a neuron to achieve this set point (Desai 2003; Pozo and Goda 2010; Turrigiano 2008; van Rossum et al. 2000). In the absence of any external input, activity must be self-generated, that is, “spontaneous.” Studies of homeostatic plasticity in in vitro systems have relied primarily on global pharmacological manipulations of activity, and given the absence of external input, plasticity mechanisms aimed at achieving homeostatic set points must alter levels of spontaneous activity. However, in vivo neural networks are seldom devoid of all “external” input; sensory manipulation studies reveal synaptic plasticity of sensory inputs or the inputs from neighboring cortical areas (Benedetti et al. 2009; Buonomano and Merzenich 1998a; Feldman 2009; Hickmott and Steen 2005). Therefore, in vivo, set points are presumed to be reached primarily by adjusting responses to inputs arriving from different brain regions. In vivo homeostatic plasticity studies, however, suffer from the limitation that the source and levels of external activity of a sensory-deprived cortical area, for example, cannot be measured or carefully controlled. In this study we examined whether chronic increases in network activity produced by external stimulation would affect the spontaneous and evoked regimes of network activity. Toward this end we used an experimental technique that allowed administration of chronic electrical stimulation to organotypic slices (Johnson and Buonomano 2009; Johnson et al. 2010). Organotypic slices were used for two reasons: first, the neuronal architecture, electrophysiology, and network dynamics more closely reflect what is observed in vivo compared with dissociated cultures; second, organotypic slices offer a unique opportunity to control the input and perform long-term manipulations (De Simoni et al. 2003; Gahwiler et al. 1997; Pozo and Goda 2010). We determined that pharmacological blockade of network activity enhanced spontaneous activity while increasing network activity through chronic application of bicuculline or electrical stimulation did indeed decrease spontaneous activity. However, electrical and pharmacological treatments produced opposite effects on evoked network (polysynaptic) activity: while bicuculline decreased evoked polysynaptic activity, electrical stimulation resulted in an increase in evoked polysynaptic activity. This increase in evoked polysynaptic activity was observed despite a decrease in evoked monosynaptic excitatory postsynaptic potential (EPSP) amplitude. In addition, we report that different regimes of spontaneous activity seem to be differentially regulated; pharmacological and electrical manipulations produced similar effects on total spontaneous activity but differential effects on spontaneous Up states.
These results are consistent with the notion that networks rely on a balance between spontaneous and evoked activity to drive their average activity levels toward homeostatic set points and that in the presence of external input neural circuits can decrease spontaneous activity yet increase evoked network activity. Furthermore, our results highlight the potential difference in studying homeostatic plasticity in feedforward and recurrent networks. Theoretical work reveals that controlling network dynamics is significantly more complex in recurrent networks such as the neocortex compared with primarily feedforward circuits such as the CA1 region of the hippocampus (Frohlich et al. 2008; Kim and Tsien 2008; Liu and Buonomano 2009; Mitra et al. 2012). Indeed, our results suggest that in recurrent networks a number of different learning rules are likely operating in an orchestrated manner to simultaneously decrease spontaneous activity while increasing evoked polysynaptic activity.
MATERIALS AND METHODS
Organotypic slice preparation with implanted microelectrodes.
Organotypic slices were prepared using the interface method (Johnson and Buonomano 2007; Stoppini et al. 1991) and maintained on culture inserts with attached microelectrodes (Johnson and Buonomano 2009). All animal procedures followed the National Institutes of Health guidelines and were approved by the University of California, Los Angeles Institutional Animal Care and Use Committee. Briefly, 7-day-old Sprague-Dawley rats were anesthetized with isoflurane and decapitated. The brain was removed and placed in chilled cutting medium. Coronal slices (400-μm thickness) containing primary somatosensory or auditory cortex were cut using a vibratome. Each slice was placed on a cell culture insert with two attached electrodes and positioned so that the electrodes were under the slice with the tips separated by ∼2 mm and located 400–800 μm from the cortical surface. These electrodes were used to deliver chronic stimulation for 4 days in the incubator, as well as to provide stimulation during testing on the rig. Culture medium was changed 1 and 24 h after cutting and every 2–3 days thereafter. Cutting medium consisted of Eagle's minimum essential medium (EMEM; catalog no. 15-010, MediaTech) plus (final concentration in mM) 3 MgCl2, 10 glucose, 25 HEPES, and 10 Tris base. Culture medium consisted of EMEM plus (final concentration in mM) 1 glutamine, 2.6 CaCl2, 2.6 MgSO4, 30 glucose, 30 HEPES, 0.5 ascorbic acid, 20% horse serum, 10 U/l penicillin, and 10 μg/l streptomycin. Slices were incubated in 5% CO2 at 35°C for 14–22 days before stimulation or drug incubation was begun.
Drug incubation.
Slices were incubated in culture medium containing dl-2-amino-5-phosphonovaleric acid (APV; 50 μM) and 6-cyano-7-nitroquinoxaline-2,3-dione (CNQX; 50 μM) or bicuculline (10–20 μM; we did not observe any statistical difference in slices that were incubated in either 10 or 20 μM bicuculline, and therefore the data from both groups were pooled) for 4 days before recordings were done. Drugs were refreshed every 24 h, as was the medium for the control sister slices. Recordings were done at 18–26 days in vitro (DIV) in the absence of drugs. Drugs were washed out for at least 20 min on the rig before the beginning of data acquisition.
Chronic stimulation.
Electrical stimulation via microelectrodes consisted of charge-balanced, biphasic current pulses, composed of a 100-μs positive pulse followed by a 100-μs delay and a 100-μs negative pulse (Wagenaar et al. 2004). The microelectrodes were positioned 2 mm apart to prevent pathway overlap (Johnson and Buonomano 2009). Chronic stimulation consisted of a 100-Hz burst of 5 pulses presented via the implanted electrodes (150 μA). Intensities were chosen on the basis of earlier experiments demonstrating that with smaller stimulation currents, chronic stimulation did not result in plasticity of evoked EPSPs (Johnson and Buonomano 2009). Training stimuli usually elicited a large subthreshold multicomponent PSP. To estimate the average effect of stimulation on activity, we estimated the activity in a 10-s window in the absence and presence of a single bout of stimulation during that 10-s window on the rig. Across a sample of 8 cells, the average number of events in 10 s was 1.29 ± 0.37 in the absence of stimulation and 2.43 ± 0.35 in the presence of stimulation (P < 0.0003). There was also a significant increase in the time above threshold measure (see below) (31.03 ± 11.9 vs. 269.83 ± 36.8 ms, P < 0.0005). Stimulation did not produce a significant increase in the number of spikes in the 10-s window (absence of stimulation: 0.25 ± 0.25; presence of stimulation: 0.5 ± 0.3).
For Figs. 1–5, slices were implanted with one electrode, but in a few cases (4 slices) they were implanted with two electrodes. Since the implanted microelectrodes were used not only to deliver chronic stimulation but also to provide stimulation during recording, pharmacologically treated and all control slices were also implanted with a single electrode. Data were obtained from whole cell recordings made close to (<300 μm) the implanted electrode. In Figs. 7 and 8 (within-slice experiment), slices were implanted with two electrodes and chronic stimulation was delivered via one electrode while the other electrode was silent and served as the control. The stimulated and control groups consisted of data obtained from whole cell recordings that were made close to the stimulating electrode and the nonstimulated electrode, respectively. Stimulation pulses were generated using a Master-8 pulse stimulator (A.M.P. Instruments) or custom-written MATLAB software controlling an analog-output board (PCI-6723, National Instruments) and were delivered via stimulus isolator units (A.M.P. Instruments). Chronic stimulation was administered while the cultures were in the incubator, for 4 days, before recording. Similar to the group of slices that were exposed to drugs, recordings were made from stimulated slices at 18–26 DIV. To reduce the differences due to slice variability, we ensured that “sister” slices were used for the experimental and control groups, wherein sister slices were derived from the same animal, maintained with the same culture medium and serum, and placed in the same incubator.
Fig. 1.

Chronic electrical stimulation decreases spontaneous activity. A: raw representative spontaneous trace from a cell from a control (left) and a chronically stimulated slice (right). B: spontaneous events as quantified by frequency were decreased in the stimulated group (t-test, ***P = 10−5). C: spontaneous activity as quantified by percent time above a predetermined threshold (5 mV above rest) (t-test, *P = 0.03) was decreased in the stimulated slices compared with the control slices. D: raw representative spontaneous traces from cells from control (left) and bicuculline-treated groups (right). E and F: spontaneous activity as quantified by frequency (t-test, ***P = 10−5) and percent time above threshold (t-test, ***P = 10−5), respectively, were decreased in the bicuculline group. Stim, stimulated group; Cont, control group; Bic, bicuculline-treated group; Thr, threshold.
Fig. 2.

Chronic electrical stimulation increases the relative proportion of Up states. A: number of Up States per second was unchanged between the control and electrically stimulated groups. B: there was an increase in the relative number of Up States in the stimulated group compared with the control (t-test, *P < 0.02). C and D: there was a decrease in Up-state frequency in the bicuculline-treated group (C; t-test, *P < 0.03); however, there was no change in the ratio of Up states (D).
Fig. 3.

Chronic electrical stimulation increases evoked network activity as measured by evoked polysynaptic events. A: raw representative excitatory postsynaptic potential (EPSP) trace (includes overlapping monosynaptic and polysynaptic events) from a cell from a control (top left) and a chronically stimulated slice (top right). All the raw evoked data collected from the control and stimulated groups are plotted as voltagegrams (bottom). Data are sorted according to the presence or absence of polysynaptic events, and the voltage value in each trace is normalized to its own peak. Note the increase in number of traces exhibiting polysynaptic activity in the stimulated group (right). B: the stimulated group showed a significant increase in number of polysynaptic events per cell (Wilcoxon test, **P < 0.01). C: bootstrap analysis (explained in detail in materials and methods) showed a significant difference in the polysynaptic events between the stimulated and control groups (***P < 10−4). The black dashed line represents the empirically derived difference in the mean number of polysynaptic events per trace (control minus stimulated). The gray histogram represents 10,000 simulations of this difference when the groups are composed of shuffled data. D: raw representative EPSP trace from a cell from a control (top left) and a bicuculline-treated slice (top right). All the raw evoked data collected from the control and bicuculline-treated groups are plotted as voltagegrams (bottom). Note the dramatic decrease in polysynaptic events in the bicuculline-treated group (right). E: the stimulated group showed a significant decrease in number of polysynaptic events per cell (Wilcoxon test, **P < 0.01). F: bootstrap analysis showed a significant difference in the distribution of polysynaptic peaks between the bicuculline-treated and control groups (***P < 10−4).
Fig. 4.

Frequency of spontaneous events was negatively correlated with the evoked polysynaptic events in the chronically stimulated group. There was a significant inverse correlation between the spontaneous and evoked polysynaptic events (R = −0.41, P = 0.014).
Fig. 5.

Chronic electrical stimulation decreases evoked EPSP strength as analyzed by input/output (I/O) function. A: representative evoked monosynaptic EPSPs from a control cell at 6 stimulation intensities superimposed (left) and the respective I/O curve constructed from the slope measurements of these 6 EPSPs (right). B: representative evoked monosynaptic EPSPs from a cell from a chronically stimulated slice at 6 stimulation intensities (left) and the respective I/O curve constructed from the slope measurements of these 6 EPSPs (right). Note the shift in I/O curve to the right in the stimulated cell. C: slope of initial EPSPs at different stimulation intensities was significantly decreased in the stimulated group compared with the control group (ANOVA: F1,68 = 13.1, P < 0.001). D: I/O function analysis shows a significant increase in the stimulation intensity that elicits half-maximal EPSPs (E50) (t-test, ***P < 10−4). E: there was a significant decrease in the estimated asymptote (t-test, *P < 0.04) in the stimulated group compared with the control group.
Fig. 7.
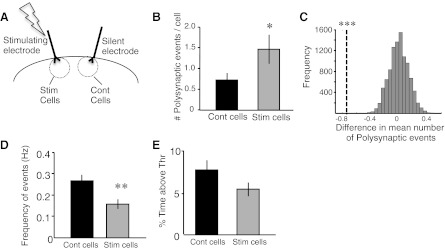
Increase in evoked polysynaptic response and decrease in spontaneous activity are local to the stimulating electrode. A: schematic showing the placement of stimulating and silent electrodes in the slice and the 2 populations of recorded cells. B: the stimulated group showed a significant increase in number of polysynaptic events in the cells close to the stimulating electrode (Wilcoxon test, *P < 0.05). Note all evoked responses were elicited by the “close” electrode. C: bootstrap analysis (explained in detail in materials and methods) showed a significant difference in the mean number of polysynaptic events per trace between the stimulated and control cells (***P < 10−4). D and E: spontaneous events as quantified by frequency were decreased (D; t-test, **P = 0.005), whereas there was a trend for a decrease in percent time above threshold (E; t-test, P = 0.11) in the stimulated group.
Fig. 8.

Decrease in evoked monosynaptic response is local to the stimulating electrode. A: schematic similar to Fig 7 showing the placement of stimulating and silent electrodes in the slice and the 2 populations of recorded cells. B: slope of monosynaptic EPSPs at different stimulation intensities was significantly decreased in the stimulated cells (close to stimulating electrode) compared with control cells (close to silent electrode) (ANOVA: F1,34 = 27.9, ***P = 10−6). C: I/O function analysis showed a significant increase in E50 (t-test, **P < 0.002). D: there was a significant decrease in the asymptote of the I/O function (t-test, *P < 0.02) in the stimulated cells compared with control cells.
Electrophysiology.
Whole cell recordings were made from layer 2/3 pyramidal neurons located less than 500 μm from the cortical surface using infrared-differential interference contrast visualization (Dong and Buonomano 2005). Experiments were carried out at 30°C, and a perfusion rate of 3 ml/min in artificial cerebrospinal fluid that was adjusted to match the culture medium (Johnson and Buonomano 2007) (concentration in mM): 125 NaCl, 5.1 KCl, 2.6 MgSO4, 26.1 NaHCO3, 1 NaH2PO4, 25 glucose, and 2.6 CaCl2. The internal solution for whole cell recordings contained (concentration in mM) 100 K-gluconate, 20 KCl, 4 ATP-Mg, 10 phosphocreatine, 0.3 GTP-Na, and 10 HEPES and was adjusted to pH 7.3 and 290–300 mOsm. Recordings were sampled at 10 kHz, digitized with custom-written MATLAB software controlling an analog-output board (PCI-6723, National Instruments), and saved for off-line analysis. All analyses were performed using custom-written software in MATLAB.
Only the cells that satisfied the following criteria were accepted for analysis: membrane potential ≤−60 mV, input resistance between 100 and 300 MΩ, and series resistance ≤20 MΩ. Cells were discarded if membrane potential, input resistance, or series resistance changed more than 15% during the course of recording.
Quantification of spontaneous activity.
For each cell, 5 min of spontaneous activity was recorded and quantified by frequency of events and percent time above a predetermined threshold. Spontaneous events were measured by previously defined criteria (Johnson and Buonomano 2007). Briefly, spontaneous events were distinguished on the basis of two criteria. The first was spontaneous network activity in which the membrane potential crossed a set threshold (5 mV) above resting membrane potential. This threshold excluded mini- and unitary EPSPs from the analyses and captured primarily network events arising from the activity of multiple presynaptic neurons. Second, the membrane potential can make several brief passes above and below the defined threshold of 5 mV within a short time window. To account for this, a minimum interevent interval of 100 ms was used as a criterion to define distinct events; hence, if the voltage fell below threshold for less than 100 ms, it was still classified as being the same event. The percent time above threshold was calculated as the total time the membrane potential spent above the 5-mV threshold. Although both the choice of the voltage threshold (5 mV) and interevent interval (100 ms) are important parameters for the analyses in Figs. 1, 6, and 7, the same conclusions are reached with parameters ranging from a voltage threshold of 2.5 to 10 mV and interevent intervals of 10 to 200 ms.
Fig. 6.

Activity blockade using dl-2-amino-5-phosphonovaleric acid and 6-cyano-7-nitroquinoxaline-2,3-dione (APV/CNQX) increases spontaneous activity and evoked EPSP strength. A: the APV/CNQX-treated group showed an increase in spontaneous events as quantified by frequency (t-test, ***P = 10−4). B: spontaneous activity as quantified by percent time above threshold (t-test, ***P = 10−5) was increased in the APV/CNQX-treated group compared with the control group. C: slope of initial EPSPs at different stimulation intensities was significantly increased in the APV/CNQX-treated group compared with the control group (ANOVA: F1,55 = 4.56, *P < 0.03). D: I/O function analysis showed a significant increase in E50 in the APV/CNQX-treated group (t-test, **P < 0.002). E: there was no change in the asymptote of the I/O curve between the 2 groups.
EPSP amplitude vs. stimulus intensity.
An input-output analysis was performed by measuring the slope of the initial EPSP to six different stimulation intensities. The stimulation intensity vs. slope plots were fit with a sigmoid function (Marder and Buonomano 2003). From the fit two parameters were determined: the asymptote (a measure of maximal response strength) and E50 (defined as the stimulation intensity that elicited a half-maximal response). Plots with incomplete data or that were not fit well with the sigmoid function were excluded from the analysis. Data were only included if the fits had an R2 value >0.9 (mean R2 = 0.98).
Evoked polysynaptic response analysis.
Polysynaptic EPSPs were characterized as those events occurring after the evoked monosynaptic EPSP, defined as those that were at least 5 mV in amplitude (measured from event onset) and that occurred more than 30 ms after the stimulation artifact (and less than 1 s, which was the duration of the recorded trace). The number of polysynaptic events was averaged over cells. Evoked polysynaptic response analysis was done with data pooled across intensities of 100–140 μA because these values were closer to the stimulation intensity used during chronic stimulation. We define evoked polysynaptic events as those with an onset occurring 30 ms after the stimulation artifact. Although the underlying currents from the monosynaptic and polysynaptic events can, of course, overlap, the large PSP onsets occurring after 30 ms should be exclusively of polysynaptic origin. The “voltagegrams” shown in Fig. 3 were created by normalizing each trace to its own peak and sorting according to the presence of the polysynaptic peak.
Statistics.
Statistical significance was determined using two-way ANOVA with repeated-measures t-tests (2-tailed). For the analysis of the number of evoked polysynaptic events that each cell exhibited (which exhibited a highly nonnormal distribution) and the intrinsic excitability analysis, a nonparametric Wilcoxon test was used. For the distribution of the number of polysynaptic events, both a Kolmogorov-Smirnov (K-S) test and a bootstrap analysis was performed. For the bootstrap analysis we simulated 10,000 pairs of experimental and control groups by randomly shuffling the actual data set. We then calculated the difference in the mean number of polysynaptic events per trace between the actual stimulated and control groups and the difference in means between the artificially created pairs of data. Figures 3C, 3F, and 7C show in gray the histogram plots of the difference in mean between artificial groups. The dotted line in black is the difference in mean between the actual groups of data. The absence of overlap between the black line and gray histogram in Figs. 3C, 3F, and 7C indicate a significance level below 10−4. For reporting the statistical analyses, the value n refers to the number of cells. In the figures significance levels are represented by the following convention: *P < 0.05; **P < 0.01; ***P < 0.005. For the correlation analysis (Fig. 4), the spontaneous and evoked polysynaptic data for each point were obtained from the same cell and fit with a linear correlation.
RESULTS
Homeostatic modulation of spontaneous activity as a result of chronic pharmacological vs. electrical activity manipulations.
Previous in vitro studies that examined homeostatic induced changes in network dynamics have relied primarily on network-wide pharmacological manipulations. We have previously developed a method to apply chronic local electrical stimulation in organotypic slices, which would be expected to better capture in vivo conditions, and determined that chronic stimulation can reduce spontaneous activity (Johnson and Buonomano 2007, 2009). In the present study we wanted to explore in detail the changes in different regimes of spontaneous network activity and further contrast the effects of chronic electrical stimulation and conventional pharmacologically induced homeostatic plasticity. Furthermore, we have performed multidimensional analyses of plasticity by analyzing changes in spontaneous activity, evoked monosynaptic activity, evoked polysynaptic activity, and intrinsic excitability in the same cells.
Organotypic cortical slices were stimulated via implanted electrodes by applying a burst (5 pulses at 100 Hz) every 10 s for 4 days. Figure 1 shows spontaneous data obtained from stimulated and control slices. Whole cell recordings from layer 2/3 pyramidal neurons near the stimulating electrodes (Fig. 1A) revealed a decrease in spontaneous activity in stimulated slices compared with controls. The decrease in spontaneous activity was ascertained by the frequency of spontaneous events (Fig. 1B; stimulated: 0.2 ± 0.01 Hz, n = 74; control: 0.3 ± 0.02 Hz, n = 94; t-test, P = 10−5) and the amount of time voltage remained a predetermined value above resting membrane potential (Fig. 1C; stimulated: 5.1 ± 0.61%, n = 74; control: 6.9 ± 0.57%, n = 94; t-test, P = 0.03). These results are the first to establish that a chronic increase in activity produced by localized electrical activity induces a homeostatic decrease in spontaneous activity.
To contrast the homeostatic effects induced by chronic increases in activity produced by electrical stimulation with those induced by more traditional pharmacological means, we also increased activity by chronic administration of bicuculline (also 4 days). Representative data from control and bicuculline-treated slices show a dramatic decrease in spontaneous activity in response to bicuculline compared with control (Fig. 1D). Average data in Fig. 1, E and F, show that bicuculline produced a robust decrease in spontaneous activity as measured by frequency of events and percent time above a 5-mV threshold (Fig. 1E, frequency of spontaneous events; bicuculline: 0.08 ± 0.03 Hz, n = 16; control: 0.4 ± 0.06 Hz, n = 14; t-test, P = 10−5; Fig. 1F, %time above threshold; bicuculline: 0.74 ± 0.4%, n = 16; control: 5.1 ± 0.8%, n = 14; t-test, P = 10−5). Since few if any homeostatic experiments have been performed in cortical organotypic slices (as opposed to dissociated or hippocampal organotypic slices), these results confirm that chronic bicuculline treatment decreases spontaneous activity in the recurrent circuits of the cortex.
Spontaneous network activity does not reflect a single regime, but rather an array of different phenomenon ranging from brief membrane depolarizations to sustained periods of depolarization of 10–20 mV (Johnson and Buonomano 2007). These prolonged events, often referred to as Up states, reflect a state in which a large population of neurons enters a mutually excitatory regime for periods of up to a few seconds. Given the potential differential roles of different types of spontaneous activity, and of Up states in particular, we wanted to determine if homeostatic plasticity differentially increases one spontaneous regime over the other. Therefore, we further analyzed the effects of chronic stimulation and bicuculline treatment on Up states. Our analysis revealed that despite the significant decrease in total spontaneous activity in the chronically stimulated slices, there was no significant decrease in Up-state frequency (Fig. 2A). However, we observed a significant relative increase in the proportion of Up states in relation to overall spontaneous activity (Fig. 2B; stimulated: 24.3%, n = 74; control: 16.8%, n = 94; t-test, P < 0.02). In other words, although there was an overall decrease in spontaneous activity, a higher proportion of this activity was attributable to Up states. This relative shift in the type of spontaneous activity suggests that specific network regimes can be differentially modulated. Conversely, bicuculline treatment caused a decrease in spontaneous activity for both spontaneous events (Fig. 1, E and F) and Up states (Fig. 2C; bicuculline: 0.003 Hz, n = 16; control: 0.01 Hz, n = 14; t-test, P < 0.03). Thus, contrary to chronic stimulation, pharmacologically induced homeostatic decrease in spontaneous activity did not produce a differential change in different forms of spontaneous network activity (Fig. 2D). The observation that chronic stimulation shifted the ratio of different forms of spontaneous activity further supports the notion that different forms of spontaneous activity may have different functional roles.
Chronic electrical stimulation increases the ability of evoked stimulation to engage intrinsic dynamics and elicit polysynaptic activity.
In the absence of any external stimulation all activity in a neuronal circuit must be generated “spontaneously,” and thus the homeostatic set point must be achieved solely through spontaneous activity, but in the more natural scenario any local network of neurons receives “external” input from other areas. We hypothesize that when external inputs are present, neurons will regulate these inputs to achieve their homeostatic set points (Liu and Buonomano 2009). Up- or downregulation of active or inactive input channels makes computational sense, because ultimately the functional role of most circuits is to process external information, as opposed to generating spontaneous activity. We thus suggest that neurons might differentially rely on “intrinsic” spontaneous activity vs. extrinsic evoked activity to reach their desired homeostatic set points. Previous in vivo and in vitro experiments, however, have not been able to differentiate between the contribution of intrinsic and external activity. To examine this question we also quantified the evoked network activity in the chronically stimulated and control slices.
As previously described, in both in vivo and in vitro slices electrical stimulation can elicit monosynaptic or polysynaptic activity (Buonomano 2003; Johnson et al. 2010; Shu et al. 2003; Sutor and Hablitz 1989a). Polysynaptic activity is typically defined as the PSP events occurring after the traditional monosynaptic response and is attributed to the indirect activation of local neurons within the circuits, which can be considered to be the result of intrinsic network dynamics. We predicted that in the stimulated slices evoked activity should be better able to elicit internal dynamics as reflected in the likelihood of eliciting polysynaptic activity.
In the electrically stimulated slices there was an increase in evoked polysynaptic activity (Fig. 3A) even though they exhibited less spontaneous activity (Fig. 1). Specifically, there was a significant increase in the number of polysynaptic events (per stimulus) averaged over cells (Fig. 3B; stimulated: 1.2 ± 0.14, n = 36; control: 0.6 ± 0.23, n = 33; Wilcoxon test, P < 0.01) and a significant difference in the distribution of polysynaptic events as measured by the cumulative distribution (K-S test, P = 10−7; data analysis not shown) and a bootstrap analysis (Fig. 3C; P < 10−4). These results are consistent with our prediction that external stimulation produces a shift in functional regimes of cortical networks: shifting from internally generated activity to regimes in which cellular and synaptic loci are shaped in a manner that favors internal dynamics triggered by evoked stimulation.
An alternate explanation for the stimulation-induced increase in polysynaptic activity is that it was the result of chronic increases in activity independent of whether network activity is increased through electrical stimulation or pharmacologically, i.e., independent of external input. Analysis of the evoked activity in the bicuculline-treated slices, however, clearly revealed a dramatic decrease in evoked polysynaptic events. Along with a decrease in spontaneous activity (Fig. 1) bicuculline treatment produced a dramatic decrease in number of polysynaptic events (per stimulus) averaged over cells (Fig. 3E; bicuculline: 0.07 ± 0.04, n = 12; control: 0.4 ± 0.14, n = 11; Wilcoxon test, P < 0.01). Furthermore, there was a significant shift in the distribution of polysynaptic events toward smaller values as measured by the cumulative distribution (K-S test, P < 0.002; data analysis not shown) and a bootstrap analysis (Fig. 3F; P < 10−4). Hence, contrary to electrical stimulation, bicuculline treatment did not produce the paradoxical increase in polysynaptic activity. Rather, bicuculline produced a decrease in polysynaptic activity (Fig. 3, D–F). These results thus indicate that the decrease in spontaneous events and increase in polysynaptic activity were indeed specific to the electrical stimulation as opposed to a general property of chronic increases in network activity. Furthermore, they highlight the differences in inducing homeostatic plasticity through pharmacological and electrical means.
One interpretation of the apparent shift between internally generated spontaneous activity to evoked polysynaptic activity by chronic stimulation is that in the presence of external stimulation neurons may rely more on evoked activity to “reach” their homeostatic set points; that is, the increase in evoked polysynaptic activity is counterbalanced by a decrease in spontaneous activity. To examine this question we computed the correlation between the number of spontaneous events and evoked polysynaptic events for each cell (data from Figs. 1B and 3B). Interestingly, there was a significant inverse correlation between the two regimes of network activity (Fig. 4, R = −0.41, P = 0.014). This analysis further supports the notion that the increase in polysynaptic activity is at least partially homeostatic in nature and that in the presence of external input (chronic stimulation) neurons may shift their reliance on internally generated spontaneous activity to evoked polysynaptic activity to attain their homeostatic set points.
Chronic electrical stimulation causes a decrease in evoked EPSPs.
Having established that chronic electrical stimulation induces a decrease in spontaneous activity and a paradoxical increase in evoked polysynaptic activity, we next examined the mechanisms contributing to these observations. Toward this end we examined the strength of the evoked monosynaptic EPSPs in a subset of the chronically stimulated and control slices by characterizing the input/output (I/O) function of layer 2/3 pyramidal cells by measuring the slope of the initial evoked EPSP to different intensities. Figure 5, A and B, shows representative traces obtained at different stimulation intensities and the corresponding I/O curves for the control and stimulated groups. The I/O curve in the stimulated group is shifted to the right (Fig. 5B, right) compared with the control group (Fig. 5A, right). The slope of the initial EPSP in response to six stimulation intensities averaged over all the cells for each group is plotted in Fig. 5C. There was a robust decrease in EPSP slopes across all intensities (ANOVA: F1,68 = 13.1; P < 0.001) in the stimulated group compared with the control. To examine the differences in a more quantitative fashion, we computed the E50 (the intensity that elicits half-maximal EPSPs) and the asymptote (the maximal EPSP strength) of the I/O functions. The cells in the stimulated group required a higher stimulation intensity to elicit the same EPSP compared with the control as reflected by the increase in E50 values (Fig. 5D; stimulated: 69.3 ± 3.4 μA, n = 36; control: 53.3 ± 2.2 μA, n = 33; t-test, P < 10−4). In addition, there was a decrease in maximal EPSP response as determined by the decrease in asymptote in the stimulated group compared with the control group (Fig. 5E; stimulated: 4.0 ± 0.2 mV/ms, n = 36; control: 4.7 ± 0.25 mV/ms, n = 33; t-test, P < 0.04).
To provide a more complete picture of different forms of homeostatic plasticity that may be operating in parallel, we also examined changes in intrinsic excitability. We found that at higher current intensities neurons in stimulated slices tended to exhibit fewer spikes (0.2 nA, P = 0.03; 0.25 nA, P = 0.02; 0.3 nA, P = 0.08; Wilcoxon test). In addition, we also compared the minimal intensity required to elicit at least one spike, and again there was a significant increase in intensity in cells from the stimulated group (P = 0.04, t-test), indicating that a higher intensity was required to elicit a spike. These results are consistent with a large set of previous experiments demonstrating that changes in activity levels trigger parallel changes in synaptic and cellular properties (Desai 2003; Karmarkar and Buonomano 2006; O'Leary and Wyllie 2011; Rutherford et al. 1997).
Glutamatergic receptor blockade leads to increase in spontaneous activity and evoked EPSPs in cortical organotypic slices.
Our results so far suggest that there may be fundamental differences between inducing homeostatic plasticity through pharmacological means, and through what we propose is a more physiological method of chronic electrical stimulation. For example, with chronic stimulation we observed a decrease in spontaneous activity with both chronic stimulation and bicuculline but an increase in evoked polysynaptic activity with stimulation. However, cortical organotypic slices are not the traditional model system employed to study homeostatic plasticity; indeed, to the best of our knowledge previous studies have not demonstrated the traditional forms of homeostatic plasticity induced by pharmacological application of APV/CNQX in cortical organotypic slices. Hence, to further confirm that cortical organotypic slices do indeed conform to previous homeostatic plasticity findings, we also chronically decreased network activity with APV/CNQX and subsequently recorded spontaneous activity from layer 2/3 pyramidal neurons in the absence of drugs. In accordance with previous pharmacological results there was a significant increase in the amount of total spontaneous activity after APV/CNQX treatment (Fig. 6, A and B). As before, this increase was quantified using two different measures: frequency of spontaneous events (Fig. 6A; APV/CNQX: 0.4 Hz, n = 48; control: 0.2 Hz, n = 47; t-test, P = 10−4) and an increase in time above a defined threshold (5 mV above baseline) (Fig. 6B; APV/CNQX: 10.5%, n = 48; control: 5.3%, n = 47; t-test, P = 10−5).
In dissociated cultures increases in spontaneous activity have been associated with increases in miniature excitatory postsynaptic current (mEPSC) and evoked EPSC amplitude (O'Brien et al. 1998; Thiagarajan et al. 2002; Turrigiano et al. 1998; Wierenga et al. 2005). To determine if the increases in spontaneous activity observed above are related to similar mechanisms, we examined EPSP strength by characterizing the I/O function of layer 2/3 pyramidal cells by measuring the slope of the initial evoked EPSP to different intensities. Figure 6C shows the average EPSP slopes measured at different stimulation intensities. We observed a significant increase in EPSP slopes (ANOVA: F1,55 = 4.56; P < 0.03). The difference was primarily observed at low intensities and converged at higher intensities, likely as a result of a ceiling effect produced by saturation of the driving force and number of fibers activated. In addition, similar to the analysis performed in Fig. 5, we computed the E50 and the asymptote of the I/O functions. There was a significant decrease in E50 in the APV/CNQX-treated group compared with the control, implying that a lower stimulation intensity was required to elicit the same EPSP response in the pharmacologically treated group compared with the control group (Fig. 6D; APV/CNQX: 40.9 μA, n = 30; control: 54.8 μA, n = 27; t-test, P < 0.002). In contrast to the E50 the asymptote remained unchanged (Fig. 6E). These results help resolve previous discrepancies in the literature (Chubykin et al. 2007; Maffei and Turrigiano 2008; Wierenga et al. 2005) and confirm that chronic pharmacological blockade of activity results in an increase in the monosynaptic amplitude of evoked EPSPs (see discussion).
Within-slice experiments reveal that the homeostatic effects are local.
In contrast to global pharmacological manipulations, local electrical stimulation would be expected to preferentially increase the activity levels of neurons close to the stimulation electrode. To address this issue we examined the effects of chronic stimulation using a within-slice protocol. Slices were implanted with two stimulating electrodes, one of which was used to deliver the same stimulation pattern used above (4 days of chronic stimulation). Whole cell recordings were then made from layer 2/3 pyramidal cells that were either close to (<300 μm) the stimulating electrode (stimulated cells) or the silent electrode (control cells) (Fig. 7A). Both spontaneous and evoked responses in response to the near electrode (that is, the stimulated electrode for the stimulated cells and the silent electrode for the control cells) were analyzed. We observed a significant elevation in polysynaptic activity as indicated by an increase in average number of polysynaptic events (averaged over cells) in the stimulated cells compared with the control cells within the same slice (Fig. 7B; stimulated cells: 1.46 ± 0.35, n = 24; control cells: 0.72 ± 0.17, n = 21; Wilcoxon test, P < 0.05). In addition, both the cumulative distribution (K-S test, P = 10−6; data analysis not shown) and bootstrap analysis (Fig. 7C; P < 10−4) revealed a significant difference in the distribution of the number polysynaptic events (per trace) between the two groups.
Analysis of the spontaneous activity in the stimulated and control cells revealed a significant difference in frequency of spontaneous events in the stimulated cells compared with the control cells. (Fig. 7D; stimulated cells: 0.2 ± 0.02 Hz, n = 40; control cells: 0.3 ± 0.03 Hz, n = 20; t-test, P = 0.005). Similar to the analysis in Fig. 1, we also assayed changes in spontaneous activity by computing the time above threshold. Although there was a trend toward a decrease in the time above threshold, it did not reach significance (Fig. 7E; stimulated cells: 5.3 ± 0.8%, n = 40; control cells: 7.5 ± 1.12%, n = 20; t-test, P = 0.11). It is important to note, however, that one would expect any homeostatic differences to be attenuated, as suggested by the lack of significance in the time above threshold data, compared with between-slice experiments because the cells within the same slice share input and participate in shared functional networks (Luczak and Maclean 2012).
As with the between-slice experiments in Fig. 5, we observed a decrease in initial EPSP slope in the stimulated cells compared with the control cells (Fig. 8B; ANOVA: F1,34 = 27.9; P = 10−6), including an increased E50 (Fig. 8C; stimulated cells: 83.6 ± 3.8 μA, n = 18; control cells: 66.6 ± 5.3 μA, n = 17; t-test, P < 0.002) and decreased asymptote (Fig. 8D; stimulated cells: 4.0 ± 0.7 mV/ms, n = 18; control cells: 6.7 ± 0.9 mV/ms, n = 13; t-test, P < 0.02). In these within-slice experiments we were not able to conclusively test the issue of whether the increase in polysynaptic activity was specific to the stimulated electrode, because it is necessary to record from cells near the stimulating electrode (to obtain a robust homeostatic effect) and one cannot directly compare evoked activity from the stimulated and silent electrode due to distance differences; furthermore, there are challenges in addressing the problem of pathway overlap when dealing with polysynaptic responses. Nevertheless, the local decrease in monosynaptic EPSPs and the increase in locally evoked polysynaptic events indicate that some of the effects of chronic stimulation are indeed expressed locally.
Together, these within-slice experiments are the first to reveal local homeostatic regulation of spontaneous and evoked network activity. The fact that cells within the same slice exhibited significantly different levels of spontaneous activity indicates that although these cells participate in shared functional networks (Buonomano 2003; Luczak and Maclean 2012; MacLean et al. 2005), their levels of spontaneous activity can nevertheless be differentially modulated. Indeed, while spontaneous activity can be locally decreased, evoked polysynaptic activity can be locally enhanced.
DISCUSSION
The current study demonstrates that chronic evoked activity produces a decrease in spontaneous activity in neocortical circuits. Interestingly, this decrease in spontaneous dynamics was accompanied by an increased likelihood of eliciting evoked polysynaptic responses, suggesting a shift from a regime in which neurons rely on intrinsic spontaneous activity to one where extrinsic evoked activity drives them to their homeostatic set points. This unconventional increase in polysynaptic activity was not observed in bicuculline-treated slices. Furthermore, within-slice experiments revealed that the increase in polysynaptic activity was specific to the pathway and neurons close to the stimulated electrodes. The fact that the increase in evoked polysynaptic activity was observed despite the decrease in evoked monosynaptic EPSP amplitude indicates that the network plasticity observed in this work is not produced by a simple associative synaptic plasticity or homeostatic synaptic scaling, but rather by the orchestrated changes at multiple loci that cooperate to improve the polysynaptic flow of activity within circuits. We argue that from a computational perspective these results make computational sense. Specifically, in the absence of any external input, the typical scenario in culture experiments, homeostatic set points must be reached through spontaneous activity, but in the presence of an external source of input, neurons should favor being driven by external input, which ensures the ability to process external information.
Homeostatic plasticity and changes in evoked EPSP amplitude.
Changes in evoked monosynaptic EPSPs are an expected consequence of homeostatic modifications; however, experimentally the relationship between spontaneous activity and EPSP amplitude has been unclear. Although there is ample experimental evidence that synaptic efficacy is altered in response to chronic activity as assayed by changes in mEPSCs (Desai et al. 2002; Goel et al. 2006; Goel and Lee 2007; O'Brien et al. 1998; Thiagarajan et al. 2002; Turrigiano et al. 1998), the few studies that have monitored changes in evoked postsynaptic currents (EPSCs) have reported conflicting results, leaving the issue unresolved (Chubykin et al. 2007; Maffei and Turrigiano 2008; Wierenga et al. 2005). One study has reported that decreasing network activity with APV, CNQX, and picrotoxin for 4 days in dissociated hippocampal cultures left evoked EPSP amplitude unaltered (Chubykin et al. 2007). Additionally, an ex vivo study reported increases in mEPSC amplitude but either increases or decreases in evoked EPSC depending on which presynaptic pathway is engaged (Maffei and Turrigiano 2008). Also, a recent study in organotypic hippocampal slices demonstrated that increased activity produced by optogenetic stimulation reduced evoked EPSP amplitude (Goold and Nicoll 2010). Our data provide evidence that, in recurrent cortical networks, elevating network activity using electrical manipulation decreases evoked EPSP strength (Fig. 5), whereas pharmacological blockade using APV and CNQX results in a significant increase in evoked EPSP strength (Fig. 6, C–E). Thus our observations of bidirectional changes in evoked EPSPs produced by different manipulations offer strong evidence that changes in evoked EPSPs are one of the cellular mechanisms by which networks adapt to chronic activity manipulation.
Although our results are primarily interpreted in the context of homeostatic plasticity, as mentioned above, we believe it is likely that there are multiple forms of plasticity operating in an orchestrated manner at multiple loci. At the network level one would expect that multiple forms of associative long-term potentiation/long-term depolarization (LTP/LTD) and homeostatic plasticity operating on excitatory and inhibitory synapses or specific subtypes of cells are operating in parallel. Nevertheless, given that our manipulation was primarily based on what would traditionally be considered homeostatic manipulations and that we observed a decrease in monosynaptic EPSPs despite the increase in polysynaptic activity, it seems unlikely that our results could be explained independently of homeostatic plasticity.
Potential mechanisms underlying changes in polysynaptic activity.
The functional premise of homeostatic plasticity is that neurons that are hypo- or hyperactive are inefficient information processing elements; thus mechanisms are in place to drive average levels of activity to some appropriate set point (Abbott and Nelson 2000; O'Leary and Wyllie 2011; Turrigiano 2008; van Rossum et al. 2000). To attain this set point, neurons must monitor their average level of activity over time, presumably through Ca2+ sensors (Goold and Nicoll 2010; Thiagarajan et al. 2002) (but see Leslie et al. 2001). To drive neurons to their set points, there are two potential sources of neural activity: evoked and spontaneous. In this study, we use “evoked” to refer to activity that is directly (monosynaptically) or indirectly (polysynaptically) triggered by an external stimulus and “spontaneous” to refer to activity generated by events internal to the local neural network. Clearly, in typical in vitro studies all activity must rely solely on spontaneous activity; it is relevant to note, however, that the mechanisms and origin of this spontaneous activity are not understood (Bazhenov et al. 2002; McCormick 1999; Zucker 2003). By providing external input to these isolated circuits we emulated an in vivo scenario where neurons could be driven by either an external or internal source. Interestingly, despite a decrease in spontaneous activity and evoked monosynaptic EPSPs in the stimulated slices, these same stimuli were more likely to evoke polysynaptic network activity. This may occur as a result of a shift from regimes in which networks rely on spontaneous events to achieve their target activity to those in which they rely on patterned evoked activity. As stated above, the increase in polysynaptic activity makes computational sense because it allows neurons to shift toward external signals as their “input source.” Furthermore, the finding is consistent with theoretical work suggesting that homeostatic plasticity should not uniformly scale all synaptic inputs, but rather differentially scale synaptic strength depending on the levels of average presynaptic activity. This allows for stability in recurrent networks and allows neurons to shift their main source of input toward active pathways (Buonomano 2005; Liu and Buonomano 2009).
A key question is what drives the increase in evoked polysynaptic activity despite the decrease in apparent strength of the evoked monosynaptic EPSPs. A large body of data indicates that changes in network activity often engage multiple forms of plasticity in parallel, including intrinsic excitability, inhibition (Desai et al. 1999; Karmarkar and Buonomano 2006; Pozo and Goda 2010; Rutherford et al. 1997; Turrigiano 2008), and potentially changes in short-term plasticity. It seems likely that changes in inhibition would contribute to the effects observed in this study. Because the current experiments were designed to establish a more realistic protocol for studying homeostatic plasticity in vitro, and directly contrast changes in spontaneous activity, monosynaptic EPSPs, and evoked network activity in the same cells, we did not isolate inhibitory PSPs to examine changes in inhibition. However, to gain some insights into the question of changes in inhibition, we examined the shape of the monosynaptic EPSPs. The time to peak (TTP) of EPSPs is known to reflect the strength of inhibition (Buonomano and Merzenich 1998b; Kawaguchi and Kubota 1997; McCormick 1989; Pouille and Scanziani 2001; Sutor and Hablitz 1989b). A comparison of the TTP of the initial monosynaptic EPSPs between the stimulated slices and the control slices over all stimulation intensities revealed a highly robust and significant increase in the TTP in the stimulated group (ANOVA: F1,45 = 22.84, P < 10−4; data not shown), indicative of a decrease in inhibition. Importantly, this effect could not be explained by differences in EPSP strength because the TTP in each group was approximately the same across all stimulation intensities (that is, the TTP was still significantly larger, inhibition weaker, when differences in EPSP strength were accounted for). Thus it seems plausible that the increase in polysynaptic activity could be a result of a decrease in inhibition. The decrease in inhibition could be the result of less recruitment of inhibitory neurons because of the decrease in monosynaptic drive of the excitatory neurons. Indeed, this is consistent with the observation that high stimulation intensities are often less likely to induce polysynaptic activity (Johnson and Buonomano 2007). Finally, it should be pointed out that other forms of plasticity induced by chronic stimulation have also implicated multiple underlying mechanisms including inhibition. Specifically, intracortical microstimulation (ICMS), in which chronic stimulation over the course of a few hours can increase receptive field sizes in vivo (Spengler and Dinse 1994), might also rely in part on changes in inhibition (Heusler et al. 2000). Because inhibition in response to a single pulse can last hundreds of milliseconds (Buonomano and Merzenich 1998b; Butovas and Schwarz 2003), decreases in inhibition are well suited to enhance polysynaptic activity. However, future experiments will also have to examine other potential mechanisms including changes in short-term synaptic plasticity (Carvalho and Buonomano 2011; Finnerty et al. 1999; Finnerty and Connors 2000); for example, a shift from paired-pulse depression to facilitation could also contribute to a decrease in the monosynaptic response and increases polysynaptic activity. Additionally, in another recurrent circuit, the CA3 circuit of the hippocampus, it has been shown that excitatory synapses undergo differential weakening and strengthening of EPSP in response to the same treatment (Kim and Tsien 2008; Mitra et al. 2012).
The differential changes in spontaneous activity and evoked mono- and polysynaptic activity make it highly likely that multiple parallel forms of plasticity are contributing to the observed results. Also, independently of the mechanisms, it is clear that some of them are engaged in a spatially localized manner. Specifically, we observed that cells near the chronically stimulated electrode exhibited relatively less spontaneous activity (Fig. 7, D and E), a local decrease in monosynaptic EPSP amplitude (Fig. 8), and an increase in locally evoked polysynaptic activity compared with those near the silent electrode (Fig. 7, B and C). To the best of our knowledge these experiments are the first to demonstrate that different cells within the same circuits can exhibit different levels of spontaneous activity, suggesting that whatever the mechanisms governing spontaneous activity, they can be locally restricted. Although our results demonstrate that chronic activity differentially affects cells/networks that are close and distant from the stimulating electrode, a question that remains unaddressed is the precise mechanisms underlying these forms of plasticity. For example, do cells differentially up- and downregulate monosynaptic inputs coming from the stimulated and nonstimulated electrodes? Future research must be aimed at unraveling these questions; nevertheless, it is clear that simple synaptic scaling does not account for the increase in polysynaptic activity observed in this study or for previous observations that have reported paradoxical increases in synaptic strength in response to chronic increases in activity (Kim and Tsien 2008; Mitra et al. 2012).
Homeostatic modification of the different regimes of spontaneous network activity.
The observation that bicuculline reduced both global spontaneous activity and the number of Up states, whereas chronic electrical stimulation primarily reduced global activity while preserving the number of Up states, suggests that different forms of spontaneous activity are differentially regulated and may have different functions. This result is difficult to interpret, however, because the function and mechanisms of spontaneous activity are not known. However, it is increasingly clear that spontaneous activity should not be interpreted as “noise,” but rather that it contributes in some fundamental way to brain function (Destexhe 2011; McCormick 1999). Studies indicate that spontaneous activity contributes to cortical development prior to sensory experience (McCormick 1999; Weliky and Katz 1999), as well as the replay of important events in a manner that is thought to contribute to learning and memory (e.g., Dave and Margoliash 2000; Ji and Wilson 2007; Yao et al. 2007). Additionally, the structure of spontaneous activity changes with development, indicating that it is ontogenetically regulated (Fiser et al. 2004; Golshani et al. 2009). In this study we examined changes in both overall spontaneous activity and the frequency of Up states. Up states are a well-described mode of spontaneous network activity characterized by the transition between a hyperpolarized inactive state and a prolonged depolarization of 10–20 mV (Paré et al. 1998; Timofeev et al. 2001; Wilson and Kawaguchi 1996). The transition to Up states appears to be an emergent network property in that they rely on the recurrent intracortical connectivity and involve the participation of subsets of coactive neurons (Johnson and Buonomano 2007; MacLean et al. 2005; Shu et al. 2003; Yassin et al. 2010). Up states have been shown to occur in acute (Cossart et al. 2003; Gibson et al. 2008; Shu et al. 2003) as well as organotypic slices (Plenz and Kitai 1998; Seamans et al. 2003) and are associated with increased cell firing and synaptic conductance as well as elevated excitability (Hasenstaub et al. 2007; Shu et al. 2003). The functional role of Up states continues to be debated. It has been suggested that they may reflect an “online” or “awake” mode of processing, facilitating the processing of information within local circuits (Constantinople and Bruno 2011; Haider and McCormick 2009; Petersen et al. 2003; Shu et al. 2003). In particular, one study suggests that Up states shield “online” network activity from interference due to thalamic input (Watson et al. 2008). Other work suggests that Up states mediate memory consolidation (Hoffman et al. 2007). A non-mutually exclusive hypothesis is that Up states play a critical role in tuning cortical networks (Johnson and Buonomano 2007); in essence, they might allow networks to test their dynamics and tune the multitude of cellular and synaptic properties that must be coordinated to generate functional computational regimes. For example, Up states could contribute to tuning the balance of excitation and inhibition, which is critical to generate regimes where brief inputs produce propagating patterns of activity rather than bursts of activity that immediately “die out.” In this study, despite a decrease in total spontaneous events with chronic stimulation, we did not observe a significant decrease in the frequency of Up states. This result supports the notion that Up states may have a specific function and is consistent with a potential role in tuning network dynamics and balance of excitation and inhibition.
Conclusions.
How recurrent cortical circuits generate functional dynamic states in which activity can propagate throughout a network, yet not generate runaway excitation or epileptic-like activity, has been a long-standing problem (Fiete et al. 2010; Liu and Buonomano 2009; Sussillo and Abbott 2009). This problem is particularly challenging in circuits with both feedforward and recurrent connections. In this report we provide evidence that the solution to this problem likely involves multiple and orchestrated forms of plasticity that allow networks to independently regulate spontaneous, monosynaptic, and polysynaptic activity. Specifically, circuits can shift toward regimes in which network activity is generated by spontaneous activity to a regime in which activity is triggered by extrinsic stimulation. We suggest that these shifts in internal dynamics contribute to the formation of activity patterns that allow activity to “flow” through neural networks and that these neural trajectories contribute to cortical function in vivo (Buonomano and Maass 2009; Destexhe and Marder 2004; Durstewitz and Deco 2008).
GRANTS
This work was supported by National Institutes of Health Grants MH-60163 and T32 NS-058280.
DISCLOSURES
No conflicts of interest, financial or otherwise, are declared by the authors.
AUTHOR CONTRIBUTIONS
A.G. and D.V.B. conception and design of research; A.G. performed experiments; A.G. and D.V.B. analyzed data; A.G. and D.V.B. interpreted results of experiments; A.G. and D.V.B. prepared figures; A.G. and D.V.B. drafted manuscript; A.G. and D.V.B. edited and revised manuscript; A.G. and D.V.B. approved final version of manuscript.
ACKNOWLEDGMENTS
We thank Weixiang Chen and Rodrigo Laje for helpful comments on this manuscript and Janet Lee, Tyler Lee, and Kayla Gurley for assistance with slice cultures and stimulating electrodes.
REFERENCES
- Abbott LF, Nelson SB. Synaptic plasticity: taming the beast. Nat Neurosci 3: 1178–1183, 2000 [DOI] [PubMed] [Google Scholar]
- Bazhenov M, Timofeev I, Steriade M, Sejnowski TJ. Model of thalamocortical slow-wave sleep oscillations and transitions to activated States. J Neurosci 22: 8691–8704, 2002 [DOI] [PMC free article] [PubMed] [Google Scholar]
- Benedetti BL, Glazewski S, Barth AL. Reliable and precise neuronal firing during sensory plasticity in superficial layers of primary somatosensory cortex. J Neurosci 29: 11817–11827, 2009 [DOI] [PMC free article] [PubMed] [Google Scholar]
- Buonomano DV. A learning rule for the emergence of stable dynamics and timing in recurrent networks. J Neurophysiol 94: 2275–2283, 2005 [DOI] [PubMed] [Google Scholar]
- Buonomano DV. Timing of neural responses in cortical organotypic slices. Proc Natl Acad Sci USA 100: 4897–4902, 2003 [DOI] [PMC free article] [PubMed] [Google Scholar]
- Buonomano DV, Maass W. State-dependent computations: spatiotemporal processing in cortical networks. Nat Rev Neurosci 10: 113–125, 2009 [DOI] [PubMed] [Google Scholar]
- Buonomano DV, Merzenich MM. Cortical plasticity: from synapses to maps. Annu Rev Neurosci 21: 149–186, 1998a [DOI] [PubMed] [Google Scholar]
- Buonomano DV, Merzenich MM. Net interaction between different forms of short-term synaptic plasticity and slow-IPSPs in the hippocampus and auditory cortex. J Neurophysiol 80: 1765–1774, 1998b [DOI] [PubMed] [Google Scholar]
- Butovas S, Schwarz C. Spatiotemporal effects of microstimulation in rat neocortex: a parametric study using multielectrode recordings. J Neurophysiol 90: 3024–3039, 2003 [DOI] [PubMed] [Google Scholar]
- Carvalho TP, Buonomano DV. A novel learning rule for long-term plasticity of short-term synaptic plasticity enhances temporal processing. Front Integr Neurosci 5: 20, 2011 [DOI] [PMC free article] [PubMed] [Google Scholar]
- Chubykin AA, Atasoy D, Etherton MR, Brose N, Kavalali ET, Gibson JR, Sudhof TC. Activity-dependent validation of excitatory versus inhibitory synapses by neuroligin-1 versus neuroligin-2. Neuron 54: 919–931, 2007 [DOI] [PMC free article] [PubMed] [Google Scholar]
- Constantinople CM, Bruno RM. Effects and mechanisms of wakefulness on local cortical networks. Neuron 69: 1061–1068, 2011 [DOI] [PMC free article] [PubMed] [Google Scholar]
- Cossart R, Aronov D, Yuste R. Attractor dynamics of network UP states in the neocortex. Nature 423: 283–288, 2003 [DOI] [PubMed] [Google Scholar]
- Dave AS, Margoliash D. Song replay during sleep and computational rules for sensorimotor learning. Science 290: 812–816, 2000 [DOI] [PubMed] [Google Scholar]
- De Simoni A, Griesinger CB, Edwards FA. Development of rat CA1 neurones in acute versus organotypic slices: role of experience in synaptic morphology and activity. J Physiol 550: 135–147, 2003 [DOI] [PMC free article] [PubMed] [Google Scholar]
- Desai NS. Homeostatic plasticity in the CNS: synaptic and intrinsic forms. J Physiol (Paris) 97: 391–402, 2003 [DOI] [PubMed] [Google Scholar]
- Desai NS, Cudmore RH, Nelson SB, Turrigiano GG. Critical periods for experience-dependent synaptic scaling in visual cortex. Nat Neurosci 5: 783–789, 2002 [DOI] [PubMed] [Google Scholar]
- Desai NS, Rutherford LC, Turrigiano GG. Plasticity in the intrinsic excitability of cortical pyramidal neurons. Nat Neurosci 2: 515–520, 1999 [DOI] [PubMed] [Google Scholar]
- Destexhe A. Intracellular and computational evidence for a dominant role of internal network activity in cortical computations. Curr Opin Neurobiol 2011 [DOI] [PubMed] [Google Scholar]
- Destexhe A, Marder E. Plasticity in single neuron and circuit computations. Nature 431: 789–795, 2004 [DOI] [PubMed] [Google Scholar]
- Dong HW, Buonomano DV. A technique for repeated recordings in cortical organotypic slices. J Neurosci Methods 146: 69–75, 2005 [DOI] [PubMed] [Google Scholar]
- Durstewitz D, Deco G. Computational significance of transient dynamics in cortical networks. Eur J Neurosci 27: 217–227, 2008 [DOI] [PubMed] [Google Scholar]
- Feldman DE. Synaptic mechanisms for plasticity in neocortex. Annu Rev Neurosci 32: 33–55, 2009 [DOI] [PMC free article] [PubMed] [Google Scholar]
- Fiete IR, Senn W, Wang CZ, Hahnloser RH. Spike-time-dependent plasticity and heterosynaptic competition organize networks to produce long scale-free sequences of neural activity. Neuron 65: 563–576, 2010 [DOI] [PubMed] [Google Scholar]
- Finnerty GT, Connors BW. Sensory deprivation without competition yields modest alterations of short-term synaptic dynamics. Proc Natl Acad Sci USA 97: 12864–12868, 2000 [DOI] [PMC free article] [PubMed] [Google Scholar]
- Finnerty GT, Roberts LS, Connors BW. Sensory experience modifies the short-term dynamics of neocortical synapses. Nature 400: 367–371, 1999 [DOI] [PubMed] [Google Scholar]
- Fiser J, Chiu C, Weliky M. Small modulation of ongoing cortical dynamics by sensory input during natural vision. Nature 431: 573–578, 2004 [DOI] [PubMed] [Google Scholar]
- Frohlich F, Bazhenov M, Sejnowski TJ. Pathological effect of homeostatic synaptic scaling on network dynamics in diseases of the cortex. J Neurosci 28: 1709–1720, 2008 [DOI] [PMC free article] [PubMed] [Google Scholar]
- Gahwiler BH, Capogna M, Debanne D, McKinney RA, Thompson SM. Organotypic slice cultures: a technique has come of age. Trends Neurosci 20: 471–477, 1997 [DOI] [PubMed] [Google Scholar]
- Gibson JR, Bartley AF, Hays SA, Huber KM. Imbalance of neocortical excitation and inhibition and altered UP states reflect network hyperexcitability in the mouse model of fragile X syndrome. J Neurophysiol 100: 2615–2626, 2008 [DOI] [PMC free article] [PubMed] [Google Scholar]
- Goel A, Jiang B, Xu LW, Song L, Kirkwood A, Lee HK. Cross-modal regulation of synaptic AMPA receptors in primary sensory cortices by visual experience. Nat Neurosci 9: 1001–1003, 2006 [DOI] [PMC free article] [PubMed] [Google Scholar]
- Goel A, Lee HK. Persistence of experience-induced homeostatic synaptic plasticity through adulthood in superficial layers of mouse visual cortex. J Neurosci 27: 6692–6700, 2007 [DOI] [PMC free article] [PubMed] [Google Scholar]
- Golshani P, Goncalves JT, Khoshkhoo S, Mostany R, Smirnakis S, Portera-Cailliau C. Internally mediated developmental desynchronization of neocortical network activity. J Neurosci 29: 10890–10899, 2009 [DOI] [PMC free article] [PubMed] [Google Scholar]
- Goold CP, Nicoll RA. Single-cell optogenetic excitation drives homeostatic synaptic depression. Neuron 68: 512–528, 2010 [DOI] [PMC free article] [PubMed] [Google Scholar]
- Haider B, McCormick DA. Rapid neocortical dynamics: cellular and network mechanisms. Neuron 62: 171–189, 2009 [DOI] [PMC free article] [PubMed] [Google Scholar]
- Hasenstaub A, Sachdev RNS, McCormick DA. State changes rapidly modulate cortical neuronal responsiveness. J Neurosci 27: 9607–9622, 2007 [DOI] [PMC free article] [PubMed] [Google Scholar]
- Heusler P, Cebulla B, Boehmer G, Dinse HR. A repetitive intracortical microstimulation pattern induces long-lasting synaptic depression in brain slices of the rat primary somatosensory cortex. Exp Brain Res 135: 300–310, 2000 [DOI] [PubMed] [Google Scholar]
- Hickmott PW, Steen PA. Large-scale changes in dendritic structure during reorganization of adult somatosensory cortex. Nat Neurosci 8: 140–142, 2005 [DOI] [PubMed] [Google Scholar]
- Hoffman KL, Battaglia FP, Harris K, MacLean JN, Marshall L, Mehta MR. The upshot of up states in the neocortex: from slow oscillations to memory formation. J Neurosci 27: 11838–11841, 2007 [DOI] [PMC free article] [PubMed] [Google Scholar]
- Houweling AR, Bazhenov M, Timofeev I, Steriade M, Sejnowski TJ. Homeostatic synaptic plasticity can explain post-traumatic epileptogenesis in chronically isolated neocortex. Cereb Cortex 15: 834–845, 2005 [DOI] [PMC free article] [PubMed] [Google Scholar]
- Ji D, Wilson MA. Coordinated memory replay in the visual cortex and hippocampus during sleep. Nat Neurosci 10: 100–107, 2007 [DOI] [PubMed] [Google Scholar]
- Johnson HA, Buonomano DV. Development and plasticity of spontaneous activity and up states in cortical organotypic slices. J Neurosci 27: 5915–5925, 2007 [DOI] [PMC free article] [PubMed] [Google Scholar]
- Johnson HA, Buonomano DV. A method for chronic stimulation of cortical organotypic cultures using implanted electrodes. J Neurosci Methods 176: 136–143, 2009 [DOI] [PubMed] [Google Scholar]
- Johnson HA, Goel A, Buonomano DV. Neural dynamics of in vitro cortical networks reflects experienced temporal patterns. Nat Neurosci 13: 917–919, 2010 [DOI] [PMC free article] [PubMed] [Google Scholar]
- Karmarkar UR, Buonomano DV. Different forms of homeostatic plasticity are engaged with distinct temporal profiles. Eur J Neurosci 23: 1575–1584, 2006 [DOI] [PubMed] [Google Scholar]
- Kawaguchi Y, Kubota Y. GABAergic cell subtypes and their synaptic connections in rat frontal cortex. Cereb Cortex 7: 476–486, 1997 [DOI] [PubMed] [Google Scholar]
- Kim J, Tsien RW. Synapse-specific adaptations to inactivity in hippocampal circuits achieve homeostatic gain control while dampening network reverberation. Neuron 58: 925–937, 2008 [DOI] [PMC free article] [PubMed] [Google Scholar]
- Lazar A, Pipa G, Triesch J. SORN: a self-organizing recurrent neural network. Front Comput Neurosci 3: 23, 2009 [DOI] [PMC free article] [PubMed] [Google Scholar]
- Leslie KR, Nelson SB, Turrigiano GG. Postsynaptic depolarization scales quantal amplitude in cortical pyramidal neurons. J Neurosci 21: RC170, 2001 [DOI] [PMC free article] [PubMed] [Google Scholar]
- Liu JK, Buonomano DV. Embedding multiple trajectories in simulated recurrent neural networks in a self-organizing manner. J Neurosci 29: 13172–13181, 2009 [DOI] [PMC free article] [PubMed] [Google Scholar]
- Luczak A, Maclean JN. Default activity patterns at the neocortical microcircuit level. Front Integr Neurosci 6: 30, 2012 [DOI] [PMC free article] [PubMed] [Google Scholar]
- MacLean JN, Watson BO, Aaron GB, Yuste R. Internal dynamics determine the cortical response to thalamic stimulation. Neuron 48: 811–823, 2005 [DOI] [PubMed] [Google Scholar]
- Maffei A, Turrigiano GG. Multiple modes of network homeostasis in visual cortical layer 2/3. J Neurosci 28: 4377–4384, 2008 [DOI] [PMC free article] [PubMed] [Google Scholar]
- Marder CP, Buonomano DV. Differential effects of short- and long-term potentiation on cell firing in the CA1 region of the hippocampus. J Neurosci 23: 112–121, 2003 [DOI] [PMC free article] [PubMed] [Google Scholar]
- McCormick DA. GABA as an inhibitory neurotransmitter in human cerebral cortex. J Neurophysiol 62: 1018–1027, 1989 [DOI] [PubMed] [Google Scholar]
- McCormick DA. Spontaneous activity: signal or noise? Science 285: 541–543, 1999 [DOI] [PubMed] [Google Scholar]
- Mitra A, Mitra SS, Tsien RW. Heterogeneous reallocation of presynaptic efficacy in recurrent excitatory circuits adapting to inactivity. Nat Neurosci 15: 250–257, 2012 [DOI] [PMC free article] [PubMed] [Google Scholar]
- O'Brien RJ, Kamboj S, Ehlers MD, Rosen KR, Fischbach GD, Huganir RL. Activity-dependent modulation of synaptic AMPA receptor accumulation. Neuron 21: 1067–1078, 1998 [DOI] [PubMed] [Google Scholar]
- O'Leary T, Wyllie DJ. Neuronal homeostasis: time for a change? J Physiol 589: 4811–4826, 2011 [DOI] [PMC free article] [PubMed] [Google Scholar]
- Paré D, Shink E, Gaudreau H, Destexhe A, Lang EJ. Impact of spontaneous synaptic activity on the resting properties of cat neocortical pyramidal neurons in vivo. J Neurophysiol 79: 1450–1460, 1998 [DOI] [PubMed] [Google Scholar]
- Pearlmutter BA. Gradient calculation for dynamic recurrent neural networks: a survey. IEEE Trans Neural Netw 6: 1212–1228, 1995 [DOI] [PubMed] [Google Scholar]
- Petersen CC, Hahn TTG, Mehta M, Grinvald A, Sakmann B. Interaction of sensory responses with spontaneous depolarization in layer 2/3 barrel cortex. Proc Natl Acad Sci USA 100: 1363–13643, 2003 [DOI] [PMC free article] [PubMed] [Google Scholar]
- Plenz D, Kitai ST. Up and down states in striatal medium spiny neurons simultaneously recorded with spontaneous activity in fast-spiking interneurons studied in cortex-striatum-substantia nigra organotypic cultures. J Neurosci 18: 266–283, 1998 [DOI] [PMC free article] [PubMed] [Google Scholar]
- Pouille F, Scanziani M. Enforcement of temporal fidelity in pyramidal cells by somatic feed-forward inhibition. Science 293: 1159–1163, 2001 [DOI] [PubMed] [Google Scholar]
- Pozo K, Goda Y. Unraveling mechanisms of homeostatic synaptic plasticity. Neuron 66: 337–351, 2010 [DOI] [PMC free article] [PubMed] [Google Scholar]
- Renart A, Song P, Wang XJ. Robust spatial working memory through homeostatic synaptic scaling in heterogeneous cortical networks. Neuron 38: 473–485, 2003 [DOI] [PubMed] [Google Scholar]
- Rutherford LC, DeWan A, Lauer HM, Turrigiano GG. Brain-derived neurotrophic factor mediates the activity-dependent regulation of inhibition in neocortical cultures. J Neurosci 17: 4527–4535, 1997 [DOI] [PMC free article] [PubMed] [Google Scholar]
- Seamans JK, Nogueira L, Lavin A. Synaptic basis of persistent activity in prefrontal cortex in vivo and in organotypic cultures. Cereb Cortex 13: 1242–1250, 2003 [DOI] [PMC free article] [PubMed] [Google Scholar]
- Shu Y, Hasenstaub A, McCormick DA. Turning on and off recurrent balanced cortical activity. Nature 423: 288–293, 2003 [DOI] [PubMed] [Google Scholar]
- Spengler F, Dinse HR. Reversible relocation of representational boundaries of adult rats by intracortical microstimulation. Neuroreport 5: 949–953, 1994 [DOI] [PubMed] [Google Scholar]
- Stoppini L, Buchs PA, Muller D. A simple method for organotypic cultures of nervous tissue. J Neurosci Methods 37: 173–182, 1991 [DOI] [PubMed] [Google Scholar]
- Sussillo D, Abbott LF. Generating coherent patterns of activity from chaotic neural networks. Neuron 63: 544–557, 2009 [DOI] [PMC free article] [PubMed] [Google Scholar]
- Sutor B, Hablitz JJ. EPSPs in rat neocortical neurons in vitro. II. Involvement of N-methyl-d-aspartate receptors in the generation of EPSPs. J Neurophysiol 61: 621–634, 1989a [DOI] [PubMed] [Google Scholar]
- Sutor B, Hablitz JJ. EPSPs in rat neocortical neurons in vitro. I. Electrophysiological evidence for two distinct EPSPs. J Neurophysiol 61: 607–620, 1989b [DOI] [PubMed] [Google Scholar]
- Thiagarajan TC, Piedras-Renteria ES, Tsien RW. Alpha- and betaCaMKII. Inverse regulation by neuronal activity and opposing effects on synaptic strength. Neuron 36: 1103–1114, 2002 [DOI] [PubMed] [Google Scholar]
- Timofeev I, Grenier F, Steriade M. Disfacilitation and active inhibition in the neocortex during the natural sleep-wake cycle: an intracellular study. Proc Natl Acad Sci USA 98: 1924–1929, 2001 [DOI] [PMC free article] [PubMed] [Google Scholar]
- Turrigiano GG. The self-tuning neuron: synaptic scaling of excitatory synapses. Cell 135: 422–435, 2008 [DOI] [PMC free article] [PubMed] [Google Scholar]
- Turrigiano GG, Leslie KR, Desai NS, Rutherford LC, Nelson SB. Activity-dependent scaling of quantal amplitude in neocortical neurons. Nature 391: 892–896, 1998 [DOI] [PubMed] [Google Scholar]
- van Rossum MC, Bi GQ, Turrigiano GG. Stable Hebbian learning from spike timing-dependent plasticity. J Neurosci 20: 8812–8821, 2000 [DOI] [PMC free article] [PubMed] [Google Scholar]
- Wagenaar DA, Pine J, Potter SM. Effective parameters for stimulation of dissociated cultures using multi-electrode arrays. J Neurosci Methods 138: 27–37, 2004 [DOI] [PubMed] [Google Scholar]
- Watson BO, MacLean JN, Yuste R. UP states protect ongoing cortical activity from thalamic inputs. PLoS One 3: e3971, 2008 [DOI] [PMC free article] [PubMed] [Google Scholar]
- Weliky M, Katz LC. Correlational structure of spontaneous neuronal activity in the developing lateral geniculate nucleus in vivo. Science 285: 599–604, 1999 [DOI] [PubMed] [Google Scholar]
- Wierenga CJ, Ibata K, Turrigiano GG. Postsynaptic expression of homeostatic plasticity at neocortical synapses. J Neurosci 25: 2895–2905, 2005 [DOI] [PMC free article] [PubMed] [Google Scholar]
- Wilson CJ, Kawaguchi Y. The origins of two-state spontaneous membrane potential fluctuations of neostriatal spiny neurons. J Neurosci 16: 2397–2410, 1996 [DOI] [PMC free article] [PubMed] [Google Scholar]
- Yao H, Shi L, Han F, Gao H, Dan Y. Rapid learning in cortical coding of visual scenes. Nat Neurosci 10: 772–778, 2007 [DOI] [PubMed] [Google Scholar]
- Yassin L, Benedetti BL, Jouhanneau JS, Wen JA, Poulet JF, Barth AL. An embedded subnetwork of highly active neurons in the neocortex. Neuron 68: 1043–1050, 2010 [DOI] [PMC free article] [PubMed] [Google Scholar]
- Zucker RS. Can a synaptic signal arise from noise? Neuron 38: 845–846, 2003 [DOI] [PubMed] [Google Scholar]