

Abstract
Motor learning is reflected in changes to the brain's functional organization as a result of experience. We show here that these changes are not limited to motor areas of the brain and indeed that motor learning also changes sensory systems. We test for plasticity in sensory systems using somatosensory evoked potentials (SEPs). A robotic device is used to elicit somatosensory inputs by displacing the arm in the direction of applied force during learning. We observe that following learning there are short latency changes to the response in somatosensory areas of the brain that are reliably correlated with the magnitude of motor learning: subjects who learn more show greater changes in SEP magnitude. The effects we observe are tied to motor learning. When the limb is displaced passively, such that subjects experience similar movements but without experiencing learning, no changes in the evoked response are observed. Sensorimotor adaptation thus alters the neural coding of somatosensory stimuli.
Keywords: motor learning, somatosensory evoked potential, reaching movement
is the neuroplasticity that is associated with motor learning limited to motor areas of the brain, or do the effects of learning extend into nonmotor areas and notably into sensory systems? It is known that there are substantial anatomical interconnections linking the brain's motor and somatosensory regions. Cortical motor areas receive direct inputs from primary (Darian-Smith et al. 1993; Jones et al. 1978) and second somatosensory cortex (Cipolloni and Pandya 1999; Krubitzer and Kaas 1990) and from parietal areas 5 and 7 (Ghosh and Gattera 1995; Petrides and Pandya 1984). Somatosensory areas get direct cortical inputs from primary motor cortex (Darian-Smith et al. 1993; Jones et al. 1978; Krubitzer and Kaas 1990), premotor cortex (Cipolloni and Pandya 1999), and from supplementary motor area (Cipolloni and Pandya 1999; Jones et al. 1978). A change in somatosensory function in association with motor learning would seem to be a natural by-product of this anatomical connectivity. However, apart from behavioral studies (Cressman and Henriques 2009; Haith et al. 2008; Ostry et al. 2010; Wong et al. 2011) and a recent analysis of changes to resting-state networks in association with motor learning (Vahdat et al. 2011), there is little direct evidence that motor learning produces changes in sensory systems. Here we show that motor learning indeed alters the response of somatosensory areas of the brain. The changes we observe are substantially linked to motor learning in the sense that they vary in magnitude with motor learning, and they are not obtained when subjects passively experience the same movement kinematics, but do not experience learning.
We studied motor learning using a force-field adaptation paradigm (Shadmehr and Mussa-Ivaldi 1994) in which subjects had to reach straight ahead to a single visual target while a robot applied forces in a lateral direction in proportion to movement velocity. We assessed changes to sensory function that occur in conjunction with motor learning by using electroencephalography (EEG) to record somatosensory evoked potentials (SEPs) before and after learning. Instead of using electrical stimulation, which is infeasible in the case of elbow and shoulder muscles, we developed a technique in which we recorded SEPs while the robot mechanically displaced the subject's arm in a direction that was aligned with the newly learned force field, orthogonal to the direction of movement.
SEPs have been recorded previously in response to mechanical stimulation. Typically, flexion or extension of the fingers has been used to elicit the SEPs. The earliest responses occur between 35 and 60 ms, depending on the speed of the imposed displacement (Alary et al. 1998; Mima et al. 1996; Papakostopoulos et al. 1974). Current source estimates show initial responses in primary and second somatosensory cortex (Alary et al. 2002). In the one study that we are aware of, in which SEPs were recorded in conjunction with visuomotor learning, using median nerve stimulation, the authors report a transient SEP reduction early in learning followed by a return to baseline values by the time that learning reached asymptotic levels (Bernier et al. 2009).
In the present study, in addition to examining the effects of motor learning on the response of the somatosensory system, we considered the possibility that factors other than learning might produce changes in the response of the brain's sensory areas to the displacement of the limb. Factors such as exposure to the kinematic pattern experienced during training, exposure to an altered statistical distribution of movement directions, or to altered visual information could all possibly lead to changes in the sensory response without requiring learning. Accordingly, we carried out a control study in which we tested for the possibility that sensory change results from these factors rather than from motor learning per se. In the control test, the force-field learning trials were replaced with a control sequence in which the limb was displaced passively by the robot arm to replicate the entire sequence of trajectories experienced by subjects in the active learning condition (Ostry et al. 2010). Thus subjects in the passive control condition experienced the same movement trajectories, the same distribution of movement directions, and the same visual inputs as subjects who moved actively. The difference was that they did not experience learning. By recording SEPs during this procedure, at the same points in the experimental sequence as in the primary experimental manipulation, we show that changes in the neural response to somatosensory stimuli are tied to motor learning.
MATERIALS AND METHODS
Subjects.
Twenty-seven right-handed male subjects between the ages of 18 and 32 yr (mean age of 22.5 yr) participated in the study. Fifteen subjects were tested in the experimental group; twelve were tested in a passive control condition. Subjects had no history of sensory or motor disorders. The McGill University Research Ethics Board approved all experimental procedures. Written, informed consent was obtained from all subjects. The protocol was approved by the Faculty of Medicine Institutional Review Board at McGill University.
Experimental setup.
A two-degree of freedom planar robotic arm (InMotion2, Interactive Motion Technologies) was used for psychophysical part of study (Fig. 1A). Subjects were seated in front of the robot and grasped the handle with their right hand. They either performed reaching movements to a single target in the horizontal plane, or simply held the handle of robot arm while robot displaced the limb under position servo-control. The start position, target, and a cursor that represented the position of the subject's hand were all projected on a semi-silvered mirror that was placed horizontally just above the subject's arm. Two white circles, 20 mm in diameter, indicated the start and target points, while a yellow circle, 12 mm in diameter, represented the location of the hand. Subjects were not able to see their arm or hand at any point during the experiment, and all studies were conducted with low ambient light levels. The movement start point was defined on a per-subject basis, at a handle position 20 cm from trunk in the midsagittal plane. The seat height was adjusted to have an 80° abduction angle at the shoulder. The position of robot handle was recorded by means of 16-bit optical encoders at the robot joints (Gurley Precision Instruments). Subject-applied forces to the handle were measured using a force-torque transducer (ATI Industrial Automation).
Fig. 1.
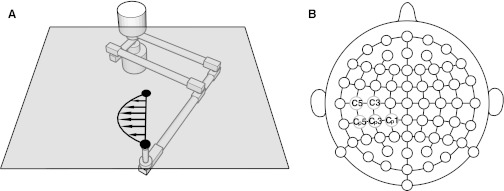
Experimental setup to study motor learning. A: subjects moved the handle of a robot arm to a single visual target. Vision of the arm was occluded. In the force-field condition, the robot applied forces to the handle that varied with movement velocity. B: scalp map showing EEG electrode locations.
Reaching movements.
Subjects were asked to move as straight as possible. The movement amplitude was 20 cm. EEG data were not recorded during this phase of the experiment. A desired maximum tangential velocity was set at 0.5 ± 0.04 m/s. Visual feedback of both hand position and the target were presented throughout. Visual feedback of movement speed was also provided as soon as the subject's hand entered the target zone. The feedback was used to encourage subjects to move within the desired speed range, but trials were not removed from the analysis if the movement fell outside this range. At the end of each movement, the robot returned the subject's hand to the start point. The next trial began after a random delay of 1,500 ± 500 ms. The start of each trial was signaled by a visual cue, and subjects were told that reaction time was unimportant.
In total, subjects completed 250 reaching movements, 100 as null field movements, followed by 150 in a counterclockwise force field. The force field was applied according to Eq. 1.
| (1) |
In this equation, x and y are lateral and sagittal directions, fx and fy are the commanded force to the robot, and vx and vy are hand velocities in Cartesian coordinates.
Passive reaching movements.
For control subjects, we replaced the force-field training trials with a set of passive movements in which the limb was guided under position servo-control by the robot along the desired trajectory. Each of the 150 force-field trials was replaced with the corresponding mean trajectory for that trial, which was obtained from the first 12 of 15 subjects who performed the task under active conditions. Thus subjects in the control condition experienced similar average trajectories and similar average spatial distribution of movements as subjects in the experimental condition, but they did not experience force-field learning. As in the experimental condition, subjects in the passive control first produced the 100 null field movements actively. Next, during the passive movement phase, to make sure that subjects attended to the passive movement task, on 10% of trials, the cursor that represented the subjects' hand was removed from the screen, either in the first or second half of the trajectory. Subjects were required to report whenever the cursor was removed. Ten subjects reported all such occasions, one subject missed one of these trials, and another missed three.
Washout trials were not included in the present experiments. Our laboratory has previously used a similar procedure in which both somatosensory function and learning were assessed in conjunction with force-field adaptation and matched passive control trials (Ostry et al. 2010). Under these conditions, we found that after-effects were present in washout trials following force-field learning. No after-effects were observed in washout trials in the passive control condition. This is consistent with the idea that there is limited motor learning in passive condition movements.
EEG data were obtained at a sampling frequency of 512 Hz using a 64-channel BioSemi ActiveTwo system (Fig. 1B). The electrodes were mounted on an elastic cap that used the standard 10–20 system of electrode placement. Additional electrodes were placed on both ear lobes, at the outer canthus of each eye, and above and below the right eye.
Experimental procedure.
Subjects were tested in a single session that lasted ∼2.5 h, including the explanation of the procedure and setup. Subjects completed five blocks of trials in total. In the first, third, and fifth blocks of experiment, SEPs were recorded in response to position servo-controlled displacements of the arm. In blocks two and four, subjects were trained to make straight reaching movements to a single target.
SEPs.
Mechanical perturbations were used to elicit SEPs. The subject's hand was positioned at the movement start position in the center of the workspace. Subjects were asked to hold their hand in this central location and not to resist the action of the robot. In each set of SEP trials, 400 displacements were applied under position servo-control. The set was divided into four subsets that were separated by 2- to 3-min rest periods. Position servoed displacements were applied pseudorandomly to the right or the left of subjects' midsagittal plane (200 in total in each direction). The displacements were programmed to be 4 cm in amplitude and to last for 1,000 ms (300-ms rise time, 300-ms hold time, and 400-ms fall time). Subjects were required to wait at the target position for a random interval of 1,500 ± 500 ms between perturbations.
The EEG signal that was recorded in response to the displacements was band-pass filtered between 0.75 and 30 Hz using a second-order Butterworth filter and referenced to the average across all 64 channels. Individual SEP epochs extended from 100 ms before perturbation onset to 250 ms after. All epochs were time aligned at the initiation of the force pulse. The mean of the preperturbation part of the signal was subtracted before conducting further analyses. Epochs in which the voltage, at any of the 64 electrode locations or at electrodes placed externally around the eyes, exceeded 50 μV were excluded from analysis. We also looked for the presence of alpha-wave activity and rejected subjects in whom these patterns occurred in over 50% of trials. On this basis, three subjects from the passive condition were excluded from further analysis.
The recorded scalp voltage distribution was displayed graphically as a scalp map (Matlab based EEGLAB toolbox) that showed as a function of time statistically reliable changes in activation following learning (Delorme and Makeig 2004). At each time point and each electrode location, t-scores were computed based on the SEP change following learning, using all trials across all subjects. The t-scores displayed in Fig. 4 were thresholded, as described below, at P < 0.01 (one-tailed) after correcting for family-wise error rate. This error rate was determined at each time point by computing the distribution of maximum t-statistics that were obtained by randomly permuting trials from before and after learning SEP sets. Each random permutation gave rise to 64 t-scores, corresponding to the 64 electrode locations, and gave a single maximum t-value. The entire procedure was repeated 5,000 times and resulted in a distribution of maximum statistics, under the null hypothesis that SEPs are equal before and after learning. From this distribution, we obtained the critical t-value that was used to threshold the displayed scalp images (Pantazis et al. 2005).
Fig. 4.

Topographic probability maps showing electrode locations at which evoked responses change reliably following training. Activation differences following learning (given as t values, thresholded at P < 0.01) are shown at times associated with the first positive and later negative peaks of the SEP. A: force-field learning results in reliable changes in activation at the first peak of the SEP at electrode locations over contralateral somatosensory cortical areas (upper panel). There are no changes in the passive movement condition (lower panel). B: force-field learning also results in changes in activation at the second peak of the SEP at bilateral electrode locations over premotor areas (upper panel). Passive training leads to changes in activation over posterior parietal cortex (lower panel). C: subjects that learned more showed a greater reduction in SEP magnitude.
Current source estimation.
The Brain Electrical Source Analysis software (BESA Research 5.3) was used to obtain estimates of the current source location underlying the recorded scalp voltage distribution. For the purpose of estimation, we used mean SEP values over all subjects and trials at each of the 64 electrode locations and focused on a 20-ms window centered about the first peak at electrode location C3. We used discrete dipole source analysis techniques and also distributed imaging methods (sLORETA, standardized low-resolution electromagnetic tomography; Pascual-Marqui et al. 1994) to obtain estimates of the current source. For the discrete technique, we first established the number of dipoles by using Principal Components Analysis. We found that the first principle component accounted for more than 97% of the variance in the scalp voltage distribution for both the prelearning and the postlearning analyses, as well as for their difference. Accordingly, we used a single dipole to model the current source in each case. Anatomical labels for the resulting dipole locations were obtained using Talairach Client (Lancaster et al. 2000). We used sLORETA to obtain the current density map. For purposes of comparison with the single dipole solution, we found the location corresponding to the point of maximum current density.
Data analysis.
Hand position and subject-applied forces to the robot handle were each sampled at 400 Hz. The recorded signals were subsequently low-pass filtered at 40 Hz using a zero-phase lag Butterworth filter. Position signals were numerically differentiated to produce velocities. The start and end of each trial were defined at the time that hand tangential velocity went above or fell below 5% of peak velocity. The resulting data were time normalized to have the same number of samples in each trial. For purposes of data analysis, the maximum perpendicular deviation (PD) of the hand, from straight line connecting movement start and end of movement, was calculated.
For statistical analyses, learning was assessed using mean PD over the last 10 baseline trials, and the first 10 and last 10 force-field trials. Statistical tests were conducted using a split-plot ANOVA, where the force-field training and passive control groups were a between-subjects factor, and the three kinematic measures were a within-subjects factor.
To conduct statistical analyses of SEPs, mean SEP magnitudes were converted into z-scores on a per-subject basis. A window of 8 ms around the first SEP peak was used for this purpose. Z-scores were obtained using the mean and standard deviation of all trials for each subjects' three SEP tests. Statistical tests were conducted using repeated-measures ANOVA.
RESULTS
The experimental sequence is given in Fig. 2A. We obtained SEPs at three points during the experiment: 1) at the start of the experimental session, 2) after a series of null field movement trials (no load), and 3) after motor learning. Figure 2A also shows the pattern of limb movement over the course of training. Kinematic performance was quantified by computing the mean PD from a line joining movement start and end. Values for PD are shown, averaged over subjects. Data are shown for both the primary manipulation involving active force-field learning and for the passive-movement control condition. It is seen that movements are straight in the null (no-load) condition; they are deflected laterally with introduction of load and reach asymptotic levels at the end of training. In the passive control condition, subjects first produce active movements in the absence of load (null condition). Then, in lieu of force-field trials, the limb is passively guided under position-servo-control through a complete set of 150 trials in which the trajectory sequence is matched on a trial-by-trial basis to the mean of the first 12 of 15 subjects in the force-field learning condition. Representative hand paths, averaged over subjects, are shown in Fig. 2B for both the active learning and passive movement conditions. Note that, in each case, initially curved movements return to near baseline values with training. ANOVA confirmed reliable changes in curvature, in both the force-field learning and passive movement conditions over the course of training [F(2,50) = 123.13, P < 0.001]. The pattern was similar for passive movement and force-field subjects [F(1,25) = 0.34, P > 0.50]. By the end of training, movement curvature for both groups had returned to baseline levels (P > 0.90, Bonferroni-corrected post hoc comparison).
Fig. 2.

Behavioral results for the force-field learning group and the passive control condition. A: experimental sequence. Somatosensory evoked potentials (SEPs) were obtained before and after training (gray vertical bars). All subjects produced active movements in baseline trials (gray and black). The main experimental manipulation involved a force-field training sequence (red). Learning was assessed using the mean perpendicular deviation (PD) of the hand from a line joining movement start and end points. A group of control subjects was tested in a passive condition (cyan) in which subjects held the handle of the robot arm while the robot reproduced the entire series of movements of subjects in the force-field training condition. B: mean hand paths for the force-field training (left) and passive-movement (right) conditions. C: SEPs were elicited as subjects held the handle of the robot arm. The limb was perturbed laterally using a sequence of servo-position controlled displacements (upper panel). The lower panel shows that subject applied forces sensed at the robot handle were closely matched to the commanded forces that displaced the arm.
SEPs were elicited before and after training using robot-controlled displacements of the passive limb. The robot was programmed to produce a sequence of arm displacements under position servo-control with random timing and in random order to the left and the right. The displacement was 4 cm in amplitude, and the limb was held in position for 300 ms and then returned to the center. Mean displacement magnitudes were similar for the three SEP tests for subjects in both the experimental and the passive control groups [F(2,28) = 1.56, P > 0.20, F(2,22) = 0.23, P > 0.70, respectively].
To confirm that subjects' hands were passively displaced by the robot for purpose of eliciting SEPs and that there was no active motor outflow during this procedure, we compared the forces applied by the robot and the measured forces at the handle that reflect the subjects' resistance to the perturbation. Figure 2C shows a sequence of commanded displacements and measures of restoring forces acting against the robot handle. It can be seen that the pattern of restoring forces closely matches the pattern of applied load (see Fig. 2C). The difference in magnitude between applied and measured forces to hand was small, averaging 0.24 N. The mean applied force was 3.42 ± 0.15 N (mean ± SE), and the mean sensed force was 3.64 ± 0.15 N. This means that there is little active force production on the part of the subject during the somatosensory measurement phase of the experiment. Moreover, there were no differences in the magnitude of the sensed force over the course of the three SEP tests for subjects in either the experimental or the passive control conditions [F(2,28) = 0.17, P > 0.80, F(2,22) = 1.26, P > 0.30]. Hence, there is no evidence of differences in forces applied by the robot to elicit SEPs that might account for changes in SEP magnitude.
Figure 3, A and D, shows SEPs recorded over contralateral somatosensory cortex (electrode locations C3 and CP3, see Fig. 1B, negative values are shown in a downward direction) aligned with the initiation of limb displacement. The figure shows mean SEP ± SE for force-field learning trials and comparable data in the passive-movement control condition. Peaks in the SEP are first evident between 70 and 80 ms following the start of limb displacement. There is a later peak at ∼170 ms (see also Fig. 4). If sensory change occurs in conjunction with motor learning, we should expect it to be present in the region of the first positive peak since this peak reflects the immediate consequences of sensory stimulation and is centered on somatosensory areas of the brain. The later negative peaks likely reflect the propagation of any changes due to learning to other brain areas and could possibly reflect factors that are cognitive in nature.
Fig. 3.

Motor learning changes sensory evoked responses at electrode locations above contralateral somatosensory cortex. A and B: mean somatosensory evoked responses (SEPs) at electrode location C3 before and after training for force-field learning (A) and passive movement (B). Changes to the first peak are observed following force-field learning, but not under passive movement conditions. C: Z-scores for the first positive peak of the SEP averaged over subjects decrease reliably following force-field learning, but not after passive movement. D–F: SEP changes with learning at electrode location CP3 are similar to those in the upper panel.
It can be seen that, at both C3 and CP3, the magnitude of the early positive peak is unchanged following null field movements (baseline vs. before training), but after a similar interval involving force-field learning there is a systematic SEP reduction (Fig. 3, A and D). No changes in the magnitude of the early positive peak are observed in the passive-movement control trials (Fig. 3, B and E) which is consistent with the idea that no learning resulted from the passive manipulation. The later negative peak of the evoked response shows a different pattern at the two electrode locations, which is reflected in differences in the distribution of scalp voltage at longer latencies (see Fig. 4).
SEP magnitudes averaged across subjects (±SE) are shown in Fig. 3 for both force-field learning and passive control movements at electrode locations C3 (Fig. 3C) and CP3 (Fig. 3F). Values are expressed in z-score units relative to the mean over the three phases of the SEP procedure. Separate z-score calculations were conducted for the force-field learning and passive movement subjects. The figure gives values for the short latency peak, as these measures are directly associated with the activation at electrode locations above somatosensory cortical areas. It is seen that, at both C3 and CP3 electrode locations, SEPs change reliably following motor learning. A repeated-measures ANOVA followed by Bonferroni corrected post hoc tests found significant changes in SEP following learning at both C3 and CP3 [F(2,28) = 7.02, P < 0.005, F(2,28) = 10.0 P < 0.001, respectively]. At both electrode locations, after-learning SEP values differed reliably from both prelearning SEP measures (P < 0.03 or smaller in all cases). There were no differences between the baseline and before-training SEPs (P > 0.40 or above). Following passive control trials, there are no reliable changes in SEP [F(2,16) = 0.10, P > 0.90, F(2,16) = 2.39, P > 0.10, for C3 and CP3, respectively].
We verified that the magnitude of the first positive peak was matched between force-field learning and passive control subjects prior to the learning sequence. A split-plot ANOVA revealed no differences in the magnitude of the first positive SEP peak. Specifically, we observed no differences between the two baseline SEPs [F(1,23) = 0.006, P > 0.90, F(1,23) = 1.18, P > 0.30, at C3 and CP3, respectively] and no differences in SEP magnitude between experimental and control subjects [F(1,23) = 1.12, P > 0.30, F(1,23) = 1.49, P > 0.20, at C3 and CP3]. Thus in terms of the short latency peak in the SEP response, the only difference we see between experimental and passive control subjects is that, for experimental subjects, SEPs are reduced following learning. No SEP reduction occurs with passive control movements.
While experimental and control groups were equated in terms of the magnitude of the first positive peak of the SEP (prior to learning), the magnitude of the later negative peak differed in the two experimental conditions. This difference in the evoked response can be seen at electrode locations C3 and at CP3 by comparing the magnitude of the later negative peak in Fig. 3, B and E, with that of Fig. 3, A and D, respectively. At both electrode locations, subjects who underwent force-field learning showed larger nonspecific SEP amplitudes at the later negative peak. The fact that the difference is present even under null conditions before learning rules out the possibility that it is learning related. Indeed nothing, other than the participants involved and the positioning of the electrode cap on the skull, differed for the SEPs elicited prior to learning (both groups produced active movements for the null field trials). It is presumably one of these factors that accounts for the observed differences in SEPs at the later negative peak.
We also conducted tests to assess possible differences in SEP for subjects in the experimental group, depending on the direction of the perturbation. We found no directional differences (left vs. right directed perturbation) in SEP magnitude over the three phases of the SEP procedure [F(2,28) = 0.06, P > 0.90, F(2,28) = 0.22, P > 0.80, for C3 and CP3, respectively].
Figure 4 gives topographic probability maps, that is, the distribution, as a function of time, of scalp locations at which sensory activity changes reliably due to learning (P < 0.01, corrected for family-wise error rate, see materials and methods) and corresponding changes in activation in the passive control condition. The upper two rows of the figure map out changes in activation at different times over the course of the first positive peak in the SEP (as shown in Fig. 3). The lower two rows give changes over the course of the later negative peak. It can be seen that motor learning results in short latency changes to sensory function that are greatest over contralateral somatosensory cortex. Longer latency changes are seen over electrode locations in both contralateral and ipsilateral premotor areas. Thus we see that the same sensory stimulus (displacement of the limb) results in different evoked responses after motor learning.
Comparable changes in activation are not observed when SEPs are elicited following passive control trials. Probability maps in the second row of Fig. 4 show that there are no short latency changes (relative to baseline) in SEP (the example shown here is given at a P < 0.05, indicating the absence of even marginal effects in the control condition). Reliable differences in SEP under passive conditions are observed at longer latencies and are centered over more posterior locations in parietal cortex.
We assessed the relationship between motor learning and the magnitude of the first peak of the evoked response. For each of the electrode locations at which SEP magnitudes changed reliably with motor learning, we calculated the correlation between the amount of learning and changes in the magnitude of the somatosensory response. We repeated this calculation for each of the time points shown in Fig. 4, using a 15-ms window centered on each point to obtain measures of SEP change. We quantified motor learning by using changes in average PD between the first 10 and last 10 training trials. We found that changes in SEPs at electrode locations over somatosensory cortex were reliably correlated with the magnitude of motor learning: subjects who learned more showed a greater reduction in SEP magnitude. Fig. 4C shows a representative example of this relationship at electrode location C5. For the first peak of the evoked response, at 63 ms, there was a reliable reduction in SEPs with learning at electrode locations CP1, CP3, and CP5 (r = −0.61, P < 0.02; r = −0.61, P < 0.02; r = −0.62, P < 0.02, respectively). At 71 ms, the SEP reduction was reliable at C3, CP1, and CP3 (r = −0.54, P < 0.05; r = −0.61, P < 0.02; r = −0.60, P < 0.02, respectively). At 79 ms, the correlations were reliable at C5 and CP5 (r = −0.57, P < 0.03; r = −0.55, P < 0.04).
We observed no reliable correlations at the later epochs, 87 ms or 90 ms. At the later negative peak of the evoked response, we found no systematic relationship between SEP change and learning. For this peak, none of the observed changes in SEP magnitudes at any of the time points shown in Fig. 4 was correlated with motor learning (P > 0.05 in all cases). Thus, while learning was systematically related to short latency SEP reductions at electrode locations over somatosensory cortex, the SEP changes observed at the later negative peak, although statistically reliable, were not related to learning, per se.
The changes in the scalp voltage distribution that accompany learning reflect plasticity in the underlying neuronal population. Figure 5 shows scalp topographic maps at the first SEP peak, before and after motor learning. The values are obtained by averaging over all subjects in the force-field learning condition. It is seen that both before and after learning, positive SEPs are located over contralateral parietal cortex, and negative values are in frontal cortex. The peak of the positive evoked response following learning is over electrode location CP3. It can also be seen that, both before and after learning, the positive voltage pattern in parietal cortex is relatively focal, whereas the negative pattern in frontal cortex is diffuse. This is presumably the reason that reliable changes in the evoked response following learning were seen only at electrode locations over parietal cortex (see Fig. 4A).
Fig. 5.

Scalp topographic maps averaged over subjects at the first positive peak of the somatosensory evoked response. A: scalp voltage distribution before motor learning. B: voltage distribution after learning.
We computed characteristics of the dipole current source as a way to quantify neural plasticity. We obtained estimates of each of the position, orientation, and strength of the underlying dipole current source before and after learning (see materials and methods for details). For SEPs elicited before learning, a single dipole in area 2 of left primary somatosensory cortex (Talaraich coordinates [−45, −22, 48], orientation vector [−0.3, −0.9, −0.4], current source strength, 11.36 nAm) accounted for 97.3% of the variance in the scalp voltage. Following learning, a single dipole in area 3 (location [−45, −23, 51], orientation [−0.3, −0.8, −0.5], current source strength, 9.83 nAm) accounted for 96.4% of the variance. Following learning, the estimated dipole locations changed by 0.34 cm, the orientation changed by 7.7°, and there was reduction in strength of 1.53 nAm. Thus the estimated current source is a single dipole located within somatosensory cortical areas and oriented in a posterior direction. This orientation is consistent with the scalp topographic maps shown in Fig. 5.
We also obtained estimates of current source density associated with SEPs before and after learning using sLORETA. Activity peaks before and after learning were in areas 3 and 2 ([−44, −20, 42] and [−45, −22, 47], respectively), with a distance of 0.55 cm between the peaks. Thus both procedures give estimates of the current source location for the first SEP peak in the left primary somatosensory cortex.
We additionally obtained an estimate of the current source location for the SEP change following motor learning. In this case, the peak activity was in area 2 (Talaraich coordinates [−41, −24, 29]). A single dipole at this location accounted for 87.8% of the scalp voltage variance. In summary, consistent with the scalp map in Fig. 4, SEPs following motor learning are centered about locations in contralateral somatosensory cortical areas.
In further analyses, we examined the difference in the estimated current source location for SEPs associated with leftward and rightward displacements of the arm. Although we found no significant difference in the magnitude of the SEPs for displacements in these two directions (see above), these two different perturbation directions presumably recruit different neuronal populations, and this should be reflected in differences in the estimated current source. Using single dipole analyses, we found that the current source locations were located in areas 2 and 3 of left primary somatosensory cortex and, in all cases, accounted for more than 91% of the scalp voltage variance. Before learning, the estimated current source was in area 3 in the response to both leftward and rightward perturbations (Talaraich coordinates [−47, −20, 51] and [−41, −22, 44], respectively). Following learning for leftward perturbations, the estimated source moved to area 2 ([−46, −24, 52]), while for rightward perturbations, the estimated source remained in area 3 ([−44, −21, 50]). This suggests that, both before and after motor learning, leftward and rightward perturbations recruit different neuronal populations.
DISCUSSION
We have shown that motor learning has short-latency effects on the response of somatosensory cortex, even when measured after the end of training. Motor learning appears to be the determining factor behind these effects in that changes in SEP magnitude vary with the extent of learning, and changes in SEPs are not obtained for yoked control movements that do not involve learning (but are matched on kinematic characteristics). The absence of SEP change following null field movements suggests that it is motor learning and not simply efferent outflow that is required to produce the somatosensory change. The presence of changes to SEPs that occur in conjunction with motor learning reveals a new dimension to plasticity in sensory and motor systems. Motor learning does not occur in isolation, but rather leads to changes in sensory areas of the brain. Motor learning is thus associated with changes in a distributed network that involves the brain's motor and sensory regions.
The SEP changes observed in the present study follow the same pattern as psychophysical measures of perceptual change (Ostry et al. 2010, Vahdat et al. 2011). Both SEP magnitudes and measures of sensed limb position vary with the extent of learning, and neither is observed to change in the context of passive movement that does not involve learning. The SEP reduction observed in the present study thus serves as an electrophysiological correlate of limb position change that is measured using psychophysical techniques. The SEP changes following motor learning presumably reflect plasticity in the neuronal population, as evidenced by shifts in the estimated current source location and magnitude. Thus motor learning alters the somatosensory cortical map.
The evoked potentials recorded in the present study had estimated current source locations in primary somatosensory cortex, both before and after motor learning. Single dipoles in these areas accounted for large proportions of the variance in the scalp voltage distribution. Previous studies that have used mechanical displacement of the fingers or wrist to elicit SEPs have reported topographic maps similar to those observed here with a frontal negative and a parietal positive voltage distribution and with similar dipole orientations (Bötzel et al. 1997; MacKinnon et al. 2000; Seiss et al. 2002). However, in the MacKinnon and Seiss papers, the estimated current source was more anterior than here, in primary motor cortex. Our EEG techniques do not permit us to conclusively determine whether the present somatosensory effects are in sensory or motor areas of the brain. Accordingly, it remains to be determined whether motor learning leads to changes in somatosensory function in sensory or motor areas or the two in combination. Having somatosensory effects in motor areas of the brain would not be all that surprising, as there is ample evidence that cortical motor areas are extensively involved in somatosensory function (Romo et al. 2004; Rosén and Asanuma 1972; Wong et al. 1978).
More generally, sensory change can be seen to play a functional role in the learning process. A common observation in studies of motor learning is that, in the washout phase at the end of training, there is persistent error in the sense that movements do not return to previous baseline levels (Caithness et al. 2004; Shadmehr and Holcomb 1997). Our behavioral results suggest that this occurs because learning changes both motor and somatosensory systems in parallel. In Ostry et al. (2010), it is observed that, after motor learning, movements follow trajectories that are aligned with shifted perceptual boundaries. Thus, in effect, the functional role of the observed sensory change is that, in combination with motor learning, the two act together to keep motor and sensory systems in register.
The present findings complement the results of recent studies in which we have used fMRI under resting-state conditions to assess changes that occur in association with motor learning in the functional connectivity between the brain's sensory and motor regions (Vahdat et al. 2011). In that work, it was observed that changes in brain networks that occur in conjunction with learning can be partitioned into those that are primarily motor in nature and those that reflect the perceptual changes that occur in combination with motor learning. We find that changes in functional connectivity, which are related to perceptual change, occur between second somatosensory cortex (SII) and frontal motor areas (ventral premotor cortex and supplementary motor area). The sensory networks that were strengthened in conjunction with motor learning are the same as those involved in perceptual learning and perceptual decision-making in primates (Romo et al. 2002; 2004).
We have measured SEP changes that occur in conjunction with learning immediately following the adaptation procedure. It is difficult to have any sense of their durability. Nevertheless, there is considerable evidence that force-field adaptation produces durable changes in motor behavior at considerable delays after initial training (Nezafat et al. 2001). The somatosensory changes associated with motor learning, when measured behaviorally, likewise show persistence at least for 24 h. Thus it appears that there may be durable changes that are associated with a quite short period of sensorimotor training.
Transient reductions in SEPs have been reported previously in conjunction with finger and limb movement (Papakostopoulos et al. 1975; Rushton et al. 1981; Starr and Cohen 1985). The reduction has been attributed to the idea that the nervous system suppresses sensory inflow associated with self-initiated movement. Typically, SEPs decrease about 100 ms before EMG onset and remain depressed through to the end of the movement, but not longer. It is unlikely that the SEP reduction observed in the present study is a manifestation of the SEP suppression seen in association with movement. First, SEP changes are observed here in the absence of active movement. That is, they are present in testing that is conducted following the completion of the training phase of the experiment. It is also unlikely that the SEP change that we observe here arises due to repeated suppression over the course of learning. Bernier et al. (2009) report that an SEP reduction occurs early in visuomotor learning, but it dissipates quickly, such that SEPs are back to baseline levels well before the end of the training. A further reason for thinking that the effects that we have seen here are not simply the persistence of a sensory suppression mechanism is that sensory suppression is typically associated with a reduction in acuity, rather than shifts in perceptual boundaries that are observed in conjunction with motor learning (Cressman and Henriques 2009; Haith et al. 2008; Ostry et al. 2010; Vahdat et al. 2011). Cortical motor areas are densely interconnected with somatosensory cortex. There are ample opportunities for interactions between sensory and motor areas that extend beyond the reduction of sensory signals in conjunction with movement.
Another possibility is that the changes observed here in the response to mechanical input are primarily attributable to changes in reflexes rather than cortical function. The latency of the observed SEPs in the present paper would be consistent with an interpretation based on the timing of the long-latency reflex response (MacKinnon et al. 2000). While this remains a possibility for the data presented here, other observations suggest that the present results are substantially cortical in nature. In particular, changes in somatosensory perceptual function are observed in the context of identical motor learning paradigms that do not involve reflex elicitation (Cressman and Henriques 2009; Haith et al. 2008; Vahdat et al. 2011). Moreover, there are changes in resting-state cortical somatosensory networks following motor learning under conditions where there is no experimental task at all (Vahdat et al. 2011).
It should be noted that it is not possible under passive movement conditions to fully equate both the movement trajectory and force simultaneously. Thus forces experienced during the passive control movements differ in magnitude from those experienced during learning. Typically, the maximum lateral force at the hand in the passive condition is about one-half of that experienced during active force-field learning (Ostry et al. 2010). However, if the SEP change that we have observed following learning was attributable to experienced force during learning, then a nonzero SEP change should be evident in the passive movement condition, since forces differ from those that are experienced in conjunction with movements under baseline conditions. This is not what was observed.
We considered using alternative control tests which involved active rather than passive movements. One idea was to apply perturbations randomly in either a clockwise or counterclockwise direction during active movement to the target location used for force-field learning. Under such conditions, there should be no learning, but subjects would experience perturbations that, as in learning, are related to movement. If changes in SEPs are due to learning, it could be argued that no changes in SEPs should be expected under these conditions. However, it is known that, when subjects experience unlearnable force-fields, antagonist muscle cocontraction is increased to maintain stability (Burdet et al. 2001). Cocontraction levels change over the course of training (Darainy et al. 2008; Franklin et al. 2008), and its possible effects on SEPs would need to be considered. If SEPs were observed to change under these conditions, it would be difficult to rule out the possibility that the changes were not due to impedance learning.
GRANTS
This research was supported by National Institute of Child Health and Human Development Grants HD-048924 and HD-075740, the Natural Sciences and Engineering Research Council of Canada, and Le Fonds Québécois de la Recherche Sur la Nature et les Technologies, Québec, Canada.
DISCLOSURES
No conflicts of interest, financial or otherwise, are declared by the author(s).
AUTHOR CONTRIBUTIONS
Author contributions: S.M.N., M.D., and D.J.O. conception and design of research; S.M.N. and M.D. performed experiments; S.M.N. and M.D. analyzed data; S.M.N., M.D., and D.J.O. interpreted results of experiments; S.M.N. and M.D. prepared figures; S.M.N. and M.D. drafted manuscript; S.M.N., M.D., and D.J.O. edited and revised manuscript; S.M.N., M.D., and D.J.O. approved final version of manuscript.
REFERENCES
- Alary F, Doyon B, Loubinoux I, Carel C, Boulanouar K, Ranjeva JP, Celsis P, Chollet F. Event-related potentials elicited by passive movements in humans: characterization, source analysis, and comparison to fMRI. Neuroimage 8: 377–390, 1998 [DOI] [PubMed] [Google Scholar]
- Alary F, Simões C, Jousmäki V, Forss N, Hari R. Cortical activation associated with passive movements of the human index finger: an MEG study. Neuroimage 15: 691–696, 2002 [DOI] [PubMed] [Google Scholar]
- Bernier PM, Burle B, Vidal F, Hasbroucq T, Blouin J. Direct evidence for cortical suppression of somatosensory afferents during visuomotor adaptation. Cereb Cortex 19: 2106–2113, 2009 [DOI] [PubMed] [Google Scholar]
- Bötzel K, Ecker C, Schulze S. Topography and dipole analysis of reafferent electrical brain activity following the Bereitschaftspotential. Exp Brain Res 114: 352–361, 1997 [DOI] [PubMed] [Google Scholar]
- Burdet E, Osu R, Franklin DW, Milner TE, Kawato M. The central nervous system stabilizes unstable dynamics by learning optimal impedance. Nature 414: 446–449, 2001 [DOI] [PubMed] [Google Scholar]
- Caithness G, Osu R, Bays P, Chase H, Klassen J, Kawato M, Wolpert DM, Flanagan JR. Failure to consolidate the consolidation theory of learning for sensorimotor adaptation tasks. J Neurosci 24: 8662–8671, 2004 [DOI] [PMC free article] [PubMed] [Google Scholar]
- Cipolloni PB, Pandya DN. Cortical connections of the frontoparietal opercular areas in the rhesus monkey. J Comp Neurol 403: 431–458, 1999 [PubMed] [Google Scholar]
- Cressman EK, Henriques DY. Sensory recalibration of hand position following visuomotor adaptation. J Neurophysiol 102: 3505–3518, 2009 [DOI] [PubMed] [Google Scholar]
- Darainy M, Ostry DJ. Muscle cocontraction following dynamics learning. Exp Brain Res 190: 153–163, 2008 [DOI] [PubMed] [Google Scholar]
- Darian-Smith C, Darian-Smith I, Burman K, Ratcliffe N. Ipsilateral cortical projections to areas 3a, 3b, and 4 in the macaque monkey. J Comp Neurol 335: 200–213, 1993 [DOI] [PubMed] [Google Scholar]
- Delorme A, Makeig S. EEGLAB: an open source toolbox for analysis of single-trial EEG dynamics including independent component analysis. J Neurosci Methods 134: 9–21, 2004 [DOI] [PubMed] [Google Scholar]
- Franklin DW, Burdet E, Tee KP, Osu R, Chew CM, Milner TE, Kawato M. CNS learns stable, accurate, and efficient movements using a simple algorithm. J Neurosci 28: 11165–11173, 2008 [DOI] [PMC free article] [PubMed] [Google Scholar]
- Ghosh S, Gattera R. A comparison of the ipsilateral cortical projections to the dorsal and ventral subdivisions of the macaque premotor cortex. Somatosens Mot Res 12: 359–378, 1995 [DOI] [PubMed] [Google Scholar]
- Haith A, Jackson C, Miall C, Vijayakumar S. Unifying the Sensory and Motor Components of Sensorimotor Adaptation. La Jolla, CA: Advances in Neural Information Processing Systems, 2008 [Google Scholar]
- Jones EG, Coulter JD, Hendry SH. Intracortical connectivity of architectonic fields in the somatic sensory, motor and parietal cortex of monkeys. J Comp Neurol 181: 291–347, 1978 [DOI] [PubMed] [Google Scholar]
- Krubitzer LA, Kaas JH. The organization and connections of somatosensory cortex in marmosets. J Neurosci 10: 952–974, 1990 [DOI] [PMC free article] [PubMed] [Google Scholar]
- Lancaster JL, Woldorff MG, Parsons LM, Liotti M, Freitas CS, Rainey L, Kochunov PV, Nickerson D, Mikiten SA, Fox PT. Automated Talairach atlas labels for functional brain mapping. Hum Brain Mapp 10: 120–131, 2000 [DOI] [PMC free article] [PubMed] [Google Scholar]
- MacKinnon CD, Verrier MC, Tatton WG. Motor cortical potentials precede long-latency EMG activity evoked by imposed displacements of the human wrist. Exp Brain Res 131: 477–490, 2000 [DOI] [PubMed] [Google Scholar]
- Mima T, Terada K, Maekawa M, Nagamine T, Ikeda A, Shibasaki H. Somatosensory evoked potentials following proprioceptive stimulation of finger in man. Exp Brain Res 111: 233–245, 1996 [DOI] [PubMed] [Google Scholar]
- Nezafat R, Shadmehr R, Holcomb HH. Long-term adaptation to dynamics of reaching movements: a PET study. Exp Brain Res 140: 66–76, 2001 [DOI] [PubMed] [Google Scholar]
- Ostry DJ, Darainy M, Mattar AA, Wong J, Gribble PL. Somatosensory plasticity and motor learning. J Neurosci 30: 5384–5393, 2010 [DOI] [PMC free article] [PubMed] [Google Scholar]
- Pantazis D, Nichols TE, Baillet S, Leahy RM. A comparison of random field theory and permutation methods for the statistical analysis of MEG data. Neuroimage 25: 383–394, 2005 [DOI] [PubMed] [Google Scholar]
- Papakostopoulos D, Cooper R, Crow HJ. Cortical potentials evoked by finger displacement in man. Nature 252: 582–584, 1974 [DOI] [PubMed] [Google Scholar]
- Papakostopoulos D, Cooper R, Crow HJ. Inhibition of cortical evoked potentials and sensation by self-initiated movement in man. Nature 258: 321–324, 1975 [DOI] [PubMed] [Google Scholar]
- Pascual-Marqui RD, Michel CM, Lehmann D. Low resolution electromagnetic tomography: a new method for localizing electrical activity in the brain. Int J Psychophysiol 18: 49–65, 1994 [DOI] [PubMed] [Google Scholar]
- Petrides M, Pandya DN. Projections to the frontal cortex from the posterior parietal region in the rhesus monkey. J Comp Neurol 228: 105–116, 1984 [DOI] [PubMed] [Google Scholar]
- Romo R, Hernández A, Zainos A, Lemus L, Brody CD. Neuronal correlates of decision-making in secondary somatosensory cortex. Nat Neurosci 5: 1217–1225, 2002 [DOI] [PubMed] [Google Scholar]
- Romo R, Hernández A, Zainos A. Neuronal correlates of a perceptual decision in ventral premotor cortex. Neuron 41: 165–173, 2004 [DOI] [PubMed] [Google Scholar]
- Rosén I, Asanuma H. Peripheral afferent inputs to the forelimb area of the monkey motor cortex: input-output relations. Exp Brain Res 14: 257–273, 1972 [DOI] [PubMed] [Google Scholar]
- Rushton DN, Rothwell JC, Craggs MD. Gating of somatosensory evoked potentials during different kinds of movement in man. Brain 104: 465–491, 1981 [DOI] [PubMed] [Google Scholar]
- Seiss E, Hesse CW, Drane S, Oostenveld R, Wing AM, Praamstra P. Proprioception-related evoked potentials: origin and sensitivity to movement parameters. Neuroimage 17: 461–468, 2002 [DOI] [PubMed] [Google Scholar]
- Shadmehr R, Holcomb HH. Neural correlates of motor memory consolidation. Science 277: 821–825, 1997 [DOI] [PubMed] [Google Scholar]
- Shadmehr R, Mussa-Ivaldi FA. Adaptive representation of dynamics during learning of a motor task. J Neurosci 14: 3208–3224, 1994 [DOI] [PMC free article] [PubMed] [Google Scholar]
- Starr A, Cohen LG. “Gating” of somatosensory evoked potentials begins before the onset of voluntary movement in man. Brain Res 348: 183–186, 1985 [DOI] [PubMed] [Google Scholar]
- Vahdat S, Darainy M, Milner TE, Ostry DJ. Functionally specific changes in resting-state sensorimotor networks following motor learning. J Neurosci 31: 16907–16915, 2011 [DOI] [PMC free article] [PubMed] [Google Scholar]
- Wong JD, Wilson ET, Gribble PL. Spatially selective enhancement of proprioceptive acuity following motor learning. J Neurophysiol 105: 2512–2521, 2011 [DOI] [PMC free article] [PubMed] [Google Scholar]
- Wong YC, Kwan HC, MacKay WA, Murphy JT. Spatial organization of precentral cortex in awake primates. I. Somatosensory inputs. J Neurophysiol 41: 1107–1119, 1978 [DOI] [PubMed] [Google Scholar]