

Abstract
Taste stimuli encountered in the natural environment are usually combinations of multiple tastants. Although a great deal is known about how neurons in the taste system respond to single taste stimuli in isolation, less is known about how the brain deals with such mixture stimuli. Here, we probe the responses of single neurons in primary gustatory cortex (GC) of awake rats to an array of taste stimuli including 100% citric acid (100 mM), 100% sodium chloride (100 mM), 100% sucrose (100 mM), and a range of binary mixtures (90/10, 70/30, 50/50, 30/70, and 10/90%). We tested for the presence of three different hypothetical response patterns: 1) responses varying monotonically as a function of concentration of sucrose (or acid) in the mixture (the “monotonic” pattern); 2) responses increasing or decreasing as a function of degree of mixture of the stimulus (the “mixture” pattern); and 3) responses that change abruptly from being similar to one pure taste to being similar the other (the “categorical” pattern). Our results demonstrate the presence of both monotonic and mixture patterns within responses of GC neurons. Specifically, further analysis (that included the presentation of 50 mM sucrose and citric acid) made it clear that mixture suppression reliably precedes a palatability-related pattern. The temporal dynamics of the emergence of the palatability-related pattern parallel the temporal dynamics of the emergence of preference behavior for the same mixtures as measured by a brief access test. We saw no evidence of categorical coding.
Keywords: dynamics, gustatory cortex, mixture, rat, taste
in a natural environment, sensory stimuli with which an animal comes into contact are seldom pure. Natural auditory stimuli, for instance, are typically complex mixtures of tones and timbres (Bregman 1990), and natural chemosensory stimuli, such as foods, are typically complex mixtures of molecules (Verhagen and Engelen 2006). It therefore seems likely that our sensory systems, and our gustatory and olfactory systems in particular, have evolved to deal specifically with stimulus mixtures. Given this possibility, it is worthwhile and important to ask how the central nervous system responds to such mixture stimuli. Here, we examine cortical responses to binary taste mixtures, a progression of stimuli varying from 100% taste A to 100% taste B via a range of A+B mixtures.
Although only a few studies have used such stimuli, and in fact only a handful have examined central nervous system taste mixture responses at all, such work (in conjunction with recent work on the dynamics of sensory processing in the taste and odor systems) offers a guide to what cortical responses to taste mixtures might look like. First, recent work on cortical taste processing has demonstrated that responses to single tastes evolve over the course of a second to “code” different aspects of tastes sequentially. Early portions of the response (the 1st 500 ms of taste-specific spiking) appear to reflect physical characteristics of that taste, whereas later portions of the response (typically beginning between 600 and 700 ms after the taste hits the tongue) provide the animal with behaviorally relevant, palatability-related information (Fontanini and Katz 2006; Grossman et al. 2008; Katz et al. 2001; Piette et al. 2012; Sadacca et al. 2012). In light of this model, the late portions of responses to binary taste mixtures could thus be reasonably predicted to reflect mixture palatability, for instance changing monotonically as A+B mixtures progress from being a more palatable taste A to a less palatable taste B.
An alternative scheme whereby cortical neurons might code taste mixtures in a behaviorally relevant manner (and therefore perhaps in relatively late response epochs) is suggested by a phenomenon known as “categorical perception,” whereby an observer experiences a sudden perceptual shift as a stimulus A gradually changes into a stimulus B (Kuhl and Miller 1975; Liberman et al. 1957; Wyttenbach et al. 1996). Consistent with this idea, a recent study showed that responses of ensembles of neurons to a series of odor mixtures in the zebrafish olfactory bulb (Niessing and Friedrich 2010) suddenly change at some mixture between odors A and B (i.e., responses outlined a steep sigmoid curve). It is thus possible that the late portion of cortical responses to taste mixtures exhibits a similar pattern, although categorical perception has not, to our knowledge, been described for chemosensory stimuli.
With regard to the early portion of the response to taste mixtures, predictions drawn from previous work are less clear. As noted above, we have previously suggested that approximately the first 500 ms of stimulus-specific firing observed in response to single tastes appear to reflect physical characteristics of the stimuli. For example, recent studies have shown that early responses to varying concentrations of sodium chloride reflect the concentration of the stimulus (MacDonald et al. 2012; Sadacca et al. 2012). One physical characteristic of mixture stimuli that could be reflected early in the response is how pure the stimulus is. That is, responses could increase or decrease as A+B mixtures progress from pure tastes to 50/50% mixtures. Responses consistent with this scheme have been reported in 5- to 10-s averages of activity in anesthetized animals (Breza and Contreras 2012; Formaker et al. 1997; Miyaoka and Pritchard 1996; Plata-Salaman et al. 1996; Vogt and Smith 1993a,b), and various additive and interactive mechanisms have been proposed to underlie such “mixture-response” patterns (Bartoshuk 1975; Breza and Contreras 2012; Frank et al. 2003; Pangborn and Trabue 1967; Savant and McDaniel 2004).
Here, we tested these various predictions by probing ensembles of neurons in the gustatory cortex (GC) of the rat for responsiveness to a series of taste mixtures varying between 100% sucrose to either 100% citric acid or 100% NaCl. Our results demonstrate that neuronal responses in GC first follow the degree of mixture and then (starting in the 2nd half-second after stimulus presentation) switch to a monotonic following of sucrose/acid content. Behavioral preferences to these stimuli also proved monotonic, with preference following sucrose concentration; moreover, this preference pattern emerged at approximately the same time as the neural monotonic function, further confirming that late neural responses in GC reflect palatability. Our data also reveal novel information regarding the earlier portions of GC responses, which reflect true “mixture suppression” as described previously, wherein the presence of a stronger stimulus inhibits responses to a weaker stimulus.
MATERIALS AND METHODS
Subjects.
Female Long-Evans rats (n = 8, 275–325 g at time of surgery) served as subjects in this study. Animals were maintained on a 12:12-h light-dark cycle and were given ad libitum access to chow and water unless specified otherwise. All procedures were approved by the Brandeis University Institutional Animal Care and Use Committee.
Surgery.
Surgical procedures (Katz et al. 2001) were performed under ketamine/xylazine/acepromazine anesthesia (100, 5.2, and 1 mg/kg, respectively, injected intraperitoneally). Rats were mounted into a stereotaxic device, 5 support/ground screws were inserted into the skull, and a craniotomy was made through which a multielectrode bundle (16 gold-plated nichrome microwires attached to a microdrive) was implanted into GC (1.4 mm anterior to bregma, 5 mm lateral to the midline, and 4.7 mm ventral to the surface of the brain). Once in place, the assembly, along with bilateral intraoral cannulae (IOC), was cemented to the skull using dental acrylic. Rats were given 7 days to recover from the surgery before being subjected to experimental sessions.
Experimental procedures.
After recovery, rats were habituated to the recording setup and placed on mild water restriction (15 ml/day) during the course of electrophysiological recordings. Taste stimuli used in the current study were mixtures of citric acid (100 mM) and sucrose (100 mM) or mixtures of NaCl (100 mM) and sucrose (100 mM) in distilled water. Citric acid of this concentration has a pH of 3 and is considered aversive to rats (Myers and Sclafani 2003). Taste solutions were mixed in the following ratios: 100/0, 90/10, 70/30, 50/50, 30/70, 10/90, and 0/100%. Because the concentrations of components varied across mixtures in this stimulus battery (that is, because we did not hold 1 component constant while changing the other), we also performed an additional set of experiments in which the concentration-matched components of the 50/50% citric acid/sucrose mixture (i.e., 50 mM citric acid and sucrose in distilled water) were also presented in isolation. Stimuli were delivered through IOC (40 μl per trial) with an intertrial interval of random duration between 15 and 25 s. Stimuli were selected randomly on each trial. Sessions consisted of 10–20 repetitions of each stimulus (for an approximate session length of 1 h).
Behavior.
Relative preferences for citric acid/sucrose mixtures were measured using a brief access test (Davis 1973; Smith 2001). Rats were first acclimated to a dark enclosure with a drinking slot in one wall. A mechanical shutter controlled access to each of seven lick spouts that could be positioned behind the drinking slot, opening only for 15-s trial intervals. Each lick on the spout was recorded by a contact circuit. During daily 20-min sessions, rats were presented with one of the seven lick spouts on each trial; each trial was followed by a 15-s intertrial interval. For adaptation/training sessions (n = 4 sessions), all tubes contained distilled water; in the subsequent (n = 2) testing sessions, each tube contained one of the seven mixture stimuli. Tubes were selected semirandomly such that each tube was ultimately sampled an equal number of times; no tube was presented more than once in a row. Rats were placed on a mild water-deprivation schedule (15 ml/day) during the entire course of the behavioral experiment, as they were for the electrophysiological experiment.
Electrophysiological recordings.
Spike waveforms (of no less than 3:1 signal-to-noise ratio) were amplified, filtered, and digitized using Plexon hardware (http://www.plexon.com/). To obtain single-unit activity, waveforms were clustered automatically using the valley-seeking algorithm in Plexon Offline Sorter (Abolafia et al. 2011; Koontz and Fukunaga 1972). After clustering, waveforms were visually inspected to remove clusters containing noise or artifacts, a technique used repeatedly in our laboratory and demonstrated to isolate neural records with single-neuron properties (receptive fields, etc.). All subsequent analyses were performed in MATLAB (http://www.mathworks.com/). The first 100 ms after stimulus delivery was excluded from analysis because of transient artifacts resulting from opening and closing of valves during taste delivery.
Electrodes were lowered 150 μm between sessions to ensure that different units/ensembles of units were recorded in each session. This was confirmed by visual comparisons of average wave shapes recorded from each channel in the different sessions (data not shown).
Data analysis.
For each neuron, spike patterns obtained in response to each of the 7 taste mixtures were averaged over time within 8 consecutive, nonoverlapping 250-ms bins (covering 100–2,100 ms following stimulus onset) and normalized [i.e., baseline (1,000 ms immediately preceding stimulus onset) firing rate subtracted]. The “taste specificity” of each neuron, defined here (as previously, see, e.g., Sadacca et al. 2012) as “firing at significantly different rates in response to different taste stimuli,” was determined by 2-way ANOVA with factors Taste (7 taste mixtures) and Bin (8 consecutive 250-ms bins); a significant main effect for taste revealed taste specificity of the overall responses, and a significant Taste × Bin interaction revealed taste-specific temporal coding. Performing the identical analysis with progressively shorter baseline windows did not alter any of the results described below besides lowering the total number of significant responses as a result of added point noise fluctuations. We also compared the results from ANOVA at two different values of α: 0.01 and 0.001. Both sets of analyses yielded the same result, although the more stringent α value of course lowered the total number of significant effects.
The quality of two different linear fits (least-squares) were assessed on the trial-averaged spiking response in each of the eight 250-ms bins. Responses were fitted against: 1) the percentage of sucrose content (the “monotonic” pattern; see Fig. 1); and 2) the degree of mixture (the “mixture” pattern; see Fig. 1). In addition, we performed a (nonlinear) sigmoid fit against sucrose content as has been done with stimuli from other modalities to evaluate the compatibility of responses with categorical perception (Niessing and Friedrich 2010). We determined how well the data fitted these different patterns by comparing F values (which, used in this way, essentially provide a measure of goodness of fit). Such goodness-of-fit measures allow comparisons between fits that are robust to differences in degrees of freedom (Khan et al. 2008; Leutgeb et al. 2005; Niessing and Friedrich 2010).
Fig. 1.

Hypothetical response patterns to the array of mixture stimuli: responses increasing or decreasing as a function of concentration of sucrose in the mixture (green; the “monotonic” pattern) and responses increasing or decreasing as a function of degree of mixture of the stimulus (magenta; the “mixture” pattern).
To rule out somatosensory contributions to late responses, we quantified rhythmicity of neural activity in the licking range (approximately 4–8 Hz) by computing the spectrum of taste-evoked spiking responses (Katz et al. 2001). We found no difference in 4- to 8-Hz spectral power between neurons that showed a significant fit to the monotonic pattern after 600-ms poststimulus onset and neurons that showed no significant fit to the monotonic pattern after 600-ms poststimulus onset. In light of the results described below, this analysis confirms, as much of our previous work (Fontanini and Katz 2006; Sadacca et al. 2012) has shown, that palatability-related responses are not driven by somatosensory activity.
Histology.
After experimental sessions, subjects were deeply anesthetized and perfused through the heart with saline followed by 10% formalin. Ten seconds of direct current (5–10 μA) were passed through the electrodes from which taste-specific neurons were recorded to lesion-recording sites. Brains were removed and kept immersed in a 30% sucrose/10% formalin mixture until completely fixed. Once fixed, coronal sections (80 μm thick) were cut using a freezing microtome and stained with cresyl violet to visualize cell bodies. We observed no significant differences in response dynamics as a function of location within GC and thus analyze all sessions together.
RESULTS
Dynamic responses to taste mixtures in GC.
Across a total of 22 recording sessions, we recorded the spiking activity of 164 single neurons from the GC of 8 awake rats in response to intraoral delivery of a series of taste mixtures varying between 100% 100 mM sucrose and either 100% 100 mM citric acid or 100% 100 mM NaCl (100/0, 90/10, …, 10/90, 0/100%; see materials and methods). Within each session (lasting ∼1 h), we presented 10–20 trials per stimulus. Five animals were probed for responses to citric acid/sucrose mixtures, and three animals for responses to NaCl/sucrose mixtures. These two stimulus sets yielded similar results and were therefore analyzed as a single data set. Of the 164 GC neurons, 127 (77%) responded in a stimulus-specific manner; that is, produced a firing rate response to at least 1 stimulus that differed from responses to other stimuli according to 2-way ANOVA with factors Taste and Bin (i.e., either a main effect of Taste or a Taste × Bin interaction; α = 0.01; see materials and methods). All analyses presented below focus on this set of taste-specific neurons.
Figure 2 shows the taste-evoked population peristimulus time histogram (1-ms bins) averaged across all tastes and taste-specific neurons. As has been shown previously (e.g., Piette et al. 2012), the earliest response is the strongest, but firing remains elevated well above baseline for >2 s. Overlain is the time-averaged firing rates in the eight consecutive, nonoverlapping 250-ms bins used for analysis (see materials and methods).
Fig. 2.

Average firing rate (z-score ± SE; in gray) over the population of taste-selective gustatory cortex (GC) neurons as a function of time aligned on stimulus onset (solid vertical line). The sharp transient peak at stimulus onset reflects the artifact caused by opening/closing of the solenoids used for taste delivery, which was excluded from all analyses presented in this paper. Black circles show the average firing rate in 8 consecutive 250-ms bins used for analysis, ranging from 100 to 2,100 ms after stimulus onset (indicated by dashed vertical lines).
Figure 3 shows raster plots (panels I) and spike density functions (panels II) for the activity of two example neurons in response to the citric acid/sucrose (Fig. 3A) and NaCl/sucrose (Fig. 3B) stimuli. Both citric acid and sucrose elicited excitatory responses from the neuron shown in Fig. 3A; the neuron in Fig. 3B showed an excitatory response to NaCl and an initial excitatory response followed by an inhibitory response to sucrose. To reduce the clutter caused by presenting responses to all seven stimuli in the mixture series, we present condensed versions of the responses in panels I and II (i.e., responses to the pure tastes as well as the 50/50% mixture). Note that every analysis below was actually performed on patterns across the entire stimulus set (all responses are shown in panels III and IV). For both example neurons, response patterning across taste varied distinctly with time: early in the response, mixtures evoked fewer spikes per second than did either pure taste; the order of responsiveness then switched late in the 1st second of the responses such that mixture stimuli evoked an intermediate number of spikes per second relative to the pure tastes.
Fig. 3.

Raster plots (I) and spike density functions (II) representing the activity of 2 example GC neurons in response to citric acid/sucrose (A) and NaCl/sucrose (B) mixtures. Shown are the responses to 100% citric acid or NaCl (blue), 100% sucrose (red), and the 50/50% mixture (pink). Horizontal green and magenta bars in II indicate time periods of significant (P < 0.05) fit to the monotonic and mixture patterns, respectively. Spike times in II were convolved with a Gaussian kernel (SD = 50 ms) for display purposes. Panels III and IV show the responses (colored squares) to the complete array of taste mixtures averaged over periods of significant monotonic and mixture fit, respectively. Dashed lines in IV indicate linear fits to the data. Note that the mixture pattern was quantified by a single linear fit to the data ordered by degree of mixture but is visualized by plotting neural responses ordered by citric acid/sucrose ratio and plotting the fit as 2 mirror images of the original (single) linear fit.
To evaluate statistically this apparent response dynamic (again, across the full range of stimuli), we probed each 250-ms bin of the response of these example neurons for significant evidence of two firing patterns: 1) monotonic firing rate increases or decreases (related to palatability; see below) as the solution contents shifted between one pure taste to the other, the monotonic pattern (see Fig. 1); and 2) V- or inverted-V-shaped functions reflecting increasing or decreasing responses as the solution contents neared a 50/50% mix, the mixture pattern (see Fig. 1). Based on our published research (Fontanini and Katz 2006; Grossman et al. 2008; Katz et al. 2001; Piette et al. 2012; Sadacca et al. 2012), we predicted that different patterns might be reflected at distinct poststimulus time points and specifically that responses would come to reflect palatability within the 2nd half-second following stimulus administration after first reflecting some other property, perhaps the degree of mixture.
This analysis revealed that, indeed, taste responses of both neurons shown in Fig. 3 tended to reflect two different patterns in sequence: responses were first (350 and 100 ms after stimulus onset for the neurons shown in Fig. 3, A and B, respectively) significantly correlated with the mixture pattern (reflecting degree of mixture; see panels III; P of the r < 0.05); later (1,100 and 350 ms after stimulus onset, respectively), responses came to reflect the monotonic pattern [reflecting percentage of sucrose (Fig. 3A) or NaCl content (Fig. 3B), respectively; see panels IV; P < 0.05]. Note that the mixture pattern was quantified by a single linear fit to the data ordered by degree of mixture but is visualized by plotting neural responses ordered by citric acid-to-sucrose ratio and plotting the fit as two mirror images of the original (single) linear fit. The fact that both stimulus sets (citric acid/sucrose and NaCl/sucrose) elicit the same dynamics demonstrate that they do not depend on the precise choice of taste (importantly, they cannot be explained in terms of the specific nontaste properties of acid).
GC mixture responses reliably reflect first mixture and then monotonic patterns.
The phenomenon observed in the example neurons shown in Fig. 3 proved robust in that the switch from mixture to monotonic response patterns characterized the average response of the entire population of GC neurons. Figure 4A presents the percentage of taste-specific response patterns that showed significant monotonic and/or mixture pattern fits in each time bin. Early in the response (i.e., before 600-ms poststimulus), mixture responses were significantly more common than monotonic responses [χ2(1) = 8.03, P < 0.01]; after 600 ms, this pattern reversed [χ2(1) = 22.78, P < 0.001].
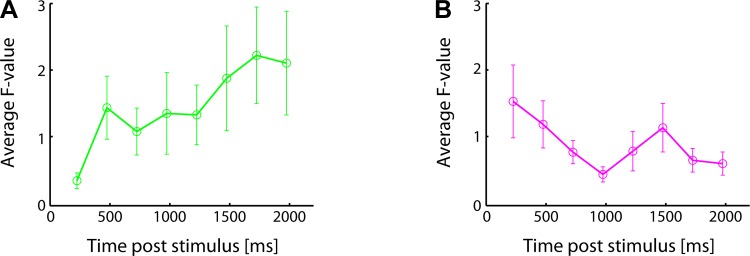
Fig. 4.

A: percentage of taste-specific neurons that showed significant fits of the monotonic and mixture patterns to the response in 8 consecutive 250-ms bins. B: average (±SE over all taste-specific neurons) F value for monotonic and mixture fits over time.
The same effect was observed when averaging F values for the fits to both functions (see materials and methods). Figure 4B shows the average F values for monotonic and mixture fits in each time bin. Note that we included all 127 taste-specific neurons for this analysis to demonstrate that the “mixture before monotonic” pattern is visible in the entire population of GC responses. Before 600 ms (bins 1–2 after stimulus onset), the average F value for mixture fits was significantly higher than the average F value for monotonic fits [t(253) = 2.28, P = 0.02]; after 600 ms (bins 3–8 after stimulus onset), this pattern was reversed [t(761) = 4.38, P < 0.001]. The latency at which the monotonic pattern emerged is in good agreement with the onset of palatability coding observed in our previous studies (e.g., Grossman et al. 2008; Piette et al. 2012; Sadacca et al. 2012).
For the sake of completeness and to facilitate comparisons with studies that have shown categorical patterns in neural responses to mixture stimuli from other sensory domains (Niessing and Friedrich 2010; Sigala et al. 2011), we also fitted sigmoidal functions to the responses of all taste-specific neurons. Sigmoid functions, however, failed to provide better fits than the two linear patterns at any time point (a fact that is unsurprising given the lack of evidence for categorical perception in taste): average F values for sigmoid fits were smaller than average F values for either the monotonic or the mixture fits over the entire time course of the response.
Although 127 cells responded in a nominally taste-specific manner, responding distinctly to at least 1 taste, the responses of these 127 neurons were not homogenous: in some, only the mixture pattern reached significance; in some, only the monotonic pattern reached significance; in some, both reached significance; and in some, neither reached significance. The observed mixture-to-monotonic sequence of coding patterns did not reflect an artifact of averaging across two separate groups of mixture and monotonic neurons, however, a fact that became clear when we analyzed the coding patterns displayed by subgroups neurons: 1) neurons for which only the mixture pattern reached significance (n = 19); and 2) neurons for which only the monotonic pattern reached significance (n = 23).
Figure 5 shows the results of this analysis, confirming that dynamics observed in the population could also be observed in all groups of taste-responsive neurons: in neurons that were selected on the basis of producing a significant fit only to the mixture pattern, F values for the monotonic fit increased over the course of the response (Fig. 5A; regression of F value on time poststimulus onset: F = 6.35, P = 0.013); and in neurons that were selected on the basis of producing a significant fit only to the monotonic pattern [furthermore, F values for the mixture fit decreased over the course of the response (Fig. 5B; regression of F value on time poststimulus onset: F = 3.85, P = 0.013)]. Finally, for the group of neurons in which both mixture and monotonic fits reached significance, significant mixture fits preceded significant monotonic fits in 10 of these 13 neurons (77%; sign test: P < 0.05). Together, these data indicate that mixture and monotonic coding patterns are not reflected in 2 separate groups of neurons: even when analyzing data samples specifically selected for significantly showing only 1 pattern or the other, GC neurons 1st reflect mixture coding and come to reflect the monotonic code later.
Fig. 5.
A: F values for the monotonic fit averaged (±SE) over all neurons that showed a significant fit only to the mixture pattern. B: F values for the mixture fit averaged (±SE) over all neurons that showed a significant fit only to the monotonic pattern.
The observed mixture pattern is the result of true mixture suppression.
Although the above analyses reveal how well responses are captured by the monotonic and mixture patterns, they provide no information as to which of the 2 possible mixture patterns, V-shaped or inverted-V-shaped, was produced (nor do they reveal which of the 2 monotonic patterns, increasing or decreasing with sucrose content, was produced). Since both patterns are evaluated using linear fits, a single parameter (slope) can distinguish between these possibilities: for monotonic fits, positive (negative) slopes correspond to responses that increase (decrease) with sucrose concentration; for mixture fits, we performed a linear fit on the data ordered as a function of degree of mixture (see Fig. 1); positive (negative) slopes correspond to inverted-V-shaped (V-shaped) response profiles. Figure 6 plots the average slope over all taste-specific neurons as a function of poststimulus time.
Fig. 6.

Average (±SE over all taste-specific neurons) slope of the monotonic and mixture fits over time.
Over the population of neurons, slopes of monotonic fits were not significantly different from zero [t-test: t(1015) = 0.02; P = 0.98]. Moreover, the number of significant positive slopes was not different from the number of significant negative slopes (n = 60 and n = 52, respectively). Slopes of mixture fits, on the other hand, were significantly biased toward negative values [t-test: t(1015) = 4.18; P < 0.001], and this bias was most pronounced early in the response, when most mixture fits were observed. Thus, although “sucrose-best” monotonic responses occurred with equal probability to “acid-best” monotonic responses, firing rates during mixture coding predominantly decreased as a function of degree of mixture.
Such a mixture pattern could conceivably arise via either of at least two possible mechanisms. First, the mixture pattern could reflect a phenomenon previously described as mixture suppression, wherein the presence of one taste in the mixture (typically the most effective stimulus; see Vogt and Smith 1993a,b) suppresses the response to the other taste. However, it is also possible that the mixture pattern more simply reflects the (potentially nonlinear) concentration-dependent response function of GC neurons to the individual components of the stimulus. In this respect, it is important to note that the taste mixtures used in the above analysis differed not only in degree of mixture, but also in concentration of the component tastes (for example, by mixing 100 mM citric acid and 100 mM sucrose in a 50/50% mixture, the concentrations of citric acid and sucrose are reduced to 50 mM each); given this fact, if the concentration-response function of a neuron for each individual taste in isolation is nonlinear, such that its normal response to the 50 mM stimulus is <50% of its response to the 100 mM stimulus, then the summation of these reduced responses in the context of the mixture stimuli could in theory result in mixture patterns.
We distinguished between these possibilities, in a separate group of animals, by recording responses of GC neurons to a different stimulus battery: in addition to delivering 100 mM citric acid, 100 mM sucrose, and the 50/50% mixtures of these tastes, we also delivered 50 mM citric acid and 50 mM sucrose, that is, the precise component tastes of the 50/50% mixture. If the observed suppression of responses to taste mixtures is actually the result of linear response summation (i.e., not true mixture suppression), the response to the 50/50% mixture of 100 mM solutions (i.e., a solution of 50 mM sucrose and 50 mM acid) should be identical to the sum of the response to the 50 mM sucrose and 50 mM sucrose solutions:
On the other hand, if the observed suppression in responses to taste mixtures is the result of true mixture suppression, the response to the 50/50% mixture of 100 mM solutions should be less than the sum of the component responses, in extremum reflecting total suppression of the less effective by the more effective stimulus (defined as the component taste that elicited the greatest response):
We recorded responses to this battery of tastes from a total of 46 neurons in 2 rats (2 sessions/rat), of which n = 23 (50%) proved taste-specific according to 2-way ANOVA. For this analysis, we considered only the 1st response bin (100–350 ms after stimulus onset) because the mixture pattern was most reliably found in this time period (see Fig. 3). Among the 23 taste-specific neurons, 65% (n = 15) showed the mixture pattern in the 1st bin following stimulus onset [73% (n = 11) of which showed the inverted V-shaped pattern].
Figure 7 shows raster plots (Fig. 7A) and spike density functions (Fig. 7B) of the response of an example neuron to 50 mM citric acid, 50 mM sucrose, and a 50/50% mixture consisting of the same concentrations. Averaged responses during the first bin after stimulus onset (100–350 ms) to the same stimuli as well as to 100 mM citric acid and 100 mM sucrose are shown in Fig. 7C: the response to the 50/50% mixture is significantly suppressed relative to the sum of the responses to the component tastes but not significantly different from the response to the most effective component (citric acid in this example).
Fig. 7.

Raster plots (A) and spike-density functions (B) representing the activity of an example GC neuron in response to 50 mM citric acid, 50 mM sucrose, and a 50/50 mM citric acid/sucrose solution. Dashed vertical lines in B indicate the on- and offset of the 1st bin after stimulus onset. C: average (±SE over trials) normalized firing rate of the neuron shown in A and B during the 1st bin after stimulus onset in response to 100 and 50 mM citric acid and 100 and 50 mM sucrose as well as a 50/50 mM citric acid/sucrose solution. Cyan plus sign indicates the sum of the responses to the 50 mM solutions presented in isolation. Significance was obtained from t-test (n.s, not significant).
Most neurons in our sample followed the pattern observed in the example shown in Fig. 7 with responses to the 50/50% mixture suppressed relative to the sum of the responses to the component tastes but not significantly different from the responses to the most effective component. The bars in Fig. 8 plot, for all 15 neurons that exhibited the mixture pattern, the response difference between summation of the 50% A and B stimuli and the response to the mixture of these stimuli:
ordered by the magnitude of the difference. Negative values indicate that the response to the 50/50% mixture is enhanced compared with the summed response to the component tastes; positive values indicate that response to the 50/50% mixture is suppressed relative to the summed response to the component tastes. From this presentation, it is clear that, for the majority of neurons (n = 8 out of 15, 53%), the difference between the predicted mixture response (based on the assumption of linear summation) and the actual mixture response was significantly different from 0 (t-test: P < 0.05). Furthermore, every single one of the significant response differences reflected response suppression (i.e., a positive difference score); in fact, response suppression was significant in almost every case (n = 8 out of 10 neurons, or 80%) for which the difference was positive. In contrast, none of the five cases of possible response enhancement was significant.
Fig. 8.

Average (±SE over trials) normalized difference between the response to the 50/50% mixture and the summed response to the component tastes (black bars) and between the response to the 50/50% mixture and the most effective stimulus (red triangles) for all neurons that showed the mixture pattern in the 1st bin after stimulus onset. Black and red asterisks indicate statistical significance (t-test: P < 0.05) of the respective response differences.
In contrast, responses to 50/50% mixtures seldom differed significantly from responses to the most effective pure stimulus in the majority of neurons that exhibited the mixture pattern (t-test: P > 0.05 in 13 out of 15, 87%). The red triangles in Fig. 8 plot the differences from most effective stimulus response:
for the same 15 neurons. Although a lack of significant difference cannot technically prove that a mixture response equals a pure response to the most effective component, these results certainly indicate that the mixture pattern observed in the early response of GC neurons to taste mixtures is the result of true mixture suppression and not the result of summation of inputs driven by the component tastes.
The observed monotonic pattern reflects palatability.
To assess the behavioral relevance of neural responses to taste mixtures described above, we assessed rats' preference for taste mixtures using a brief access test. Separate groups of rats provided behavioral and electrophysiological data; the groups were treated identically, however, with regard to handling and water restriction.
The brief access task assesses preference in terms of the number of licks taken during repeated 15-s trials of access to one of the stimuli (chosen pseudorandomly) within the battery of citric acid/sucrose mixtures (100/0, …, 0/100%). Note that the method of taste delivery in the brief access task differs in important ways from the method of taste delivery during neural recording sessions: the former relies on rats actively sampling taste solutions by licking from a lick spout, and the latter on passive delivery of taste solutions into the oral cavity through IOC. However, measures of palatability obtained using the two methods are often similar (Grill and Norgren 1978).
Figure 9A plots the data obtained from the brief access task, averaged across the entire 15-s duration of the trials, as a function of citric acid-to-sucrose ratio for four individual rats. Each rat's data are plotted separately, with the population average overlain in bold. The preference for solutions increased monotonically as the sucrose content in the solution increased. This monotonic dependence of preference on sucrose content, which essentially mirrors the monotonic function used to evaluate neural firing that became prominent after 600 ms following stimulus delivery, was consistent across rats. The match between the empirical palatability function and the theoretical monotonic function was high enough, in fact, that substitution of one for the other had no impact at all on any results described above: late GC responses faithfully reflect the palatability of our binary mixture stimuli. The very fact that these behavioral data were collected in a different context and using a different fluid administration technique than the electrophysiology data, differences that should, if anything, limit and reduce the correlation between the two, are a testament to the robustness of palatability-related firing observed in GC.
Fig. 9.

A: average (±SE) number of licks taken from the array of citric acid/sucrose mixtures presented on repeated 15-s trials. Data are plotted for 4 individual animals (thin lines) as well as averaged over all animals (thick line). B: average (±SE over animals) data from A broken down in 4 consecutive 250-ms bins starting 100 ms after trial onset.
The fact that mixture responses in GC switched to palatability patterning only after >600 ms led us to predict that the monotonic pattern observed in preference behavior might develop across a similar time course (i.e., emerging only following 600 ms of exposure to the stimulus). To test this prediction, we analyzed the brief access licking data using the same time bins used for analysis of neural activity. Figure 9B shows the result of this analysis, which reveals that the monotonic relationship between preference and sucrose content was entirely absent before 350 ms after the start of a trial and emerged strongly only after 600 ms.
Inferential statistics verified this observation: the correlation between the overall monotonic preference function (Fig. 9A) with the function calculated during the first bin (100–350 ms after trial onset) was not significant (r = 0.62, P = 0.14); the correlation in the second bin (350–600 ms after trial onset) was marginally significant (r = 0.77, P = 0.05); and the correlations in bins 3 and 4 were highly significant (r = 0.99, P < 0.001, and r = 0.98, P < 0.001, respectively).
Thus we found a strong correlation between the emergence of monotonic response patterns in GC and a behavioral measure of palatability, providing further confirmation that palatability processing is visible exclusively in later portions of GC responses (as is the case for responses to pure tastes varying in quality and concentration; Piette et al. 2012; Sadacca et al. 2012). In addition, our data reveal novel information about earlier portions of these responses, which are not necessarily simple reflections of the physical stimulus but rather reflect interactions between neurons activated by each individual taste. GC responses to the binary taste mixtures used here suggested first mixture suppression and then palatability coding with the switch occurring at approximately the time suggested by current behavioral (and previous neural) analysis.
DISCUSSION
Stimuli impinging on an animal's sensory epithelia perturb ongoing patterns of activity in central nervous system networks (Deco and Hugues 2012). The effect of such a perturbation is likely to be dynamic because the system is distributed and the connectivity recursive and complex (Jones et al. 2006). Furthermore, this complexity of circuitry includes, as early into the system as the first brain-stem relay (in the taste system: the medullar nucleus of the solitary tract or NST; Wang and Bradley 1993), large numbers of inhibitory interneurons. Thus it makes sense that presenting binary taste mixtures, that is, activating two taste input pathways simultaneously, should cause mixture effects (Bartoshuk 1975; Frank et al. 2003; Moskowitz 1972; Oram et al. 2001; Pangborn and Trabue 1967). Indeed, nonlinear interactions between taste inputs have previously been observed in neural responses at various stages along the taste pathway (Miyaoka and Pritchard 1996; Plata-Salaman et al. 1996; Vogt and Smith 1993a,b), as early as efferent neurons of the chorda tympani (Breza and Contreras 2012), suggesting that mixture interactions are a basic feature of taste processing. The present results suggest that this feature is preserved in cortical processing of taste mixtures but that mixture suppression is short-lived in GC responses.
Previous work also suggests, however, that GC activity comes to reflect faithfully the palatability of proffered taste stimuli (Fontanini and Katz 2006; Grossman et al. 2008; Piette et al. 2012; Sadacca et al. 2012), which, in the case of the current stimulus battery, is a simple monotonic function of sucrose percentage in the mixture after 600–800 ms of poststimulus time (slight between-study differences in the onset of palatability coding are likely attributable to minor differences in stimulus set and analyses). We cannot conclusively rule out the possibility that palatability-related firing in GC is a reflection of somatosensory activity as we did not directly compare neural responses with oral movements. However, previous work has provided a good deal of evidence that is inconsistent with this suggestion. First, Fontanini and Katz (2006) noted that GC neurons with somatosensory receptive fields (indexed in terms of the notable 5- to 7-Hz modulation in their firing linked to licking) are by and large not the same neurons that fire in a palatability-related manner. Sadacca et al. (2012), meanwhile, showed that cortical neurons follow subtle differences in palatability that are not reflected in differences in oral movements as measured with EMG (Travers and Norgren 1986).
Finally, EMG responses to tastes of distinct palatability prove to be virtually indistinguishable from one another until at least 1 full second after taste delivery (Travers and Norgren 1986). Palatability-related coding in GC, meanwhile, appears >300 ms earlier than these palatability-related motor behaviors (Figs. 3B and 4; see also Piette et al. 2012; Sadacca et al. 2012) and thus cannot reflect them. Consistent with this earlier work on basic tastes, GC mixture responses tended to shift from a mixture-suppression coding scheme in the 1st half-second to a palatability-related code in the 2nd half-second.
At no point in this process did we observe categorical coding (which would have appeared as a steep sigmoidal curve such that most of the mixture responses were highly similar to 1 of the 2 pure stimulus responses) of the type that has been suggested to occur in the olfactory system (Niessing and Friedrich 2010) nor was any categorical perception evident in our behavioral test, which not only showed a clear monotonic pattern of preference, but also showed that pattern emerging on approximately the same time scale of monotonic palatability-related coding in GC. This behavior-brain concordance strongly suggests that, at least under the circumstances described here, palatability is processed after approximately 600–800 ms of poststimulus time. This is not to say that the dynamics observed in the present study are completely independent of mode of stimulus presentation. Indeed, behavioral context has previously shown to influence taste responses and dynamics of taste coding profoundly (Fontanini and Katz 2006; Samuelsen et al. 2012; Stapleton et al. 2006; Yoshida and Katz 2011). We do not yet know how mixture coding early in the response to taste mixtures may change with behavioral context. Note that any differences in behavioral context between the recording experiment and brief access task should, if anything, reduce correlations measured between contexts, and thus they only serve to make the robustness of the observed behavior-brain concordance more noteworthy.
On the basis of previous work using only basic tastes, we have suggested that the “middle epoch” of GC taste responses (i.e., the period of activity following stimulus delivery by 200–800 ms) is related to processing of simple physical aspects of taste stimuli such as quality (Fontanini and Katz 2006; Katz et al. 2001) or concentration (Sadacca et al. 2012), a characterization supported by recent data showing that activity in this epoch is sharpened in the context of a behavioral task requiring discrimination of taste qualities (Yoshida and Katz 2011). Although it is possible that the observed nonlinear mixture interactions might provide coding space to represent physicochemical and qualitative aspects of complex mixtures, the current results strongly suggest that we revise the conception of the middle epoch reflecting simple physical aspects of taste stimuli in that they demonstrate that responses during this epoch may fail to be related directly to stimulus properties: taste processing starts with nonlinear interactions (the inhibition of responses to 1 component of a mixture by neurons activated by the other component), which are then resolved into a behaviorally relevant code. This property of taste coding is difficult to detect using simple stimuli.
To a large extent, our results are compatible with those of previous investigations. Studies in which neural responses to binary taste mixtures have been assayed have reported a good deal of mixture suppression (in addition to some amount of evidence of mixture enhancement); although no evidence of mixture processing evolving through time has been reported (Miyaoka and Pritchard 1996; Plata-Salaman et al. 1996; Vogt and Smith 1993a,b), this may be because all of the previous studies specifically looking at GC mixture responses have been performed on primates and because all mixture studies performed on rodents have assayed responses of subjects under anesthesia. Furthermore, whereas we delivered multiple trials of a relatively small battery of taste stimuli, previous studies have delivered only 1–3 trials of each of a larger stimulus battery; our approach provides us with the added statistical power necessary to perform analysis of response time courses and in addition allowed us to see responses too transient or subtle to be detected using smaller numbers of trials. Any combination of these differences could explain the between-study differences.
Although mixture suppression has been the term most frequently used to describe the results of earlier studies, the oft-observed phenomenon has also been described as the domination of neural responses by the most effective stimulus (Vogt and Smith 1993a,b): if one taste drives a neuron more strongly than another, the response of that neuron to a mixture of these two tastes is very similar to the response to the most effective stimulus alone. Although studies in other sensory domains and investigations of multimodal stimulus pairs have suggested a great deal of mixture enhancement and mutual inhibition (Ghazanfar et al. 2005; Kayser et al. 2010), our results are consistent with a simpler model in which the strongest response dominates the mixture response, inhibiting the normal response to the other mixture component.
In summary, the most likely explanation for our results is that excitatory and inhibitory interactions between taste channels result in early nonlinearities of binary mixture coding. This nonlinear network interaction represents the primary, basic response of GC to mixture stimuli that must be dealt with as the system processes the taste information, a process that ends with behaviorally relevant (i.e., palatability-specific) coding.
GRANTS
This work was supported by National Institute of Deafness and Other Communications Disorders Grant DC-7703 (to D. B. Katz).
DISCLOSURES
No conflicts of interest, financial or otherwise, are declared by the author(s).
AUTHOR CONTRIBUTIONS
J.X.M. and D.B.K. conception and design of research; J.X.M. performed experiments; J.X.M. analyzed data; J.X.M. and D.B.K. interpreted results of experiments; J.X.M. prepared figures; J.X.M. and D.B.K. drafted manuscript.
REFERENCES
- Abolafia JM, Martinez-Garcia M, Deco G, Sanchez-Vives MV. Slow modulation of ongoing discharge in the auditory cortex during an interval-discrimination task. Front Integr Neurosci 5: 60, 2011 [DOI] [PMC free article] [PubMed] [Google Scholar]
- Bartoshuk LM. Taste mixtures: is mixture suppression related to compression? Physiol Behav 14: 643–649, 1975 [DOI] [PubMed] [Google Scholar]
- Bregman AS. Auditory Scene Analysis. Cambridge, MA: MIT Press, 1990 [Google Scholar]
- Breza JM, Contreras RJ. Acetic acid modulates spike rate and spike latency to salt in peripheral gustatory neurons of rats. J Neurophysiol 108: 2405–2418, 2012 [DOI] [PMC free article] [PubMed] [Google Scholar]
- Davis JD. The effectiveness of some sugars in stimulating licking behavior in the rat. Physiol Behav 11: 39–45, 1973 [DOI] [PubMed] [Google Scholar]
- Deco G, Hugues E. Neural network mechanisms underlying stimulus driven variability reduction. PLoS Comput Biol 8: e1002395, 2012 [DOI] [PMC free article] [PubMed] [Google Scholar]
- Fontanini A, Katz D. State-dependent modulation of time-varying gustatory responses. J Neurophysiol 96: 3183–3193, 2006 [DOI] [PubMed] [Google Scholar]
- Formaker BK, MacKinnon BI, Hettinger TP, Frank ME. Opponent effects of quinine and sucrose on single fiber taste responses of the chorda tympani nerve. Brain Res 772: 239–242, 1997 [DOI] [PubMed] [Google Scholar]
- Frank ME, Formaker BK, Hettinger TP. Taste responses to mixtures: analytic processing of quality. Behav Neurosci 117: 228–235, 2003 [DOI] [PubMed] [Google Scholar]
- Ghazanfar AA, Maier JX, Hoffman KL, Logothetis NK. Multisensory integration of dynamic faces and voices in rhesus monkey auditory cortex. J Neurosci 25: 5004–5012, 2005 [DOI] [PMC free article] [PubMed] [Google Scholar]
- Grill HJ, Norgren R. The taste reactivity test. I. Mimetic responses to gustatory stimuli in neurologically normal rats. Brain Res 143: 263–279, 1978 [DOI] [PubMed] [Google Scholar]
- Grossman SE, Fontanini A, Wieskopf JS, Katz DB. Learning-related plasticity of temporal coding in simultaneously recorded amygdala-cortical ensembles. J Neurosci 28: 2864–2873, 2008 [DOI] [PMC free article] [PubMed] [Google Scholar]
- Jones LM, Fontanini A, Katz DB. Gustatory processing: a dynamic systems approach. Curr Opin Neurobiol 16: 420–428, 2006 [DOI] [PubMed] [Google Scholar]
- Katz DB, Simon SA, Nicolelis MA. Dynamic and multimodal responses of gustatory cortical neurons in awake rats. J Neurosci 21: 4478–4489, 2001 [DOI] [PMC free article] [PubMed] [Google Scholar]
- Kayser C, Logothetis NK, Panzeri S. Visual enhancement of the information representation in auditory cortex. Curr Biol 20: 19–24, 2010 [DOI] [PubMed] [Google Scholar]
- Khan AG, Thattai M, Bhalla US. Odor representations in the rat olfactory bulb change smoothly with morphing stimuli. Neuron 57: 571–585, 2008 [DOI] [PMC free article] [PubMed] [Google Scholar]
- Koontz WL, Fukunaga K. Nonparametric valley-seeking technique for cluster analysis. IEEE Trans Comput C21: 171–178, 1972 [Google Scholar]
- Kuhl PK, Miller JD. Speech perception by the chinchilla: voiced-voiceless distinction in alveolar plosive consonants. Science 190: 69–72, 1975 [DOI] [PubMed] [Google Scholar]
- Leutgeb JK, Leutgeb S, Treves A, Meyer R, Barnes CA, McNaughton BL, Moser M, Moser EI. Progressive transformation of hippocampal neuronal representations in “morphed” environments. Neuron 48: 345–358, 2005 [DOI] [PubMed] [Google Scholar]
- Liberman AM, Harris KS, Hoffman HS, Griffith BC. The discrimination of speech sounds within and across phoneme boundaries. J Exp Psychol 54: 358–368, 1957 [DOI] [PubMed] [Google Scholar]
- MacDonald CJ, Meck WH, Simon SA. Distinct neural ensembles in the rat gustatory cortex encode salt and water tastes. J Physiol 590: 3169–3184, 2012 [DOI] [PMC free article] [PubMed] [Google Scholar]
- Miyaoka Y, Pritchard TC. Responses of primate cortical neurons to unitary and binary taste stimuli. J Neurophysiol 75: 396–411, 1996 [DOI] [PubMed] [Google Scholar]
- Moskowitz HR. Perceptual changes in taste mixtures. Percept Psychophys 11: 257–262, 1972 [Google Scholar]
- Myers KP, Sclafani A. Conditioned acceptance and preference but not altered taste reactivity responses to bitter and sour flavors paired with intragastric glucose infusion. Physiol Behav 78: 173–183, 2003 [DOI] [PubMed] [Google Scholar]
- Niessing J, Friedrich RW. Olfactory pattern classification by discrete neuronal network states. Nature 465: 47–52, 2010 [DOI] [PubMed] [Google Scholar]
- Oram N, Laing DG, Freeman MH, Hutchinson I. Analysis of taste mixtures by adults and children. Dev Psychobiol 38: 67–77, 2001 [DOI] [PubMed] [Google Scholar]
- Pangborn RM, Trabue IM. Detection and apparent taste intensity of salt-acid mixtures in two media. Percept Psychophys 2: 503–509, 1967 [Google Scholar]
- Piette CE, Baez-Santiago MA, Reid EE, Katz DB, Moran A. Inactivation of basolateral amygdala specifically eliminates palatability-related information in cortical sensory responses. J Neurosci 32: 9981–9991, 2012 [DOI] [PMC free article] [PubMed] [Google Scholar]
- Plata-Salaman CR, Smith-Swintosky VL, Scott TR. Gustatory neural coding in the monkey cortex: mixtures. J Neurophysiol 75: 2369–2379, 1996 [DOI] [PubMed] [Google Scholar]
- Sadacca BF, Rothwax JT, Katz DB. Sodium concentration coding gives way to evaluative coding in cortex and amygdala. J Neurosci 32: 9999–10011, 2012 [DOI] [PMC free article] [PubMed] [Google Scholar]
- Samuelsen CL, Gardner MP, Fontanini A. Effects of cue-triggered expectation on cortical processing of taste. Neuron 74: 410–422, 2012 [DOI] [PMC free article] [PubMed] [Google Scholar]
- Savant L, McDaniel MR. Suppression of sourness: a comparative study involving mixtures of organic acids and sugars. Percept Psychophys 66: 642–650, 2004 [DOI] [PubMed] [Google Scholar]
- Sigala R, Logothetis NK, Rainer G. Own-species bias in the representations of monkey and human face categories in the primate temporal lobe. J Neurophysiol 105: 2740–2752, 2011 [DOI] [PubMed] [Google Scholar]
- Smith JC. The history of the “Davis Rig”. Appetite 36: 93–98, 2001 [DOI] [PubMed] [Google Scholar]
- Stapleton J, Lavine M, Wolpert R, Nicolelis M, Simon S. Rapid taste responses in the gustatory cortex during licking. J Neurosci 26: 4126–4138, 2006 [DOI] [PMC free article] [PubMed] [Google Scholar]
- Travers JB, Norgren R. Electromyographic analysis of the ingestion and rejection of sapid stimuli in the rat. Behav Neurosci 100: 544–555, 1986 [DOI] [PubMed] [Google Scholar]
- Verhagen JV, Engelen L. The neurocognitive bases of human multimodal food perception: sensory integration. Neurosci Biobehav Rev 30: 613–650, 2006 [DOI] [PubMed] [Google Scholar]
- Vogt MB, Smith DV. Responses of single hamster parabrachial neurons to binary taste mixtures of citric acid with sucrose or NaCl. J Neurophysiol 70: 1350–1364, 1993a [DOI] [PubMed] [Google Scholar]
- Vogt MB, Smith DV. Responses of single hamster parabrachial neurons to binary taste mixtures: mutual suppression between sucrose and QHCl. J Neurophysiol 69: 658–668, 1993b [DOI] [PubMed] [Google Scholar]
- Wang L, Bradley RM. Influence of GABA on neurons of the gustatory zone of the rat nucleus of the solitary tract. Brain Res 616: 144–153, 1993 [DOI] [PubMed] [Google Scholar]
- Wyttenbach RA, May ML, Hoy RR. Categorical perception of sound frequency by crickets. Science 273: 1542–1544, 1996 [DOI] [PubMed] [Google Scholar]
- Yoshida T, Katz D. Control of prestimulus activity related to improved sensory coding within a discrimination task. J Neurosci 31: 4101–4112, 2011 [DOI] [PMC free article] [PubMed] [Google Scholar]