

Abstract
Objective
Data-mining algorithms that can produce accurate signals of potentially novel adverse drug reactions (ADRs) are a central component of pharmacovigilance. We propose a signal-detection strategy that combines the adverse event reporting system (AERS) of the Food and Drug Administration and electronic health records (EHRs) by requiring signaling in both sources. We claim that this approach leads to improved accuracy of signal detection when the goal is to produce a highly selective ranked set of candidate ADRs.
Materials and methods
Our investigation was based on over 4 million AERS reports and information extracted from 1.2 million EHR narratives. Well-established methodologies were used to generate signals from each source. The study focused on ADRs related to three high-profile serious adverse reactions. A reference standard of over 600 established and plausible ADRs was created and used to evaluate the proposed approach against a comparator.
Results
The combined signaling system achieved a statistically significant large improvement over AERS (baseline) in the precision of top ranked signals. The average improvement ranged from 31% to almost threefold for different evaluation categories. Using this system, we identified a new association between the agent, rasburicase, and the adverse event, acute pancreatitis, which was supported by clinical review.
Conclusions
The results provide promising initial evidence that combining AERS with EHRs via the framework of replicated signaling can improve the accuracy of signal detection for certain operating scenarios. The use of additional EHR data is required to further evaluate the capacity and limits of this system and to extend the generalizability of these results.
Keywords: Pharmacovigilance, Adverse Drug Reactions, Integration, Electronic Health Records
Introduction
During the post-marketing period when drugs are used on larger populations and for more varied periods of time, unanticipated adverse drug reactions (ADRs) may occur, which alter the risk–benefit ratio enough to require regulatory action. Post-marketing ADRs have been shown to incur a significant burden for healthcare and result in unnecessary, often fatal, harm to patients.1–3 Therefore the discovery of ADRs in the post-marketing period is an urgent goal of the health system.
Computational methods commonly referred to as ‘signal-detection’ or ‘screening’ algorithms, which allow drug safety evaluators to peruse large volumes of data to identify risk signals of potential ADRs, have proven to be a critical component in pharmacovigilance. The Food and Drug Administration (FDA) routinely uses a signal-detection engine to compute signal scores (statistical reporting associations) for all of the millions of drug–event combinations in its adverse event reporting system (AERS).4–6 Notwithstanding, these signals by themselves do not establish a causal ADR relationship, but are rather considered initial warnings that require further assessment by domain experts to establish causality. This further evaluation typically consists of an intricate process whereby drug safety evaluators look for supporting information such as temporal relationships, published case reports, biological and clinical plausibility, clinical trials data, and epidemiological studies in several large healthcare databases.7 8
Dedicating resources to the further evaluation of each of the multitude of signals typically generated by signal-detection algorithms is not possible, and resources diverted to futile leads may render pharmacovigilance systems impractical.9 Therefore automated strategies to reduce the amount of false alerts and to prioritize signals so as to allow only the most promising candidates to be evaluated are imperative. In the absence of prior knowledge, and in the ‘hypothesis-free’ mode of operation, the standard strategy to prioritize ADR signals is to rank them according to their corresponding signal scores (statistical association strength), whereupon a subset of signals from the top of the ranked list are selected for further evaluation.10
In the spirit of the work by Vilar et al11 and Shetty and Dalal,12 whereby information from an external data source (chemical and literature, respectively) is proposed to prioritize, enrich, and enhance the accuracy of signal detection in AERS, we propose and evaluate a signal-detection strategy that uses external information (signals) from electronic health records (EHRs) to meet the same objective. Specifically, given an initial set of signals generated from AERS with the goal of selecting a subset of the K most promising signals for further evaluation, we claim that: selecting the top K ranked signals from the intersection of signals in AERS and EHRs is more predictive of true signals than selecting the top K ranked signals from AERS in itself (the standard approach). This type of comparison is analogous to the evaluation of the top results generated by two competing web search engines (eg, the relevance of links returned in the first page or two). We emphasize that the objective here is to obtain more true signals that are ranked higher. Our work is motivated by the common belief that signals replicated in multiple data sources or in independent studies represent increased confidence in the findings, and thus are more likely to be true. Figure 1 provides a pictorial illustration of the claim evaluated and the strategy being proposed.
Figure 1.

A comparison of two signal-detection strategies: the proposed system, AERS∩HER, which includes signals common to both AERS and EHRs, and its comparator, AERS. The claim being made is that the top set of K ranked signals retrieved from the AERS∩EHR system contain more true positives (true ADRs) than the set of top K signals retrieved from AERS when used by itself (currently the standard approach in signal detection). During evaluation, the two sets of K signals will be compared with respect to a gold standard. The pattern of circle overlaps displayed reflects typical outcomes, where, for most values of K, the signals produced by AERS∩EHR will be richer with true ADRs. ADR, adverse drug reaction; AERS, adverse event reporting system; EHR, electronic health record.
Background
The current mainstay in post-marketing drug safety surveillance is spontaneous reporting systems (SRSs) such as the FDA's AERS, which is a database of over 4 million reports of suspected ADRs submitted to the FDA by healthcare professionals, consumers, and pharmaceutical companies. The AERS reports are reviewed by FDA drug safety evaluators and analyzed using quantitative signal-detection algorithms to identify signals of potentially new ADRs that warrant further investigation.10 13 AERS communicates genuine health concerns, covers large populations, and is accessible for analysis. Since its inception, AERS has supported regulatory decisions for ∼6000 marketed drugs.14 Notwithstanding, AERS suffers from a set of limitations that may hinder its effective use15 16: notably, under-reporting, where only ∼10% of serious ADRs are reported,17 and over-reporting, where drugs with known, and publicized, ADRs are more likely to be reported than other drugs. Other limiting factors include misattributed drug–event combinations, missing and incomplete data, duplicated reporting, unspecified causal links, and lack of exposure information.15 16
Recent drug safety events, such as the Vioxx case causing an estimated 88 000 episodes of myocardial infarction,18 have highlighted the need to identify new data sources and improved analytic methods to create a more effective pharmacovigilance system.7 19–21 Some of these new developments rely on the expanded secondary use of electronic healthcare data such as EHRs and administrative claims. Unlike spontaneous reports, electronic healthcare data represent routine clinical care recorded over long periods of time. As such, they contain a more complete record of the patient's medical history, treatments, conditions, and potential risk factors. They are also not restricted to patients who experience ADRs. Consequently, they offer several advantages that may be used to complement SRS-based surveillance, from the perspective of both unbiased reporting and signal strengthening or confirmation. Importantly, they also offer the potential for active surveillance,20 22 and several retrospective studies have already demonstrated that the Vioxx case could have been identified earlier using this type of data.23–26 That said, research into the use of electronic healthcare data in drug safety is in its early stages and has not yet been integrated into routine pharmacovigilance.7 20 22 To date, electronic healthcare data have been used in pharmacovigilance predominantly to confirm signals originating from SRSs on an ad hoc basis.27 28
Traditionally, ADR signal-detection methodologies have focused on data from a single source. An emerging belief in pharmacovigilance research is that combining information across data sources can lead to more effective and accurate ADR discovery. Depending on the data sources used, the manner in which they are combined, and the scientific function they are designed to perform, it is generally believed that the resulting system would either lead to increased evidence or statistical power of findings, or would facilitate new discoveries not possible with either source separately. In recent studies, Cami et al29 combined information about known ADRs with chemical and ontological information to create a predictive system of novel ADRs. Matthews et al30 combined AERS and literature findings to build quantitative structure–activity relationship (QSAR) models for several serious ADRs. Vilar et al11 proposed an approach to prioritize/enrich ADR signals generated from AERS based on chemical similarity, whereas Shetty and Dalal12 proposed an approach to achieve the same objective by relating AERS signals to ADR signals generated by mining the literature.
To our knowledge, the study presented herein is the first that aimed to leverage EHRs and explicitly combine them with spontaneous reports to facilitate uninformed, hypothesis-free signal detection. Our study was based on over 4 million AERS reports and 1.2 million EHR narratives processed using natural language processing (NLP) and linked with structured EHR data. Well-established ADR signal-detection methodologies were used to generate hundreds of signals from each data source, related to three serious adverse reactions: rhabdomyolysis, acute pancreatitis, and QT prolongation. A reference standard consisting of over 600 well-established and plausible ADRs was created to evaluate the proposed approach against a comparator. Figure 2 provides an outline of the process.
Figure 2.

Processing pipeline for generating and evaluating signals produced by adverse event reporting system (AERS), electronic health records (EHRs), and the combined system. Disproportionality analysis refers to a class of methods used to generate adverse drug reaction signals. Unstructured EHR data in this context refers to EHR narratives, which are processed using the natural language processing system MedLEE. Structured EHR data in this context refers to laboratory test results, which are linked to each narrative.
Materials and methods
AERS
The full set of AERS reports was made available by Oracle's Health Sciences division, a supplier of database and statistical software for ADR analysis. The data were preprocessed to remove duplicate reports and correct terminological errors, and consisted of over 4 million reports submitted to the FDA in the years 1968–2010Q3.
EHRs
Both unstructured EHR data—clinical narratives processed using NLP and structured data - laboratory tests from New York Presbyterian Hospital (NYPH), were used after institutional review board approval. The clinical narratives—corresponding to discharge summaries, admission notes, and outpatient office visits—were processed using the NLP system, MedLEE,31 to extract medications, diseases, and signs and symptoms, and were mapped to UMLS (2011AA) concept unique identifiers (CUIs). Temporal information corresponding to admission, discharge, and visit dates was also extracted. Laboratory test data directly available in structured form and based on internal NYPH codes were linked to each of the narratives, and, together with the data dimensions extracted from the narratives, formed the set of clinical variables used for signal detection. The full dataset available for analysis consisted of 7 years (2004–2010) of data, ∼1.2 million narratives, and 178 000 patients.
Events investigated
We concentrated on signals corresponding to the adverse reactions, rhabdomyolysis, acute pancreatitis, and QT prolongation, which are part of a set of serious adverse reactions determined to be important and currently under active surveillance.26 32–34 In the AERS portion of the study, the adverse events studied (and report populations) were identified on the basis of MedDRA (V.13.1) terms at the ‘preferred term’ level.35 In the EHR portion of the investigation, outcomes (and patient cohorts) for the events rhabdomyolysis and acute pancreatitis were identified using diagnostic standards based on laboratory test values.36 37 QT prolongation outcomes were identified on the basis of terms appearing in the EHR narratives, and mapped to any of a predetermined set of UMLS CUIs related to QT prolongation (descendants of these CUIs were not considered). Table 1 specifies the exact event/outcome definitions used.
Table 1.
AERS and EHR—event and outcome definitions
| Event | AERS MedDRA PT event definitions |
EHR Outcome definitions |
|---|---|---|
| Pancreatitis | Pancreatitis acute | Lab tests: amylase >300 U/l or lipase >120 U/l |
| Rhabdomyolysis | Rhabdomyolysis, blood creatine phosphokinase MM increased | Lab test: 5× normal levels of creatine kinase |
| QT | Long QT syndrome, ECG QT prolonged, Torsade de pointes, ECG QT interval abnormal, ventricular tachycardia | UMLS codes: C0023976, C0151878, C0743431, C0855333, C1560305 |
AERS, adverse event reporting system; EHR, electronic health record; PT, preferred term.
Drug names
To reduce naming variability and facilitate comparability, drug names were standardized according to their generic names at the ‘main ingredient’ level of specificity. In the EHR case, trade names were resolved using the ‘tradename_of’ relation defined in RxNorm. The main ingredient was resolved on the basis of a manually created ‘main component/ingredient’ table. In the AERS case, the required naming format was made available by Oracle as part of the data.
Signal generation
A family of methods commonly referred to as disproportionality analysis (DPA)10 38 are currently the most widely used approach for automated ADR signal detection in pharmacovigilance.5 6 10 13 39 DPA is based on frequency analysis of 2×2 contingency tables to estimate surrogate measures of statistical association between specific drug–event (outcome) combinations.15 DPA methodologies differ by the exact measures that are used and the statistical adjustments they may apply to account for low counts. They are all based on the entries of online supplementary table S1 to derive association/disproportionality measures, which is computed for each drug–event pair under consideration.
Conforming to standard practice in AERS-based analysis,5 40 we used the MGPS41 DPA algorithm (via Oracle's Empirica Signal V.7.342) to generate ADR signals in the AERS portion of this study. MGPS is based on a Bayesian framework which accounts for the uncertainty in a disproportionality measure associated with small counts by ‘shrinking’ the measure towards the baseline case of no association, through an amount that is proportional to the variability of the disproportionality statistic. In MGPS, a statistical association is quantified by a measure called EBGM (empirical Bayes geometric mean), corresponding to a Bayesian version of the relative reporting ratio (RR)10 measure (see online supplementary table S1). Typically, the EB05 measure, which corresponds to the lower 5th percentile of the posterior RR distribution, is used instead for extra conservatism. To qualify a signal, EBGM or EB05 must be larger than a prespecified cut-off.
Prior to the application of DPA to the EHR data, we excluded all drug–outcome pairs mentioned in the EHRs for which the outcome under study was recorded prior to drug administration and pairs where the drug is a known indication for the outcome (filtering step in figure 2). This was done to remove drug–outcome pairs that cannot be causally related as ADRs. Although theoretically possible, the application of MGPS to the EHR data was not feasible, as it would have entailed identifying and analyzing a substantially larger amount of adverse events to calibrate MGPS’ model (shrinkage) parameters. Identification and definition of adverse events based on EHR data is not as simple as with AERS (events are directly specified).43 Consequently, for the EHR portion of this work, we adopted a different DPA approach based on computing OR scores (see supplementary online table S1). To qualify signals in this framework, an association had to meet two criteria: (1) OR equal to or greater than the prespecified cut-off; (2) using a one-sided Fisher exact test with a Bonferroni correction, the null hypothesis of no association had to be rejected at the 5% significance level. The Bonferroni correction was used to reduce the probability of identifying significant associations by chance while performing tests for multiple associations based on the same data.
Reference standard
A well-accepted database of all currently known ADRs does not exist at this time. As a result, we compiled a ‘reference standard’ of drugs associated with each of the targeted ADRs. The reference standard was manually curated by a pharmacological expert and reviewed by three physicians. It was divided into two classes, with the following inclusion criteria:
Established—drugs confirmed to be causally related to the ADR.
Criteria: drug label warning, a Micromedex44 listing (a trusted medical ADR reference), literature reviews of well-established ADRs, and other published reports having conclusive evidence such as laboratory data, clinical data, or a rechallenge/dechallenge study.
Plausible—drugs that have a high likelihood of being causative.
Criteria: analysis of one or more case reports mentioning the drug as a potential cause for a certain adverse event.
Although not confirmed, the second class represents potentially emerging or novel ADRs, which is the more interesting class for real-world pharmacovigilance.13 Online supplementary table S2 provides a representative sample of drugs and totals included in the reference standard.
Evaluation
Given that association scores have been computed for all drug–event pairs under study for both AERS and EHR data, the proposed system was evaluated using performance metrics based on ‘precision at K’, which is commonly used in the area of information retrieval for systems that return ranked sequences of results, with preference given to relevant results that are ranked higher.45 46
An initial set of signals for analysis was created from AERS and the EHRs using EB05 and OR cut-offs, respectively. The requirement that the evaluation starts with an initial set of meaningful signals is essential. Low associations scores are typically meaningless and discarded in signal detection. Associations whose score is <1 capture negative correlations (potentially beneficial drug effects) and thus should also be discarded in ADR analysis.
The initial set of AERS signals was intersected with the initial set of EHR signals to create the set of combined signals ‘AERS∩EHR’.
The AERS and AERS∩EHR signals were ranked according to the EB05 and OR association scores, respectively. Ranking AERS∩EHR according to OR (and not EB05) was required because the OR score implicitly determines the intersection size of AERS∩EHR and subsequently the amount of signals K evaluated at each comparison point.
For a given value of K, the top K ranked signals from AERS and AERS∩EHR were selected. K was varied within a certain range to create multiple comparison points, and bounded by the number of intersected signals computed in step 2.
On the basis of the reference standard, the number of true positives (TPs) detected among the K signals selected in step 4 was determined for AERS and AERS∩EHR separately.
This five-step evaluation process was repeated for each of the three events investigated, and aggregated statistics were computed to produce ‘total system’ performance metrics. Precision at K, denoted ‘prec(K)’, is defined as the precision (proportion of TPs) of the top K signals. A metric that combines both precision and recall for ranked sets of results is the ‘average precision’, defined as:
 |
where R is the total number of known true cases (signals).46 It is easy to see that when precA(K)>precB(K) for all values of K, then algorithm A is unambiguously superior to algorithm B. In a recent study, Zorych et al38 used similar metrics to evaluate several ADR signal-detection algorithms.
Results
Quantitative results
Figure 3 displays a comparison of the two systems based on the prec(K) statistic, which is varied along a range of different K values. The reference standard underlying this comparison consisted of the union of the established and plausible classes of ADRs. The figure clearly demonstrates that the combined AERS∩EHR system outperforms the AERS system for all values of K examined, and often by a large margin. The error bars attached to every point reflect 95% CIs for precision, and demonstrate by not overlapping each other across systems that the differences in favor of the combined system are statistically significant (0.05 or less level) at each comparison point K.
Figure 3.
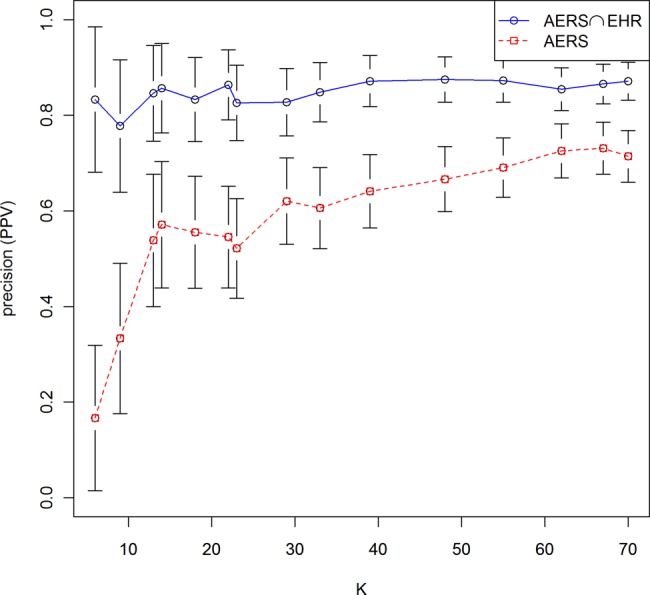
Performance comparison based on the precision at K statistic for different values of K (amount of signals selected). Error bars reflect 95% CIs for precision at each point evaluated. Non-overlapping CIs across the two systems are an indicator of statistically significant (0.05 level or less) performance differences across the two systems. The underlying reference standard consisted of the union of the established and plausible classes of adverse drug reactions. PPV, positive predictive value.
Table 2 provides a comparison of averaged performance statistics based on precision at K, recall at K, and the F-measure (harmonic mean of the two), as well as the averaged relative performance improvement for each of the reference standard classes. The table demonstrates that the combined system outperforms AERS across all categories evaluated. The relative improvement gained over AERS ranged from 31% to almost threefold for the class of plausible ADRs. Online supplementary figure S1 provides an illustration of the output (signals) produced by the AERS and AERS∩EHR systems for one of the studied ADRs.
Table 2.
Averaged performance statistics comparison of the AERS and AERS∩EHR systems across reference standard classes
| Precision at K | Recall at K | F-measure | |||||
|---|---|---|---|---|---|---|---|
| Reference standard class | AERS∩EHR (%) | AERS (%) | AERS∩EHR (%) | AERS (%) | AERS∩EHR (%) | AERS (%) | Relative improvement (%) |
| Established + plausible | 85 | 57 | 20 | 15 | 30 | 22 | 70 |
| Established | 58 | 50 | 24 | 23 | 31 | 29 | 31 |
| Plausible | 27 | 7 | 15 | 5 | 17 | 8 | 267 |
The performance statistics were averaged across the full range of K (signals selected) using the arithmetic average. The relative improvement is defined as the performance difference between the AERS∩EHR and AERS systems divided by the AERS performance for each performance statistic, and was averaged in the same manner as the other performance statistics.
AERS, adverse event reporting system; EHR, electronic health record.
The cut-off values used to produce the initial sets of signals (step 1) were set to EB05≥2 and OR≥1. EB05≥2 is a cut-off value that has been recommended by the FDA and other researchers based on several studies.5 47 In the absence of supporting empirical data as in the AERS case, we used OR≥1 (the smallest possible OR value) to create our initial set of EHR signals. These two cut-offs resulted in initial sets of 250 AERS signals and 70 AERS∩EHR signals. Online supplementary figures S2 and S3 and tables S3 and S4 provide result summaries pertaining to repeated evaluations based on two additional AERS initial cut-offs EB05≥1.5 and EB05≥2.5. These resulted in similar performance patterns and equivalent conclusions.
Qualitative results
Based on a set of configuration parameters, the combined system highlighted an association between rasburicase and elevated pancreatic enzymes. Rasburicase is a relatively new substance (approved in 2002), which is used to manage uric acid levels in adults and children receiving cancer treatment for leukemia, lymphoma, and certain tumors. A causal association between rasburicase and pancreatitis is currently unknown. Consequently, the association was flagged as a false positive according to our reference standard.
A single case report has recently been published reporting on complications associated with the administration of rasburicase, in which the authors mentioned an episode of pancreatitis as one of the side effects.48 AERS included three reports in which rasburicase was listed as either the primary or secondary suspect for the adverse event, acute pancreatitis. Owing to the small number of AERS reports, this association would likely be overlooked by drug safety evaluators (typically a minimum number of reports are necessary to warrant further investigation by the FDA), underscoring one of the main motivations to augment AERS with EHRs. The corresponding EHR cases were clinically reviewed by two experts from the Department of Pediatric Oncology at NYPH to rule out alternate explanations and confounding factors. Three patients were identified whose records indicated a potential association between rasburicase and elevated pancreatic enzymes. In one particular case, rasburicase was re-administered on several occasions, and further elevation in the levels of amylase and lipase were observed. The nature of evidence found (signals in two data sources, published case report, expert evaluation, and a rechallenge) is suggestive of a potentially new ADR. A detailed case series discussing this finding is in preparation.
Discussion
A widely acknowledged belief, albeit currently not validated, is that ADR signals replicated in multiple data sources or in independent studies are more likely to be true. In this article, we transformed this belief into a formal system and presented its preliminary evaluation. To our knowledge, this is the first study that aimed to do so, as well as leverage EHRs and explicitly combine them with spontaneous reports to facilitate uninformed, hypothesis-free signal detection. Our results provide promising initial evidence that combining AERS with EHR information by requiring signaling in both sources leads to improved accuracy of signal detection under certain operating scenarios. This approach, however, is not meant to replace, but rather augment, the portfolio of existing approaches. The practical utility of this system has demonstrated value by signaling the as yet unrecognized rasburicase–pancreatitis association. Implementing such a system is not complicated from a technical standpoint, assuming the stakeholders have access to sufficiently large EHR data (AERS is publically available) and have preprocessed the data accordingly (the most laborious step).
Data and methods
The study was based on a specific set of signal-detection methodologies, a specific set of adverse events, and a reference standard that may be subject to change. It is expected that the use of different screening methodologies and a modified reference standard may lead to different results. The use of the full set of preprocessed AERS reports and an undisputed methodology (MGPS) minimizes concerns about the AERS portion of the study. Despite the use of a standard and generally well-accepted methodology to screen the EHR data for signals, it is possible that other methodologies, such as those based on epidemiological study designs, would have improved the results. The latter, however, do not scale as well and require many design choices to be made, for which there are no established standards.49 The use of EHR narratives rather than structured EHR data based on billing codes (ICD9) was founded on the common assumption that the information contained in narratives is richer and more granular than billing codes, and also is not as biased towards reimbursement as billing codes are. This in turn may improve the recall of patients experiencing certain outcomes, better analysis of confounding, and therefore more accurate ADR discovery.
Evaluation
Our study focused on the ‘precision at K’ performance measure, which is commonly used to evaluate systems that return ranked sequences of results. Granted, the AERS in itself would have larger recall if we were to consider all the signals it generates and not only the top ranked ones. But this was not our claim, nor is it the manner in which signals are typically examined (because of resource constraints imposed by having to further evaluate many signals). The analysis of EHRs as an independent system was beyond the scope of this article. That said, the predictive capacity of observational data for the application of drug safety is an open question, with the Observational Medical Outcomes Partnership (OMOP)50 leading the efforts to address this question.22
Significance
The findings suggest that the combined system is more effective (larger performance margin over AERS) for scenarios that call for highly selective signaling (K<30, figure 3). Similarly, table 2 suggests that the combined system is more effective for the class of plausible (emerging or as yet unconfirmed) ADRs, which is the class that would be targeted in realistic use of such a system. The relatively smaller improvement on the class of established ADRs is to be expected because of the strong correlation between AERS reporting and well-known ADRs listed on labels or reported in the literature (one feeds the other often in a circular relationship). It should be emphasized that drugs that were not verified by our reference standard, and were counted as false positives for the purpose of our evaluation, could in fact be legitimate and novel ADRs that are currently unknown. These supposedly false positive agents, similar to the agents that were verified as plausible ADRs, supply the more interesting candidates for discovery and merit a further manual review, as evidenced by our findings of the rasburicase–pancreatitis association.
Limitations
The main limiting factor of our study was lack of additional EHRs. Although a large enough EHR sample was used, the inclusion of additional EHR data, preferably from multiple sites, is required to further evaluate the predictive capacity, gains, limits, and generalizability of our results (including other events). In future work, we plan to extend this study using data corresponding to over a million patients from the Stanford Clinical Data Warehouse (STRIDE).
Conclusions
We proposed and evaluated an approach to support signal detection, which is based on combining EHRs with AERS by requiring signaling in both sources. To our knowledge, this is the first study that aimed to leverage EHRs and explicitly combine them with spontaneous reports in a systematic manner for drug safety purposes. Our findings provide initial promising evidence that replicated signaling in AERS and EHRs can enhance signal detection under certain operating scenarios and objectives. Such a system is not intended to replace, but rather augment, the portfolio of existing approaches. Its practical value has been demonstrated by the discovery of a promising new ADR candidate. Additional EHR data would be required to further evaluate the predictive capacity and limits of this system.
Acknowledgments
This research was supported in part by grants 1R01LM010016, 3R01LM010016-01S1, 3R01LM010016-02S1, and 5T15-LM007079-19(HS) from the National Library of Medicine. We thank Lyudmila Ena for assistance in extracting and preprocessing the EHR data, and Paea LePendu and Anna Bauer-Mehren from Stanford Center for Biomedical Informatics Research for valuable comments, and extend our gratitude to Oracle's Health Sciences Division for supplying us with the AERS data and analysis software.
Footnotes
Funding: National Library of Medicine.
Competing interests: None.
Patient consent: Obtained.
Provenance and peer review: Not commissioned; externally peer reviewed.
References
- 1.Schneeweiss S, Hasford J, Gottler M, et al. Admissions caused by adverse drug events to internal medicine and emergency departments in hospitals: a longitudinal population-based study. Eur J Clin Pharmacol 2002;58:285–91 [DOI] [PubMed] [Google Scholar]
- 2.Classen DC, Pestotnik SL, Evans RS, et al. Adverse drug events in hospitalized patients. Excess length of stay, extra costs, and attributable mortality. JAMA 1997;277:301–6 [PubMed] [Google Scholar]
- 3.Bates DW, Spell N, Cullen DJ, et al. The costs of adverse drug events in hospitalized patients. Adverse Drug Events Prevention Study Group. JAMA 1997;277:307–11 [PubMed] [Google Scholar]
- 4.Adverse Event Reporting System http://www.fda.gov/cder/aers/default.htm (accessed Jul 2007).
- 5.Szarfman A, Machado SG, O'Neill RT. Use of screening algorithms and computer systems to efficiently signal higher-than-expected combinations of drugs and events in the US FDA's spontaneous reports database. Drug Saf 2002;25:381–92 [DOI] [PubMed] [Google Scholar]
- 6.Almenoff JS, Pattishall EN, Gibbs TG, et al. Novel statistical tools for monitoring the safety of marketed drugs. Clin Pharmacol Ther 2007;82:157–66 [DOI] [PubMed] [Google Scholar]
- 7.Platt R, Wilson M, Chan KA, et al. The new sentinel network—improving the evidence of medical-product safety. N Engl J Med 2009;361:645–7 [DOI] [PubMed] [Google Scholar]
- 8.Schneeweiss S. A basic study design for expedited safety signal evaluation based on electronic healthcare data. Pharmacoepidemiol Drug Safety 2010;19:858–68 [DOI] [PMC free article] [PubMed] [Google Scholar]
- 9.Hauben M, Bate A. Data mining in drug safety: side effects of drugs essay. In: Aronson JK, ed. Side effects of drugs annual. 2007, Vol. 29:xxxiii–xlvi [Google Scholar]
- 10.Hauben M, Madigan D, Gerrits CM, et al. The role of data mining in pharmacovigilance. Expert Opin Drug Saf 2005;4:929–48 [DOI] [PubMed] [Google Scholar]
- 11.Vilar S, Harpaz R, Chase HS, et al. Facilitating adverse drug event detection in pharmacovigilance databases using molecular structure similarity: application to rhabdomyolysis. J Am Med Inform Assoc 2011;18:i73–80 [DOI] [PMC free article] [PubMed] [Google Scholar]
- 12.Shetty KD, Dalal SR. Using information mining of the medical literature to improve drug safety. J Am Med Inform Assoc 2011;18:668–74 [DOI] [PMC free article] [PubMed] [Google Scholar]
- 13.Hauben M, Bate A. Decision support methods for the detection of adverse events in post-marketing data. Drug Discov Today 2009;14:343–57 [DOI] [PubMed] [Google Scholar]
- 14.Wysowski DK, Swartz L. Adverse drug event surveillance and drug withdrawals in the United States, 1969–2002—The importance of reporting suspected reactions. Arch Intern Med 2005;165:1363–9 [DOI] [PubMed] [Google Scholar]
- 15.Bate A, Evans SJ. Quantitative signal detection using spontaneous ADR reporting. Pharmacoepidemiol Drug Saf 2009;18:427–36 [DOI] [PubMed] [Google Scholar]
- 16.Stephenson W, Hauben M. Data mining for signals in spontaneous reporting databases: proceed with caution. Pharmacoepidemiol Drug Saf 2007;16:359–65 [DOI] [PubMed] [Google Scholar]
- 17.Wadman M. News feature: strong medicine. Nat Med 2005;11:465–6 [DOI] [PubMed] [Google Scholar]
- 18.Graham DJ, Campen D, Hui R, et al. Risk of acute myocardial infarction and sudden cardiac death in patients treated with cyclo-oxygenase 2 selective and non-selective non-steroidal anti-inflammatory drugs: nested case-control study. Lancet 2005;365:475–81 [DOI] [PubMed] [Google Scholar]
- 19.Avorn J, Schneeweiss S. Managing drug-risk information—what to do with all those new numbers. N Engl J Med 2009;361:647–9 [DOI] [PubMed] [Google Scholar]
- 20.Stang PE, Ryan PB, Racoosin JA, et al. Advancing the science for active surveillance: rationale and design for the observational medical outcomes partnership. Ann Intern Med 2010;153:600–W206 [DOI] [PubMed] [Google Scholar]
- 21.McClellan M. Drug safety reform at the FDA—pendulum swing or systematic improvement. N Engl J Med 2007;356:1700–2 [DOI] [PubMed] [Google Scholar]
- 22.Madigan D, Ryan P. What can we really learn from observational studies?: the need for empirical assessment of methodology for active drug safety surveillance and comparative effectiveness research. Epidemiology 2011;22:629–31 [DOI] [PubMed] [Google Scholar]
- 23.Simpson SE. Self-controlled methods for postmarketing drug safety surveillance in large-scale longitudinal data. Ph.D. dissertation, Columbia University, 2012;3(Suppl 1):S5 [Google Scholar]
- 24.LePendu P, Iyer SV, Fairon C, et al. Annotation analysis for testing drug safety signals using unstructured clinical notes. J Biomed Semantics 2012; 3(Suppl 1):S5 [DOI] [PMC free article] [PubMed] [Google Scholar]
- 25.Brownstein JS, Sordo M, Kohane IS, et al. The tell-tale heart: population-based surveillance reveals an association of rofecoxib and celecoxib with myocardial infarction. PLoS One 2007;2:e840. [DOI] [PMC free article] [PubMed] [Google Scholar]
- 26.Brown JS, Kulldorff M, Chan KA, et al. Early detection of adverse drug events within population-based health networks: application of sequential testing methods. Pharmacoepidemiol Drug Saf 2007;16:1275–84 [DOI] [PubMed] [Google Scholar]
- 27.Platt R, Carnahan RM, Brown JS, et al. The U.S. Food and Drug Administration's Mini-Sentinel program: status and direction. Pharmacoepidemiology and Drug Safety 2012;21:1–8 [DOI] [PubMed] [Google Scholar]
- 28.Tatonetti NP, Denny JC, Murphy SN, et al. Detecting drug interactions from adverse-event reports: interaction between paroxetine and pravastatin increases blood glucose levels. Clin Pharmacol Ther 2011;90:133–42 [DOI] [PMC free article] [PubMed] [Google Scholar]
- 29.Cami A, Arnold A, Manzi S, et al. Predicting adverse drug events using pharmacological network models. Sci Transl Med 2011;3:114ra127. [DOI] [PubMed] [Google Scholar]
- 30.Matthews EJ, Ursem CJ, Kruhlak NL, et al. Identification of structure-activity relationships for adverse effects of pharmaceuticals in humans: part B. Use of (Q)SAR systems for early detection of drug-induced hepatobiliary and urinary tract toxicities. Regul Toxicol Pharmacol 2009;54:23–42 [DOI] [PubMed] [Google Scholar]
- 31.Friedman C, Shagina L, Lussier Y, et al. Automated encoding of clinical documents based on natural language processing. J Am Med Inform Assoc 2004;11: 392–402 [DOI] [PMC free article] [PubMed] [Google Scholar]
- 32.Trifiro G, Pariente A, Coloma PM, et al. Data mining on electronic health record databases for signal detection in pharmacovigilance: which events to monitor? Pharmacoepidemiol Drug Saf 2009;18:1176–84 [DOI] [PubMed] [Google Scholar]
- 33.Ramirez E, Carcas AJ, Borobia AM, et al. A pharmacovigilance program from laboratory signals for the detection and reporting of serious adverse drug reactions in hospitalized patients. Clin Pharmacol Ther 2010;87:74–86 [DOI] [PubMed] [Google Scholar]
- 34.Olivier P, Montastruc JL. The nature of the scientific evidence leading to drug withdrawals for pharmacovigilance reasons in France. Pharmacoepidemiol Drug Saf 2006;15:808–12 [DOI] [PubMed] [Google Scholar]
- 35.Medical Dictionary for Regulatory Activities (MedDRA) http://www.meddramsso.com/ (accessed Jul 2012) [DOI] [PubMed]
- 36.Knochel JP. Rhabdomyolysis and Myoglobinuria. Ann Rev Med 1982;33:435–43 [DOI] [PubMed] [Google Scholar]
- 37.Munoz A, Katerndahl DA. Diagnosis and management of acute pancreatitis. Am Fam Physician 2000;62:164–74 [PubMed] [Google Scholar]
- 38.Zorych I, Madigan D, Ryan P, et al. Disproportionality methods for pharmacovigilance in longitudinal observational databases. Stat Methods Med Res 2011. doi:10.1177/0962280211403602 [DOI] [PubMed] [Google Scholar]
- 39.Lehman HP, Chen J, Gould AL, et al. An evaluation of computer-aided disproportionality analysis for post-marketing signal detection. Clin Pharmacol Ther 2007;82:173–80 [DOI] [PubMed] [Google Scholar]
- 40.Szarfman A. Safety Data Mining. FDA Advisory Committee Meeting Briefing Document 2006. http://www.fda.gov/ohrms/dockets/as/06/briefing/2006–4266b1–02-06-FDA-appendic-f.pdf (accessed Dec 2011).
- 41.DuMouchel W. Bayesian data mining in large frequency tables, with an application to the FDA Spontaneous Reporting System. Am Stat 1999;53:177–90 [Google Scholar]
- 42.http://www.oracle.com/us/industries/life-sciences/health-sciences-empirica-signal-364243.html (accessed Jul 2012).
- 43.Stang PE, Ryan PB, Dusetzina SB, et al. Health outcomes of interest in observational data: issues in identifying definitions in the literature. Health Outcomes Res Med 2012;3:e37–44 [Google Scholar]
- 44. Micromedex® Healthcare Series (Internet database). Greenwood Village, Colo: Thomson Reuters (Healthcare) Inc. Updated periodically. 2010.
- 45.Baeza-Yates R, Ribeiro-Neto B. Modern information retrieval. Addison Wesley, 1999 [Google Scholar]
- 46.Liu L, Ozsu MT. Encyclopedia of database systems. Springer, 2009 [Google Scholar]
- 47.Deshpande G, Gogolak V, Sheila WS. Data mining in drug safety: review of published threshold criteria for defining signals of disproportionate reporting. Pharm Med 2010;24:37–43 [Google Scholar]
- 48.Bauters T, Mondelaers V, Robays H, et al. Methemoglobinemia and hemolytic anemia after rasburicase administration in a child with leukemia. Int J Clin Pharm 2011;33:58–60 [DOI] [PubMed] [Google Scholar]
- 49.Ryan P. Review of Observational Analysis Methods. White Paper 2009. http://omop.fnih.org/sites/default/files/OMOP%20Methods%20points-to-consider%2012feb2009_post_0.pdf (accessed Jul 2012).
- 50.Observational Medical Outcomes Partnership (OMOP) http://omop.fnih.org/ (accessed Jul 2012).