Abstract
Adverse drug events cause substantial morbidity and mortality and are often discovered after a drug comes to market. We hypothesized that Internet users may provide early clues about adverse drug events via their online information-seeking. We conducted a large-scale study of Web search log data gathered during 2010. We pay particular attention to the specific drug pairing of paroxetine and pravastatin, whose interaction was reported to cause hyperglycemia after the time period of the online logs used in the analysis. We also examine sets of drug pairs known to be associated with hyperglycemia and those not associated with hyperglycemia. We find that anonymized signals on drug interactions can be mined from search logs. Compared to analyses of other sources such as electronic health records (EHR), logs are inexpensive to collect and mine. The results demonstrate that logs of the search activities of populations of computer users can contribute to drug safety surveillance.
Keywords: Pharmacovigilance, Search Log Analysis, Drug Interactions, Adverse Drug Events
Background
The US Food and Drug Administration and other organizations collect reports on drug side effects from physicians, pharmacists, patients, and drug companies.1–3 These reports provide valuable clues about drug-related adverse events, but are incomplete and biased.4–6 As a result, adverse event alerts for single drugs are often delayed as evidence accumulates.7 8 These challenges are compounded in the setting of adverse events resulting from multiple drugs that interact in unexpected ways.
Given that a significant use of the internet is for health searches, we hypothesized that internet users may provide early clues about adverse drug events via their online information-seeking activities.9 Previous research on tracking seasonal influenza has demonstrated that search logs can form an implicit sensor network for health monitoring.10 11 In that work, search logs accurately estimated the weekly levels of influenza activity in different regions of the USA, with a reporting delay of approximately 1 day. The authors showed that health-seeking activity captured in queries to online web search services mirrors trends in data gathered by traditional surveillance systems based on virological and clinical data.
We employed search log data for a different purpose: we sought to harness people's online health-seeking search activity in the aggregate to identify adverse drug events associated with drug interactions. Patients may seek information on the web about the drugs prescribed to them or to close family members, and to explore the potential explanations of new symptoms.12 We considered as a test case an interaction between paroxetine (an antidepressant) and pravastatin (a cholesterol-lowering drug), which was recently reported to create hyperglycemia.13 14 This association was extracted from the US Food and Drug Administration adverse event reporting system (AERS) using a data-mining algorithm that aggregates reports to identify drug–drug interactions.13 The finding was confirmed in a retrospective analysis of the electronic health records of three regionally distinct medical institutions and confirmed in a mouse model.14 We hypothesized that patients taking these two drugs might experience symptoms of hyperglycemia and may have conducted internet searches on these symptoms and concerns related to hyperglycemia before the association was reported in 2011.
Methods
We analyzed the search logs of millions of consenting web users who opted to share search activities with Microsoft via the installation of a browser add-on, spanning a 12-month period of all of 2010 and comprising searches on Google, Bing, and Yahoo!. An anonymous identifier tied to the instance of the browser add-on was used to track the drugs and symptom queries that each user performed over time (note that we were unable to distinguish between multiple users of the same machine). Searches for information on prescription drugs are common. We found that over one in 250 people (0.43%) pursued information on at least one of the top 100 best-selling drugs in the USA, including paroxetine and pravastatin, the medications that we focus on here.15
By examining words used in user queries, we sought evidence that searches from people exploring pravastatin and paroxetine over time (using logs from 2010) would have a higher rate of including hyperglycemia-associated words than people searching for only one of the drugs. The list of hyperglycemia-related terminology that was used is included in the supplementary materials (see supplementary table S1, available online only). We generated the list based on a review of medical literature. The list is broad to ensure that we covered a majority of related symptoms. Although there are many possible causes for the symptoms listed, each can be associated with hyperglycemia. We sought to detect increases in the use of terms from the list in exploratory web searches by holding the list constant and noting the presence or absence in user logs of queries for the medications that have been found to cause hyperglycemia when taken together.
We first mined the 12 months of search logs to identify users who had searched for hyperglycemia-related symptoms or terms. We then identified users in each of the following groups: (1) both (paroxetine and pravastatin) searchers, comprising those who searched on paroxetine (or one of its trade name variants: Aropax, Paxil, Seroxat, and Sereupin) and pravastatin (or its trade name Pravachol); (2) pravastatin, independent of paroxetine, searchers, comprising those users who searched for pravastatin regardless of whether they also searched for paroxetine; and (3) paroxetine, independent of pravastatin, searchers, comprising those users who searched for paroxetine irrespective of whether they also searched for pravastatin.
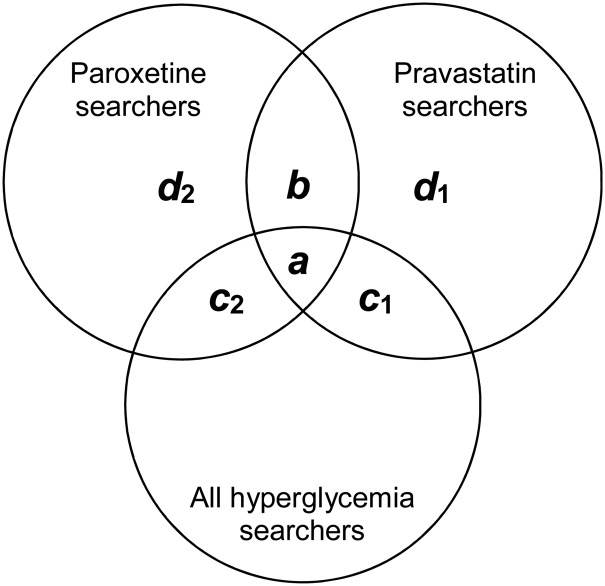
We counted the number of users in each of the three user groups, and the number of users in each group who searched for at least one of the terms associated with hyperglycemia (ie, the intersection with the set of hyperglycemia searchers). These populations can be visualized with a Venn diagram, as shown in figure 1. Letters denote different subsets of searchers, with a referring to those who searched on both paroxetine and pravastatin and also searched on hyperglycemia-related terminology, and b to those who searched on both drugs. Subsets d1 and d2 refer to those who searched on pravastatin and on paroxetine, respectively. Subset c1 denotes those who searched for pravastatin and hyperglycemia-related terms and c2 those who searched on paroxetine and hyperglycemia-related terms.
Figure 1.
Venn diagram showing the different user groups in our analysis (not drawn to scale).
We used disproportionality analysis6 to assess the increased chance of a user searching for hyperglycemia-related terms given that they searched for both pravastatin and paroxetine. Reporting ratios (RR) are computed based on observed versus expected adverse reports.16 Given the broad spectrum of information goals on the web, for the search logs, we used a conditional disproportionality analysis that introduces a contextual focus to minimize false positives. In this case, we sought evidence for increased searches for hyperglycemia-related terms within the specific context of searches on a drug or drugs of interest. In exploring the potential influence of the two drugs together, we considered people who have searched for each of the drugs individually over the same period as controls.
Given the subsets of users defined above, disproportionality analysis was used to identify drug pairs that occur at higher than expected frequencies with hyperglycemia-related terms. RR is defined as observed/expected or (a/b)/(c/d). Observed is defined as the fraction of users who searched for both pravastatin and paroxetine (b) who also queried for hyperglycemia symptoms (a), and expected is defined as the fraction of users who searched for pravastatin (d1) who also searched for hyperglycemia symptoms (c1), or (symmetrically) the fraction of users who searched for paroxetine (d2) who also searched for hyperglycemia symptoms (c2).
When RR is based on expected for pravastatin as background and search logs, a is the number of users in the paroxetine and pravastatin set who searched for hyperglycemia-related terminology; b is the number of users in the paroxetine and pravastatin set; c1 is the number of users in the pravastatin-only set who searched for hyperglycemia-related terminology, and d1 is the number of users in the pravastatin-only set. Figure 1 shows how each of these variables (a–d) relates to the three user groups defined earlier and their intersection with each other and all hyperglycemia searchers. We similarly computed RR with expected conditioned on paroxetine as background.
Results
User groups and prevalence
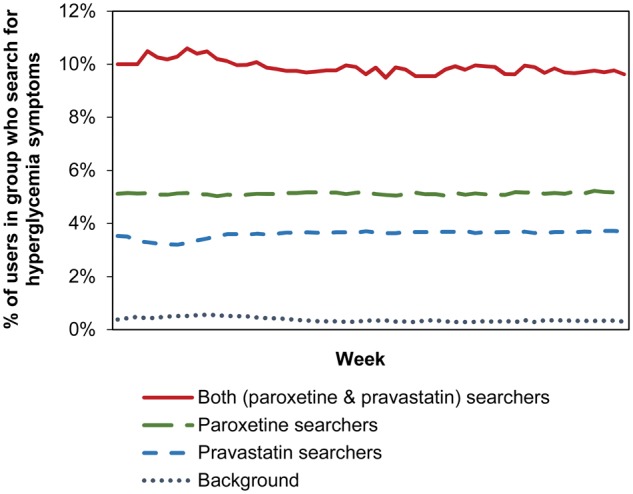
To perform the analysis described in the remainder of this article, we analyzed 82 million drug, symptom, and condition queries from 6 million web searchers. To ensure coverage, we looked for co-occurrences of the two medications for each user within the 12-month timeframe. For the group of users showing these co-occurrences, paroxetine and pravastatin did not co-occur within the same query; 29.61% of the observed drug pairs occurred in searches within the same day, 41.90% within the same week, and 60.89% within the same month. Figure 2 shows the fraction of users in each of the groups who queried for any of the hyperglycemia-related terms in supplementary table S1 (available online only). The value for background in the figure is the fraction of all users who queried for the hyperglycemia-linked terms independent of the presence of pravastatin and paroxetine in any of their queries. The figure shows that people who searched for both paroxetine and pravastatin over the 12-month period were more likely to perform searches on the terms associated with hyperglycemia (approximately 10% of users who searched for the drug pair) than those who searched on only one of the drugs (approximately 5% of paroxetine users, approximately 4% of pravastatin users). Approximately 0.3% of all users searched for one or more terms from the list (shown as background in the figure). The figure also shows that the difference between the groups is consistent over the 12-month period and that there are no temporal variations such as seasonal effects.
Figure 2.

Percentage of users in each of the three user groups searching for hyperglycemia-related terms. Percentage is computed per week over 12 months of search log data. Background refers to the fraction of all searchers who search for hyperglycemia-related symptoms or terminology independent of the presence of the drugs in the users’ search histories.
Disproportionality analysis
Table 1 shows the results of the conditional disproportionality analysis for RR computed using expected for pravastatin and expected for paroxetine.
Table 1.
Results of disproportionality analysis for expected (pravastatin), expected (paroxetine)
| a | b | c | d | RR | 95% CI (lower, upper) | p Value (one-tailed) | |
|---|---|---|---|---|---|---|---|
| Expected (pravastatin) | 342 | 2716 | 2581 | 56 302 | 2.747 | 2.438 to 3.094 | <0.0001 |
| Expected (paroxetine) | 342 | 2716 | 3645 | 71 243 | 2.461 | 2.189 to 2.767 | <0.0001 |
RR, reporting ratios.
The results in table 1 show that searching with terms that capture hyperglycemia symptomatology is observed more frequently in users searching for both drugs than in those searching for each drug separately. This result based on data from a non-clinical source resonates with findings from AERS and laboratory analysis described earlier.13 15 As we know the date that the discovery of the interaction was made public, we could examine previous log data with confidence that the logged activities were not influenced by information about known interactions published later. However, as this is only a single drug pair, it is possible that the results are explained by an un-modeled mechanism or by chance.
Disproportionality analysis for known drug–drug interactions
To address the concern associated with focusing on a single pair, we tested 31 other drug pairs that are known to interact and cause hyperglycemia (true positives, TP). Known drug–drug interactions were extracted (and manually validated) from textual monographs in DrugBank and the Medi-Span drug therapy monitoring system. These sources are highly technical in nature or require paid access, making it less likely that ordinary health consumers would visit them and have the information bias their searches. Note that this is a less strict criterion than the pravastatin–paroxetine interaction, in which we could guarantee that knowledge had not been available before the public release of the information. In order to compile a set of drug pairs that are not associated with hyperglycemia, we created a negative set of 31 other drug pairs (true negatives, TN) by associating drug pairs with a randomly chosen adverse event, and removing any drug–drug event pairings that are known to be associated based on external knowledge (DrugBank, Medi-Span, Drugs.com, UMLS or SIDER). We mapped the generic names for the drugs to their brand names, as we did with paroxetine and pravastatin, and searched for the presence of both drugs in the log data described above. We then performed the same type of log-based disproportionality analysis, including computing RR based on the expected counts from each drug in the pair.
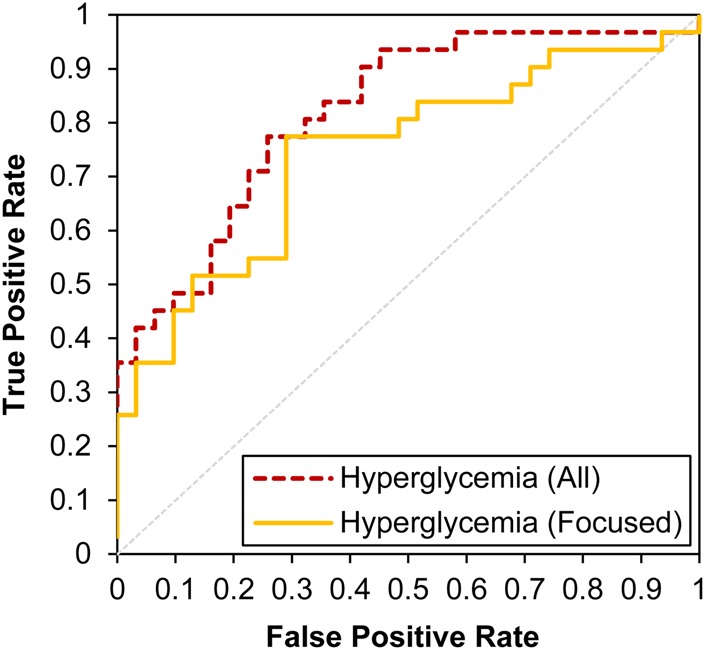
Supplementary table S2 (available online only) presents the results of this additional disproportionality analysis. The drug pairs are ranked in descending order by the average RR for the pair. We preserved the TP/TN label to show where in the list the TP appear. If the log-based method performed perfectly, then all TP would be ranked above all TN. The results show that the majority of the drug pairs identified as having a strong relationship with hyperglycemia are TP (ie, 74% of the top half of the table is TP; two proportion Z-test; Z=−2.086, p=0.019) and consequentially, the TN are least strongly related to hyperglycemia. In addition, if we assume that the pairings in which the average RR values greater than 2 predict a TP (an RR value of 2 has been shown to be a meaningful threshold in previous work),17 18 we estimated a false positive rate of 12.5% from the 62 pairings we examined. To study performance further across the range of threshold values, we constructed a receiver operating characteristic (ROC) curve, shown in figure 3. The area under the curve (AUCAll) is 0.8189, signifying strong performance in distinguishing TP from TN using the log data.
Figure 3.

Receiver operating characteristic curve for the identification of drug pairs known to be associated with hyperglycemia using search log data. Red (dashed) line denotes the performance when using all hyperglycemia-related terminology in our set. Yellow (solid) line denotes the performance of a more narrowly focused set of symptoms strongly connected to hyperglycemia.
As the behavioral data for a large population used in the analyses are noisy we sought in our first phase of study to be inclusive with the use of a broad term list. We probed the sensitivity of the results to reducing the set of terms to a more focused subset of terms restricted to synonyms of hyperglycemia and three primary hyperglycemic symptoms: polyphagia, polydipsia, and polyuria (and their related synonyms). The focused list appears in supplementary table S3 (available online only). The ROC curve for the more focused subset is shown in figure 3. The value of AUCFocused is 0.7429, showing good performance in distinguishing TP from TN (ie, 71% of the top half of the ranking is TP; two proportion Z-test; Z=−1.815, p=0.035). The performance with the focused subset of terms is lower than for the full set of hyperglycemia-related terminology, but not significantly so (Z=0.914, p=0.180).19
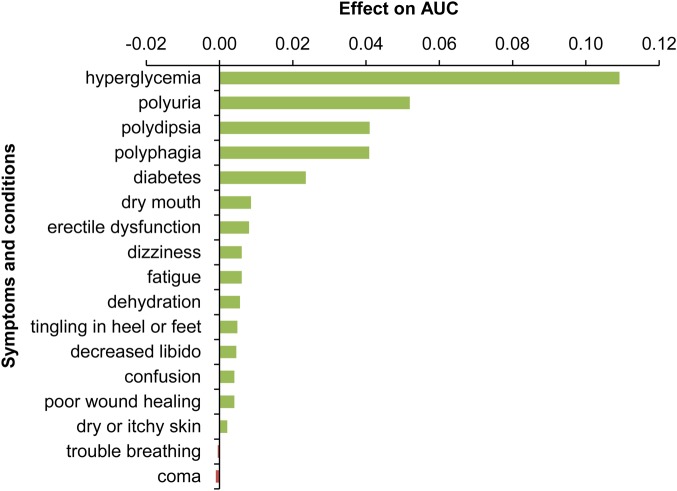
To understand which of the terms yielded the most benefit, we performed an ablation analysis of the symptoms/conditions. We iterated through sets of terms for each of the conditions/symptoms considered, starting with all terms, and successively removed sets of terms whose deletion led to the largest decrement in the area under the ROC curve. Figure 4 shows the list of symptoms and conditions and the influence on AUC of removing each of them with this greedy procedure.
Figure 4.
Influence of removing symptoms and conditions on the classification performance as measured by change in AUCAll. AUC, area under the curve.
Figure 4 shows that hyperglycemia (and its synonyms such as ‘high blood sugar’) has the largest effect on AUCAll, followed by each of the three core hyperglycemic symptoms in the order polyuria, polydipsia, and polyphagia. The AUC remains high even when direct references to hyperglycemia (first bar in figure 4) are removed (AUCAll−Hyperglycemia 0.7097), illustrating the value of employing the pooled related symptoms and conditions for this classification task. The most influential additional terms outside of the core hyperglycemic symptoms (diabetes, dry mouth, etc.) are also known to be related to hyperglycemia. The terms become less strongly related as we move down the list. Note that removing ‘trouble breathing’ and ‘coma’ improves performance, signaling that these terms may add noise to the classifier.
Discussion and conclusions
Overall, these findings demonstrate the potential value of the log analysis for identifying drug pairs linked to hyperglycemia and illustrate the generalizability of the method beyond just the pravastatin–paroxetine pairing. Given that the majority of the TP can be identified from logs of search activity also provides validation for the set of terms used to identify hyperglycemia-related searches (see supplementary table S1, available online only). Given the many pairs with little or no effect from the interaction also shows that the act of searching for multiple drugs is insufficient on its own to explain the heightened interest in hyperglycemia-related material.
The prolific use of web search to pursue information can be likened to a large-scale distributed network of sensors for identifying the potential side effects of drugs. There is a potential public health benefit in listening to such signals, and integrating them with other sources of information. We see a potentially valuable signal even though search logs are unstructured, not necessarily related to health, and can include any words entered by users. More in-depth analysis is needed to understand better the biases and sources of noise in web search logs. We particularly seek to understand potential non-pharmacological explanations for the trends observed in the log data. For example, confounding or hidden variables may play a role in boosting searches for terms associated with symptoms of hyperglycemia for the joint cohort. For example, demographic factors such as age and gender (not directly observable via log data) may contribute to the observed interactions. Psychological influences on health-seeking behavior may also play a role. For example, people prescribed paroxetine for anxiety may be more likely to focus on and enquire about their symptomatology online than others, and this anxiety may rise more than others with the growing list of prescribed medications. We note that the data do not support this potential explanation; figure 2 shows that there is less of an effect for those who search for paroxetine alone.
The pravastatin–paroxetine interaction was not known at the time the logs were gathered (in 2010). Therefore, the analysis we performed was similar to a prediction task. While further work is needed to explore the predictive value of signals from search logs, the methods and findings highlight the potential value of harnessing anonymized search logs captured by internet services as complements to other signals for pharmacovigilance.20 We believe that patient search behavior directly captures aspects of patients’ concerns about sensed symptomatology and can complement more traditional sources of data for pharmacovigilance, including AERS and electronic health record data. We anticipate more sophisticated log-based detection of adverse events associated with medications, and that these will contribute to the faster identification of drug safety information.
Footnotes
Contributors: All authors planned the study and drafted and revised the paper. RWW mined and analyzed the log data, and developed and evaluated the classifier. NPT, NHS, RBA and EH advised on analysis and modeling strategies. NHS provided data on known drug–drug interactions.
Competing interests: None.
Ethics approval: Ethics approval for this study was provided by the privacy policy officer at our institution (Microsoft) where the logs were analyzed.
Provenance and peer review: Not commissioned; externally peer reviewed.
References
- 1.Classen DC, Resar R, Griffin F, et al. ‘Global trigger tool’ shows that adverse events in hospitals may be ten times greater than previously measured. Health Aff 2011;30:581–9 [DOI] [PubMed] [Google Scholar]
- 2.Johnson JA, Bootman JL. Drug-related morbidity and mortality: a cost of illness model. Arch Intern Med 1995;155:1949–56 [PubMed] [Google Scholar]
- 3.Lazarou J, Pomeranz B, Corey PN. Incidence of adverse drug reactions in hospitalized patients: a meta-analysis of prospective studies. JAMA 1998;279:1200–5 [DOI] [PubMed] [Google Scholar]
- 4.Schneeweiss S, Avorn J. A review of uses of health care utilization databases for epidemiologic research on therapeutics. J Clin Epidemiol 2005;58:323–37 [DOI] [PubMed] [Google Scholar]
- 5.Bate A, Evans SJW. Quantitative signal detection using spontaneous ADR reporting. Pharmacoepidemiol Drug Saf 2009;18:427–36 [DOI] [PubMed] [Google Scholar]
- 6.Coloma PM, Trifiro G, Schuemie MJ, et al. Electronic healthcare databases for active drug safety surveillance: is there enough leverage? Pharmacoepidemiol Drug Saf 2012;21:611–21 [DOI] [PubMed] [Google Scholar]
- 7.Avorn J, Schneeweiss S. Managing drug-risk information: what to do with all those new numbers. N Engl J Med 2009;361:647–9 [DOI] [PubMed] [Google Scholar]
- 8.Hauben M, Bate A. Decision support methods for the detection of adverse events in post-marketing data. Drug Discov Today 2009;14:343–57 [DOI] [PubMed] [Google Scholar]
- 9.Fox S. Health topics: 80% of internet users look for health information online. Pew Internet and American Life Project. 2011. http://pewinternet.org/Reports/2011/HealthTopics.aspx (accessed 25 Jun 2012).
- 10.Polgreen PM, Chen Y, Pennock DM, et al. Using internet searches for influenza surveillance. Clin Infect Dis 2008;47:1443–8 [DOI] [PubMed] [Google Scholar]
- 11.Ginsberg J, Mohebbi MH, Patel RS, et al. Detecting influenza epidemics using search engine query data. Nature 2009;457:1012–14 [DOI] [PubMed] [Google Scholar]
- 12.White RW, Horvitz E. Cyberchondria: studies on the escalation of medical concerns in Web search. Trans Inf Sys 2009;27:23 [Google Scholar]
- 13.Tatonetti NP, Fernald GH, Altman RB. A novel signal detection algorithm for identifying hidden drug–drug interactions in adverse event reports. J Am Med Inform Assoc 2011;19:79–85 [DOI] [PMC free article] [PubMed] [Google Scholar]
- 14.Tatonetti NP, Denny JC, Murphy SN, et al. Detecting drug interactions from adverse-event reports: interaction between paroxetine and pravastatin increases blood glucose levels. Clin Pharmacol Ther 2011;90:133–42 [DOI] [PMC free article] [PubMed] [Google Scholar]
- 15.Humphreys A. MedAdNews 200—World's Best-Selling Medicines. MedAdNews. 2007. http://en.wikipedia.org/wiki/List_of_bestselling_drugs (accessed 25 Jun 2012).
- 16.DuMouchel W. Bayesian data mining in large frequency tables, with an application to the FDA spontaneous reporting system. Amer Stat 1999;53:177–90. [Google Scholar]
- 17.Szarfman A, Machado SG, O'Neill RT. Use of screening algorithms and computer systems to efficiently signal higher-than-expected combinations of drugs and events in the US FDA's spontaneous reports database. Drug Safety 2002;25:381–92 [DOI] [PubMed] [Google Scholar]
- 18.Deshpande G, Gogolak V, Sheila WS. Data mining in drug safety: review of published threshold criteria for defining signals of disproportionate reporting. Pharm Med 2010;24:37–43 [Google Scholar]
- 19.Hanley JA, McNeil BJ. The meaning and use of the area under a receiver operating characteristic (ROC) curve. Radiology 1982;143:29–36 [DOI] [PubMed] [Google Scholar]
- 20.Harpaz R, DuMouchel W, Shah NH, et al. Novel data-mining methodologies for adverse drug event discovery and analysis. Clin Pharmacol Ther 2012;91:1010–21 [DOI] [PMC free article] [PubMed] [Google Scholar]


