Abstract
Human milk oligosaccharides (HMOs), though non-nutritive to the infant, shape the intestinal microbiota and protect against pathogens during early growth and development. Infant formulas with added galacto-oligosaccharides have been developed to mimic the beneficial effects of HMOs. Premature infants have an immature immune system and a leaky gut and are thus highly susceptible to opportunistic infections. A method employing nanoflow liquid chromatography time-of-flight mass spectrometry (MS) is presented to simultaneously identify and quantify HMOs in the feces and urine of infants, of which 75 HMOs have previously been fully structurally elucidated. Matrix-assisted laser desorption/ionization Fourier transform ion cyclotron resonance MS was employed for high-resolution and rapid compositional profiling. To demonstrate this novel method, samples from mother-infant dyads as well as samples from infants receiving infant formula fortified with dietary galacto-oligosaccharides or probiotic bifidobacteria were analyzed. Ingested oligosaccharides are demonstrated in high abundance in the infant feces and urine. While the method was developed to examine specimens from preterm infants, it is of general utility and can be used to monitor oligosaccharide consumption and utilization in term infants, children and adults. This method may therefore provide diagnostic and therapeutic opportunities.
Keywords: mass spectrometry, human milk oligosaccharides, galacto-oligosaccharides, preterm infants, breast milk, prebiotic, infant formula
INTRODUCTION
Human milk oligosaccharides (HMOs) possess no nutritive value for the infant and yet are found at high concentrations in breast milk, typically around 5-23 g/L [1-3]. These unbound oligosaccharides are beneficial to the infant in at least two ways. First, HMOs are non-digestible by the host and therefore reach the colon intact, where they act as prebiotics to selectively stimulate the growth of beneficial bacteria such as Bifidobacteria and Lactobacilli, resulting in the establishment of a healthy gut microbiota [4,2]. Second, HMOs act as decoys, competitively binding to pathogens and preventing bacterial adhesion to epithelial cells [5,6]. Preliminary data suggest a role for HMOs in brain development [7] and in leukocyte adhesion and platelet-neutrophil interactions [3].
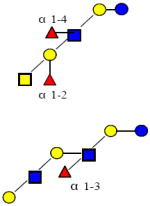
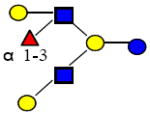
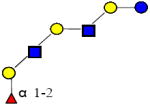
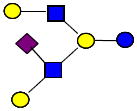
Five monosaccharide residues, namely: D-glucose (Glc), D-galactose (Gal), N-acetylglucosamine (GlcNAc), L-Fucose (Fuc), and sialic acid (N-acetyl neuraminic acid (Neu5Ac)), serve as the building blocks of HMOs. Whereas only one type of sialic acid residue is present in humans, both Neu5Ac and N-glycolyl neuraminic acid (Neu5Gc) are found in other species. These unbound oligosaccharides, commonly bearing a lactose core (Galβ-1,4Glc) at the reducing end, can be elongated with up to 25 N-acetyllactosamine repeat units (Galβ-3/4GlcNAc). The polylactosamine backbone can be sialylated in α2-3 and/or α2-6 linkages and/or fucosylated in α1-2, α1-3, and/or α1-4 linkages [3]. This heterogeneity in composition, specificity of linkages, variability in elongation, and intricacy in branching result in tremendous heterogeneity with over 200 HMOs identified in human breast milk [8].
Unsurprisingly, identification of human milk oligosaccharides remains a formidable challenge. Several analytical techniques have been used to characterize and quantitate HMOs, including mass spectrometry (MS), nuclear magnetic resonance spectroscopy, high-performance liquid chromatography, high pH anion-exchange chromatography, and capillary electrophoresis [9-13].
Analysis of HMOs in term breast milk is routinely performed in our laboratory using nano-liquid chromatography chip/time-of-flight mass spectrometry (nano-LC Chip/TOF MS) and matrix-assisted laser desorption/ionization Fourier transform-ion cyclotron resonance (MALDI FT-ICR) MS [9,14,15]. Mass spectrometry has been widely used for the analysis of bound and unbound oligosaccharides and has led to promising markers for several diseases [9,16-18]. While FT-ICR MS provides exceptional mass accuracy at few parts per million (ppm) with extremely high mass resolution and has been extensively and successfully used in complex samples, nano-LC Chip/TOF MS offers an orthogonal dimension of retention time and accurate mass, making it possible to separate isomeric HMOs, with and without sialic acids, in a single chromatographic separation. These two techniques, when combined with IRMPD (infrared multiphoton dissociation) and CID (collision-induced dissociation) MS/MS, provide invaluable information on HMO structural elucidation [19,10,12].
Early attempts to identify oligosaccharides in infant urine by MS showed only minimal differences between human milk-fed and formula-fed premature infants [20]. HMOs have been identified in the urine of nursing infants by administering 13C labeled galactose to nursing mothers followed by analysis of infant urine by isotope ratio-MS [21,22]. A previous report identified HMOs in urine and feces of breast-fed infants but not formula-fed infants using MS [6]. However, these methods monitored only a small number of oligosaccharides, making it difficult to make extensive comparisons between milk, feces, and urine.
In this study, we report a novel rapid high-throughput method for the comprehensive analysis of HMOs in milk, feces and urine samples, using nano-LC Chip/TOF MS and MALDI FT-ICR MS.
EXPERIMENTAL SECTION
Biological Samples
To demonstrate the method, samples of milk, urine, and feces were obtained from preterm mother-infant dyads enrolled in a clinical trial at the University of California Davis Medical Center following approval by the Institutional Review Board, registration at clinicaltrials.gov (NCT00810160), and informed consent from the mothers. Specimens were analyzed from one infant receiving each of the following feeding regimens: 1) human milk supplemented with powdered Similac® Human Milk Fortifier (Abbott Nutrition), 2) unsupplemented human milk followed by human milk supplemented with a fortifier made by concentrating pasteurized donor human milk (Prolact+4®, Prolacta Bioscience Inc); 3) Similac® Special Care® 24 High Protein premature infant formula supplemented with galacto-oligosaccharides (GOS); or 4) Similac® Special Care® 24 High Protein premature infant formula plus twice daily doses of probiotic Bifidobacterium animalis ssp lactis. Milk samples were collected by breast pump from enrolled mothers and frozen immediately in sterile containers. Feces samples were collected from diapers of premature infants. Rayon balls soaked in urine, but not contaminated with feces, were collected from diapers of premature infants. All samples were stored at -80 °C until analysis.
Sample Preparation for Milk
Thawed milk (500 uL) was centrifuged for 30 min at 4 °C.
Sample Preparation for Feces
Feces samples were thawed and homogenized prior to analysis. Nanopure water was added to the sample and the mixture was left in the shaker overnight at 4 °C. The mixture was then centrifuged at 4,000 g for 30 min at 4 °C.
Sample Preparation for Urine
One to three rayon balls were immersed in nanopure water and the mixture was left in the shaker overnight at 4 °C. Urine was extracted from the rayon balls using a 60 mL syringe. The volume was reduced to 1-3 mL using a centrifugal evaporator and the mixture was centrifuged at 4,000g for 30 min at 4 °C. This approach was adopted to avoid irritation to premature skin that accompanies attachment of an adherent plastic bag to the perineum. Rayon balls were chosen to avoid the hexose polymer peaks observed by MALDI FT-ICR MS analysis in water-immersed cotton balls (no MS peaks were seen with water-immersed rayon balls).
Extraction, Reduction and Purification of HMOs in Milk, Feces, and Urine
HMOs were extracted, reduced, and purified as described previously [9,14,23]. Four volumes of chloroform/methanol (2:1 v/v) were added to the decanted liquid and the mixture was centrifuged at 4,000 g for 30 min at 4 °C. The upper layer was carefully transferred. Two volumes of ethanol were added and the mixture was left at 4 °C overnight, then centrifuged for 30 min at 4 °C. The supernatant solution was evaporated to dryness using a centrifugal evaporator. HMOs were reduced to the alditol form by adding sodium borohydride and incubating at 65 °C for 1 hr. The HMOs were desalted and purified via two-step solid phase extraction (SPE) using C8 reverse-phase (Supelco, Bellefonte, PA) and graphitized carbon (Alltech, Deerfield, IL) cartridges. C8 cartridges were conditioned with two bedfuls of acetonitrile (ACN) followed by two bedfuls of nanopure water. The HMOs were loaded onto the C8 cartridge and the flow-through was collected and subsequently loaded on a preconditioned PGC cartridge. PGC cartridges were conditioned using two bedfuls of 80% aqueous ACN with 0.1% trifluoroacetic acid (TFA, v/v) and four bedfuls of nanopure water. After loading the sample onto the PGC cartridge, the cartridge was washed with four bedfuls of nanopure water to remove the salts. The desalted and purified HMOs were eluted using 20% aqueous ACN and 40% aqueous ACN with 0.05% trifluoroacetic acid (TFA), evaporated to dryness, and reconstituted with nanopure water prior to MS analysis. The workflow for analysis of fecal and urine HMOs excreted by preterm infants is outlined in Figure 1.
Figure 1.
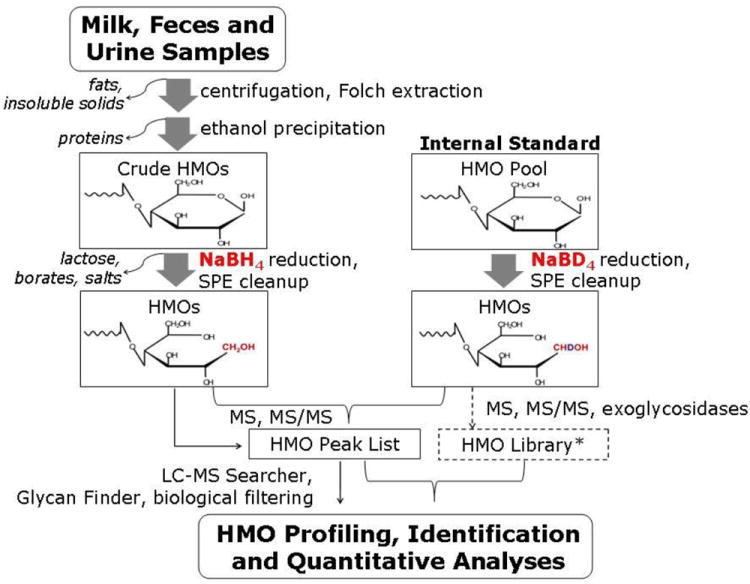
Workflow of the analysis of human milk oligosaccharides from biological samples of mother-infant dyads. *HMO library from [23, 24]
Mass Spectrometry Analysis and Determination of HMO Structures
HMOs in milk, feces, and urine were analyzed by MALDI FT-ICR MS (Varian ProMALDI) and nanoLC-Chip/TOF MS (Agilent 6200 Series HPLC Chip/TOF-MS). The FT-ICR MS is equipped with an external source ProMALDI (Varian, Palo Alto, CA), a pulsed Nd:YAG laser operating at 355 nm, and a 7.0 Tesla magnet. External calibration was performed using malto-oligosaccharides [24], allowing mass accuracy of 10 ppm or better. DHB (2,5-dihydroxy-benzoic acid) was used as a matrix (5 mg/100 μL in 50% ACN:H2O) for both positive and negative modes. Sodium chloride (0.01 M in 50% ACN:H2O) was used as a cation dopant for the positive ion mode. The HMO sample, NaCl, and DHB were spotted on a 100-well stainless steel plate in 1:0.5:1 ratio, respectively. The sample was dried in the vacuum chamber before the plate was transferred to the ion source. Three spectral acquisitions, each with 10 laser shots, were acquired per fraction. The HMOs in the 20% fraction were detected primarily as [M+Na]+ ions in the positive ionization mode while the HMOs in the 40% aqueous ACN fraction were analyzed in the negative ionization mode as [M-H]- ions.
Data files were filtered using Glycan Finder software (in-house, written in Igor Pro 5.04B), which compares exact masses of theoretical oligosaccharides with the experimental accurate masses with a specified mass tolerance of 20 ppm. Manual inspection of the outputted peak list was performed to further remove false positive entries.
NanoLC-Chip/TOF MS analysis of HMOs was performed using a glycan HPLC micro chip as described previously [23]. Briefly, the micro chip has a 40nL-enrichment column and a 43mmx0.075 mm ID analytical column, both packed with 5um-pore size porous graphitized carbon. Separation was performed using a binary gradient solvent system consisting of A: 3% ACN in 0.1% formic acid solution, and B: 90% ACN in 0.1% formic acid solution. The column was initially equilibrated and eluted at a flow rate of 0.4 uL for nanopump and 4uL for capillary pump. One uL of sample is then loaded to the column. A 65-min gradient was programmed as follows: 2.5–20min: 0%–16% B; 20–30 min: 16%–44%B; 30–35min: B increased to 100%; 35–45 min: continue at 100% B; and 45–65 min: 0% B to equilibrate the chip column before next sample injection. The drying gas temperature was 325°C at a flow rate of 4L/min (2L nitrogen gas and 2L dry grade compressed air).
Data were acquired using ESI-TOF the positive ionization mode at a mass range of m/z 200-3000. Mass correction was enabled automatically using several calibrant ions at a wide mass range (ESI-TOF Tuning Mix, Agilent Technologies, Santa Clara, CA). Data analysis was performed using Analyst QS 1.1 software and the deconvoluted peaks were extracted using the molecular feature of the Agilent Mass Hunter software at 20 ppm error. Peaks were then confirmed and retention times were corrected manually. The LC-MS peak list was further submitted for analysis to a LC-MS Searcher software (in-house, written in Java) which assigns structures to a peak based on retention time and accurate mass [10,19]. Around 2000 spectra are inputted in this program per run, and with the HMO library, this program identifies the HMOs from all the scans based on retention times and m/z and outputs the intensity and the D/H ratios of the specific HMOs. The library of 45 neutral HMOs and 30 acidic HMOs was constructed using series of exoglycosidases and MS/MS analysis by Wu et al. [10,19]. Each HMO is identified based on accurate mass and retention times.
To quantify the HMOs we compared three methods: 1) using external standards relying primarily on peak areas and MS intensities, 2) using non-HMO internal standards such as oligomers of maltose (maltohexaose), and 3) employing deuterated internal HMO standards adapted from an earlier publication with some modifications [15]. The first two methods showed excessive variation in ionization response between the different types of oligosaccharides. The deuterated HMO internal standards resulted in a more linear quantitation over a larger dynamic range [15].
Both the deuterated reference solution and sample solution were injected into the nanoLC-Chip/TOF MS and the H/D (hydrogen/deuterium) ratios were calculated by the LC-MS Searcher. In separate experiments, the deuterated reference solution was analyzed by the same instrument at several concentrations to determine the linear range. Similar standards were determined for solutions of lacto-N-tetraose (LNT) at known concentrations. For the HMO standards, we utilized an HMO pool isolated from breast milk of several milk donors instead of the HMOs of the corresponding mother in a mother-preterm infant dyad because of the biological diversity in the HMOs of the different mothers. The relative standard deviation (RSD) of the H/D ratios in all HMOs with MALDI FT-ICR MS analysis was less than 15%, as shown in Table 1.
Table 1.
Relative standard deviation (RSD) of the H/D ratios for twelve HMOs analyzed by MALDI FTMS (n=3).
| HMO | Sample 1 | Sample 2 | Sample 3 | Sample 4 | ||||||||||||
|---|---|---|---|---|---|---|---|---|---|---|---|---|---|---|---|---|
| Neutral Mass | H/D ratio | RSD | H/D ratio | RSD | H/D ratio | RSD | H/D ratio | RSD | ||||||||
| 709.264 | 1.86 | ± | 0.03 | 1.41 | 3.34 | ± | 0.36 | 10.67 | 2.23 | ± | 2.23 | 13.61 | 0.54 | ± | 0.07 | 13.14 |
| 855.322 | 1.55 | ± | 0.05 | 3.18 | 2.60 | ± | 0.11 | 4.05 | 1.92 | ± | 0.07 | 3.98 | 1.48 | ± | 0.05 | 3.66 |
| 1001.380 | 1.46 | ± | 0.03 | 2.18 | 2.42 | ± | 0.09 | 3.72 | 1.84 | ± | 0.05 | 2.16 | 1.62 | ± | 0.09 | 5.58 |
| 1074.396 | 1.47 | ± | 0.03 | 1.82 | 3.03 | ± | 0.07 | 2.25 | 1.92 | ± | 0.20 | 10.51 | 0.41 | ± | 0.04 | 9.34 |
| 1220.454 | 1.25 | ± | 0.01 | 0.69 | 2.72 | ± | 0.14 | 5.29 | 1.87 | ± | 0.00 | 0.04 | 1.22 | ± | 0.04 | 2.99 |
| 1366.512 | 1.21 | ± | 0.05 | 3.74 | 2.63 | ± | 0.18 | 6.76 | 1.88 | ± | 0.08 | 4.07 | 2.91 | ± | 0.01 | 0.28 |
| 1439.528 | 1.37 | ± | 0.05 | 3.32 | 2.86 | ± | 0.07 | 2.61 | 1.62 | ± | 0.10 | 5.42 | 0.11 | ± | 0.01 | 8.39 |
| 1512.570 | 1.24 | ± | 0.10 | 7.76 | 2.38 | ± | 0.18 | 7.51 | 2.27 | ± | 0.22 | 6.53 | 2.75 | ± | 0.06 | 2.11 |
| 1585.586 | 1.23 | ± | 0.05 | 4.05 | 2.58 | ± | 0.32 | 12.45 | 1.58 | ± | 0.12 | 9.16 | 0.27 | ± | 0.03 | 11.83 |
| 1731.644 | 1.08 | ± | 0.03 | 3.17 | 2.46 | ± | 0.36 | 14.46 | 1.50 | ± | 0.09 | 6.06 | 0.62 | ± | 0.00 | 0.69 |
| 1804.661 | 1.03 | ± | 0.13 | 12.37 | 3.00 | ± | 0.41 | 13.81 | 1.40 | ± | 0.09 | 3.52 | 0.07 | ± | 0.00 | 5.03 |
| 1950.719 | 1.00 | ± | 0.04 | 4.43 | 2.40 | ± | 0.21 | 8.71 | 1.21 | ± | 0.06 | 4.27 | 0.13 | ± | 0.01 | 6.60 |
For de novo oligosaccharides, i.e. HMOs not in the HMO library, putative structures were obtained through collision-induced dissociation CID MS/MS using nanoLC-Chip/QTOF (Agilent 6520) [10,19].
Optimization of Sample Preparation Procedure
Feces and urine contain other components that interfere with the analysis of HMOs such as fats, proteins, salts, and other organic molecules [25-27]. Centrifugation and Folch extractions were performed to remove the fat layer and other insoluble solids [28]. The insoluble solids that settled at the bottom of the tube after centrifugation did not show the presence of HMOs upon MS analysis. Ethanol precipitation was performed to remove proteins and other organic residues [29,30]. Subsequently, extracted HMOs were reduced from the aldehyde into the alditol form using sodium borohydride to prevent anomeric splitting of peaks during analysis by nano-LC Chip/TOF MS [31]. The reduced HMOs were then purified by a two-step SPE: first using a C8 reverse-phase column to remove residual peptides and then using porous graphitized carbon column to desalt and purify the HMOs.
Results and Discussion
Profiling HMOs in Infant Feces and Urine
Figure 2 shows the MALDI MS profile of the mother-infant dyad from feeding group 1 (mother’s milk fortified with powdered human milk fortifier). The spectra show strong signals with excellent signal to noise (S/N). The major HMO peaks are labeled, however the baseline shows many more HMO signals that were readily differentiated. Most of the HMO structures in mother’s milk are seen in the infant feces and urine. The pie charts correspond to the HMO distributions normalized against the total HMO abundance in the sample obtained in the nano-LC Chip/TOF MS run (data not shown). The MALDI MS results were used to observe the overall profile; however for reproducibility and more accurate quantitation, results from the LC/MS analysis are monitored and presented. MALDI MS is significantly faster (<1 min compared to 60 min for LC/MS) and is used for rapidly determining sample quality. The two methods yielded consistent results. Note that this milk sample has a low percentage of fucosylated HMOs compared to that which is typical of milk from mother’s delivering at term (approximately 60%). This is consistent with our previous observation that HMO fucosylation is highly variable in women delivering preterm [23].
Figure 2.
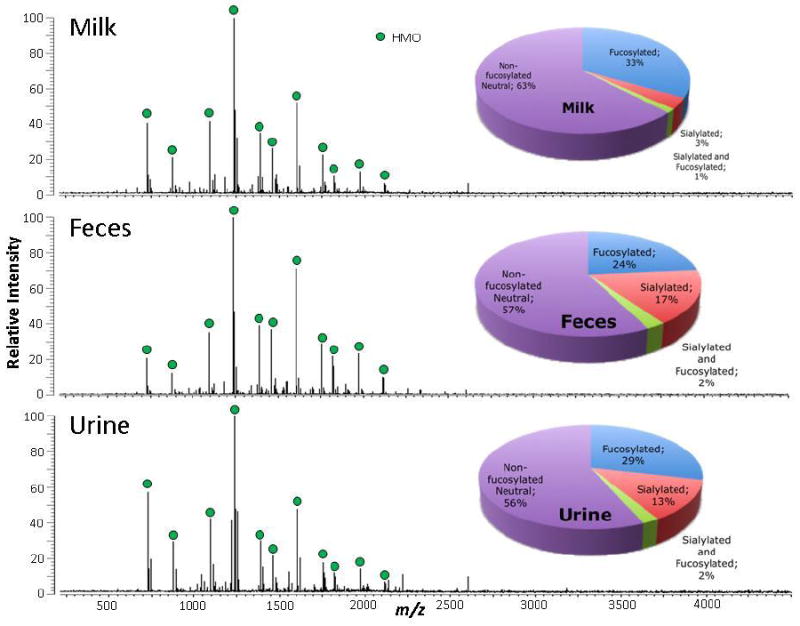
MALDI FT-ICR MS profiles in positive ion mode of the HMOs in milk (A), feces (B), and urine (C) of a mother-preterm infant dyad. Milk, feces and urine samples are 5, 1 and 150 ug, respectively. HMOs are marked with blue dots. Distributions of fucosylated and sialylated glycans are based on HMO intensities normalized against the total HMO intensities. Pie charts represent nanoLC MS data.
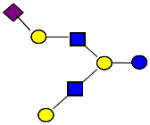
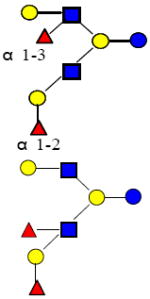
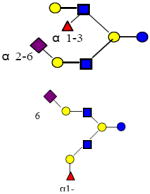
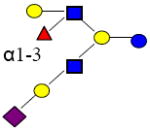
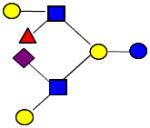
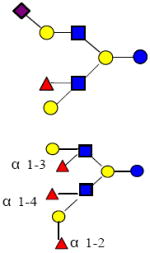
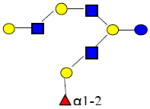
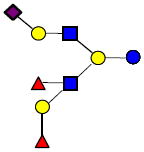
The overall distribution of HMOs in milk, feces and urine appear similar, with the non-fucosylated HMOs most abundant, followed by the fucosylated, sialylated and then fucosylated and sialylated HMOs. Table 2 summarizes the five most abundant HMO compositions in milk, feces and urine in a mother-preterm infant dyad analyzed by nano-LC Chip/TOF MS. The HMO peak with m/z 732.3 is the most abundant in all three biological samples. However, the mono fucosylated HMO peak with m/z 878.3 is abundant in both milk and urine but less abundant in feces suggesting systemic absorption of this HMO. In contrast, the HMO peak with m/z 1097.4, a neutral non-fucosylated HMO peak, is abundant in milk and feces but not in urine suggesting that this HMO is not absorbed, but passes mostly unchanged through the intestinal tract. The HMO peak with m/z 1389.5 is abundant in milk but not in feces and urine suggesting deconstruction/consumption within the intestinal tract. Lastly, sialylated HMO peaks are abundant in both the feces and urine but not in the milk suggesting synthesis in the proximal intestine. Table 3 provides detailed quantitation of known HMO structures from a different mother-infant dyad (unfortified breast milk).
Table 2.
Five abundant HMOs in milk, feces and urine of a mother-infant dyad analyzed by nano-LC Chip/TOF MS.
| MILK
| ||||||
|---|---|---|---|---|---|---|
| [M + Na]+ (alditol) | Neutral Mass | Hex | Fuc | HexN Ac | Neu Ac | Rel Abund |
| 732.3 | 709.3 | 3 | 1 | 53.1 | ||
| 878.3 | 855.3 | 3 | 1 | 1 | 18.1 | |
| 1243.4 | 1220.5 | 4 | 1 | 2 | 8.9 | |
| 1097.4 | 1074.4 | 4 | 2 | 8.5 | ||
| 1389.5 | 1366.5 | 4 | 2 | 2 | 2.9 | |
|
| ||||||
|
FECES
| ||||||
| [M + Na]+ (alditol) | Neutral Mass | Hex | Fuc | Hex NAc | Neu Ac | Rel Abund |
|
| ||||||
| 732.3 | 709.3 | 3 | 1 | 45.4 | ||
| 1097.4 | 1074.4 | 4 | 2 | 8.4 | ||
| 1023.3 | 1000.4 | 3 | 1 | 1 | 8.2 | |
| 1243.4 | 1220.5 | 4 | 1 | 2 | 8.1 | |
| 878.3 | 855.3 | 3 | 1 | 1 | 7.6 | |
|
| ||||||
|
URINE
| ||||||
| [M + Na]+ (alditol) | Neutral Mass | Hex | Fuc | Hex NAc | Neu Ac | Rel Abund |
|
| ||||||
| 732.3 | 709.3 | 3 | 1 | 56.1 | ||
| 878.3 | 855.3 | 3 | 1 | 1 | 23.3 | |
| 699.3 | 676.3 | 1 | 1 | 1 | 5.9 | |
| 658.2 | 635.2 | 2 | 1 | 4.9 | ||
| 1243.4 | 1220.5 | 4 | 1 | 2 | 2.5 | |
Table 3.
Quantitation of HMOs in milk, feces and urine of a mother-infant dyad analyzed by nano-LC Chip/TOF MS. The infant was receiving unfortified mother’s milk at the time of this collection. ND=not detected (i.e. below the level of detection)
| Composition | Abundance (counts per second) | ||||||||||
|---|---|---|---|---|---|---|---|---|---|---|---|
| HMO | Structure | Mass | RT | Hex | Fuc | HexNAc | NeuAc | Milk | Feces | Urine | |
| 1 | 3’FL |

|
490.190 | 1.31 | 2 | 1 | 0 | 0 | ND | ND | ND |
| 2 | 2’FL |

|
490.190 | 11.69 | 2 | 1 | 0 | 0 | ND | ND | ND |
| 3 | 3’SL |

|
635.227 | 22.330 | 2 | 0 | 0 | 1 | 58916 | 191249 | 370266 |
| 4 | 6’SL |

|
635.227 | 15.231 | 2 | 0 | 0 | 1 | 30524 | 50386 | ND |
| 5 | LDFT |

|
636.248 | 14.470 | 2 | 2 | 0 | 0 | ND | 11395 | 11197 |
| 6 | 6’SLN |

|
676.254 | 14.998 | 1 | 0 | 1 | 1 | ND | 59563 | 115044 |
| 7 | 3’SLN |

|
676.254 | 23.061 | 1 | 0 | 1 | 1 | ND | ND | 227705 |
| 8 | LNT |

|
709.264 | 15.090 | 3 | 0 | 1 | 0 | 21650694 | 11349391 | 4096506 |
| 9 | LNnT |

|
709.264 | 15.200 | 3 | 0 | 1 | 0 | 410714 | 772639 | 83004 |
| 10 | 3’Sle |

|
822.312 | 14.609 | 1 | 1 | 1 | 1 | ND | ND | 4368 |
| 11 | LNFP II |

|
855.322 | 11.220 | 3 | 1 | 1 | 0 | 4140331 | ND | 1060058 |
| 12 | LNFP III |

|
855.322 | 14.470 | 3 | 1 | 1 | 0 | 1156180 | 689611 | 315594 |
| 13 | LNFP I |

|
855.322 | 14.610 | 3 | 1 | 1 | 0 | 1047071 | 694849 | ND |
| 14 | LNFP V |

|
855.322 | 15.050 | 3 | 1 | 1 | 0 | ND | ND | ND |
| 15 | LSTb |

|
1000.359 | 24.815 | 3 | 0 | 1 | 1 | 425124 | 2074566 | 119850 |
| 16 | 3011a |

|
1000.359 | 22.160 | 3 | 0 | 1 | 1 | 100189 | 33617 | ND |
| 17 | LSTa |
|
1000.359 | 28.410 | 3 | 0 | 1 | 1 | 391146 | 75275 | ND |
| 18 | LNDFH I |
|
1001.380 | 10.890 | 3 | 2 | 1 | 0 | ND | ND | 72956 |
| 19 | LNDFH II |

|
1001.380 | 11.010 | 3 | 2 | 1 | 0 | 337427 | ND | ND |
| 20 | p-LNH |

|
1074.396 | 22.700 | 4 | 0 | 2 | 0 | 1702989 | 685640 | ND |
| 21 | LNH |

|
1074.396 | 18.820 | 4 | 0 | 2 | 0 | 817205 | 434092 | 14418 |
| 22 | LNnH |

|
1074.396 | 19.470 | 4 | 0 | 2 | 0 | 219039 | 270515 | ND |
| 23 | SFLNnT |
|
1146.417 | 24.365 | 3 | 1 | 1 | 1 | 331374 | 98871 | 18919 |
| 24 | A-hepta |
|
1204.459 | 11.240 | 3 | 2 | 2 | 0 | ND | ND | 55211 |
| 25 | MFpLNH IV | 1220.454 | 15.640 | 4 | 1 | 2 | 0 | ND | ND | ND | |
| 26 | 4120a |

|
1220.454 | 16.020 | 4 | 1 | 2 | 0 | ND | ND | ND |
| 27 | MFLNH III |
|
1220.454 | 17.290 | 4 | 1 | 2 | 0 | ND | ND | ND |
| 28 | MFLNH I |

|
1220.454 | 17.700 | 4 | 1 | 2 | 0 | ND | ND | ND |
| 29 | IFLNH III |

|
1220.454 | 18.440 | 4 | 1 | 2 | 0 | ND | ND | ND |
| 30 | IFLNH I |
|
1220.454 | 21.550 | 4 | 1 | 2 | 0 | ND | ND | ND |
| 31 | DSLNT |

|
1291.445 | 31.184 | 3 | 0 | 1 | 2 | ND | ND | ND |
| 32 | 4021b |

|
1365.491 | 29.028 | 4 | 0 | 2 | 1 | ND | ND | ND |
| 33 | 4021a |
|
1365.491 | 27.000 | 4 | 0 | 2 | 1 | ND | ND | ND |
| 34 | MSLNnH |

|
1365.491 | 27.340 | 4 | 0 | 2 | 1 | 36814 | 48990 | ND |
| 35 | S-LNH |
|
1365.491 | 26.041 | 4 | 0 | 2 | 1 | 82648 | 241064 | ND |
| 36 | DFpLNH II |

|
1366.512 | 13.670 | 4 | 2 | 2 | 0 | 247529 | 308367 | ND |
| 37 | DFLNH b |

|
1366.512 | 14.980 | 4 | 2 | 2 | 0 | 791768 | 597456 | ND |
| 38 | DFLNH a |
|
1366.512 | 16.300 | 4 | 2 | 2 | 0 | 119417 | 157031 | 27489 |
| 39 | DFLNH c | 1366.512 | 20.780 | 4 | 2 | 2 | 0 | 70109 | 85771 | ND | |
| 40 | 4121a |

|
1511.550 | 23.561 | 4 | 1 | 2 | 1 | ND | ND | ND |
| 41 | MSMFLNnH |
|
1511.550 | 26.572 | 4 | 1 | 2 | 1 | ND | ND | ND |
| 42 | MSMFLNH I | 1511.550 | 24.753 | 4 | 1 | 2 | 1 | 48818 | 329311 | 10516 | |
| 43 | FS-LNH II |
|
1511.550 | 29.180 | 4 | 1 | 2 | 1 | ND | ND | ND |
| 44 | FS-LNH I |
|
1511.550 | 26.210 | 4 | 1 | 2 | 1 | ND | ND | ND |
| 45 | 4121b |

|
1511.550 | 23.700 | 4 | 1 | 2 | 1 | ND | 58240 | ND |
| 46 | FS-LNH III |
|
1511.550 | 24.200 | 4 | 1 | 2 | 1 | ND | 11564 | ND |
| 47 | TFLNH | 1512.570 | 14.760 | 4 | 3 | 2 | 0 | 48616 | 61724 | ND | |
| 48 | 4320a |

|
1512.570 | 20.110 | 4 | 3 | 2 | 0 | ND | ND | ND |
| 49 | 5130a |

|
1585.586 | 19.890 | 5 | 1 | 3 | 0 | 318729 | 224155 | 29970 |
| 50 | 5130b |

|
1585.586 | 20.760 | 5 | 1 | 3 | 0 | ND | ND | ND |
| 51 | F-LNO |

|
1585.586 | 21.360 | 5 | 1 | 3 | 0 | 53056 | 80456 | ND |
| 52 | 5130c |
|
1585.586 | 22.270 | 5 | 1 | 3 | 0 | 45483 | 100322 | ND |
| 53 | MSDFLNnH |

|
1657.604 | 28.438 | 4 | 2 | 2 | 1 | ND | ND | ND |
| 54 | FS-LNH |
|
1657.604 | 24.637 | 4 | 2 | 2 | 1 | ND | ND | ND |
| 55 | 5031a |

|
1730.622 | 29.089 | 5 | 0 | 3 | 1 | ND | 26534 | ND |
| 56 | DFLNO I |

|
1731.644 | 17.950 | 5 | 2 | 3 | 0 | ND | ND | ND |
| 57 | DFLNnO II |

|
1731.644 | 18.930 | 5 | 2 | 3 | 0 | 13738 | 47799 | ND |
| 58 | 5230a |

|
1731.644 | 19.760 | 5 | 2 | 3 | 0 | ND | ND | ND |
| 59 | DFLNnO I or DFLNO 11 |
|
1731.644 | 20.250 | 5 | 2 | 3 | 0 | 52281 | 64344 | ND |
| 60 | 5230b |

|
1731.644 | 21.480 | 5 | 2 | 3 | 0 | 25568 | ND | ND |
| 61 | FS-LNO |
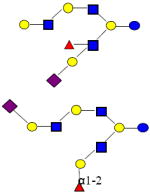
|
1876.682 | 27.200 | 5 | 1 | 3 | 1 | ND | 19359 | ND |
| 62 | 5131a | 1876.682 | 27.906 | 5 | 1 | 3 | 1 | ND | 30712 | ND | |
| 63 | TFiLNO |
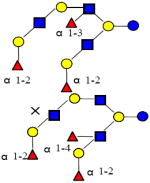
|
1877.702 | 18.500 | 5 | 3 | 3 | 0 | ND | 25376 | ND |
| 64 | 5330a | 1877.702 | 19.610 | 5 | 3 | 3 | 0 | ND | 36456 | ND | |
| 65 | 6140a |
|
1950.719 | 22.460 | 6 | 1 | 4 | 0 | ND | 27071 | ND |
| 66 | 5231b |
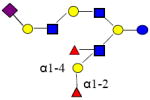
|
2022.741 | 27.271 | 5 | 2 | 3 | 1 | ND | ND | ND |
| 67 | 5231a |

|
2022.741 | 26.502 | 5 | 2 | 3 | 1 | ND | ND | ND |
| 68 | Tetra-iso-LNO |
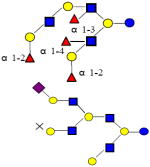
|
2023.760 | 18.330 | 5 | 4 | 3 | 0 | ND | 6454 | ND |
| 69 | 6041a | 2095.756 | 29.272 | 6 | 0 | 4 | 1 | 3975 | ND | ND | |
| 70 | 6240a |

|
2096.776 | 21.340 | 6 | 2 | 4 | 0 | 7328 | 9712 | ND |
| 71 | 5331a |

|
2168.803 | 26.138 | 5 | 3 | 3 | 1 | ND | ND | ND |
| 72 | 6340a |
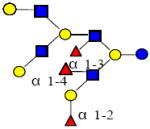
|
2242.834 | 20.330 | 6 | 3 | 4 | 0 | ND | ND | ND |
| 73 | 6340b |

|
2242.834 | 20.650 | 6 | 3 | 4 | 0 | ND | ND | ND |
| 74 | 6340c |
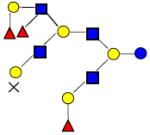
|
2242.834 | 21.220 | 6 | 3 | 4 | 0 | ND | ND | ND |
| 75 | 6440a |
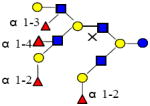
|
2388.892 | 20.250 | 6 | 4 | 4 | 0 | ND | ND | ND |
Effect of Supplementation of Human Milk with Concentrated Pasteurized Donor Human Milk
The fecal HMOs of the premature infant in the second feeding group changed with addition of donor human milk. For the first three weeks, the infant received unfortified mother’s milk. At the fourth week, the infant received mother’s milk fortified with pasteurized concentrated donor human milk. By the 6th and 7th weeks the supply of mother’s own milk was decreasing and was partially replaced with donor human milk. Figure 3 shows the HMO profile of the preterm mother’s milk and the concentrated donor human milk fortifier by MALDI FT-ICR MS. The donor human milk fortifier has more fucosylated HMO peaks (as indicated by the filled red circles). Note the presence of a difucosylated HMO with m/z 1389, which is low in intensity in the mother’s milk but high in the fortifier. Figure 4 shows the same samples analyzed by nanoLC MS. Approximately 70 HMOs were found in the premature mother’s milk (Figure 4A) and 100 in the donor milk fortifier (Figure 4B). The donor milk fortifier has higher abundances of the fucosylated oligosaccharides, as is typical of milk from mothers delivering at term. This side-by-side comparison demonstrates the differences between the two methods with MALDI MS providing a rapid overall profile and nanoLC MS providing increased reproducibility and more precise quantitation.
Figure 3.
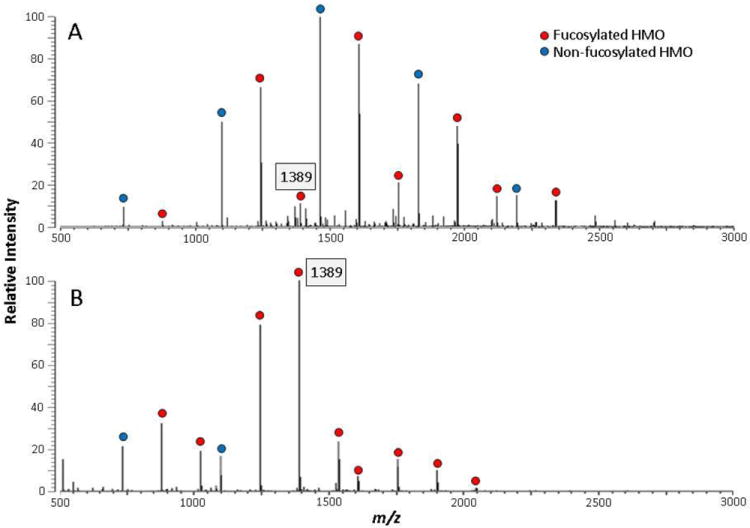
MALDI FT-ICR MS profiles of HMOs in mother’s preterm milk (A) and pasteurized concentrated donor human milk fortifier (B).
Figure 4.

Annotated base peak chromatograms of the HMOs in preterm milk (A) and the pasteurized concentrated donor human milk fortifier (B). A total of 70 and 100 possible HMOs were found in preterm milk and human milk fortifier, respectively.
The mass spectral profiles of fecal HMOs by MALDI FT-ICR MS from the premature infant over the seven-week period are shown in Figure 5. Over time, the HMOs in feces begin to resemble that of the donor milk fortifier with the fucosylated oligosaccharides increasing in abundance. The increase is best monitored by the presence of m/z 1389 (labeled peak). The peak rapidly rises from week 4 until it becomes the largest peak in the spectrum. The method demonstrates clearly the fecal HMOs originate more from the donor milk than from the mother’s own milk. Figure 6 shows the same samples analyzed by nanoLC MS with a clear increase in fucosylated HMOs as the concentrated donor milk is added.
Figure 5.
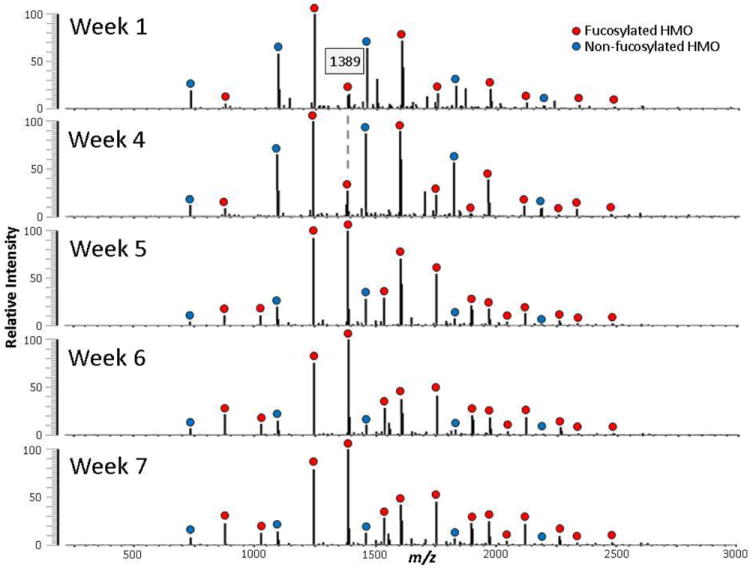
MALDI FT-ICR MS profiles of temporal fecal HMOs from one preterm infant. Concentrated donor human milk fortifier was added beginning week 4. Increasing amounts of donor human milk were given in weeks 5-7
Figure 6.
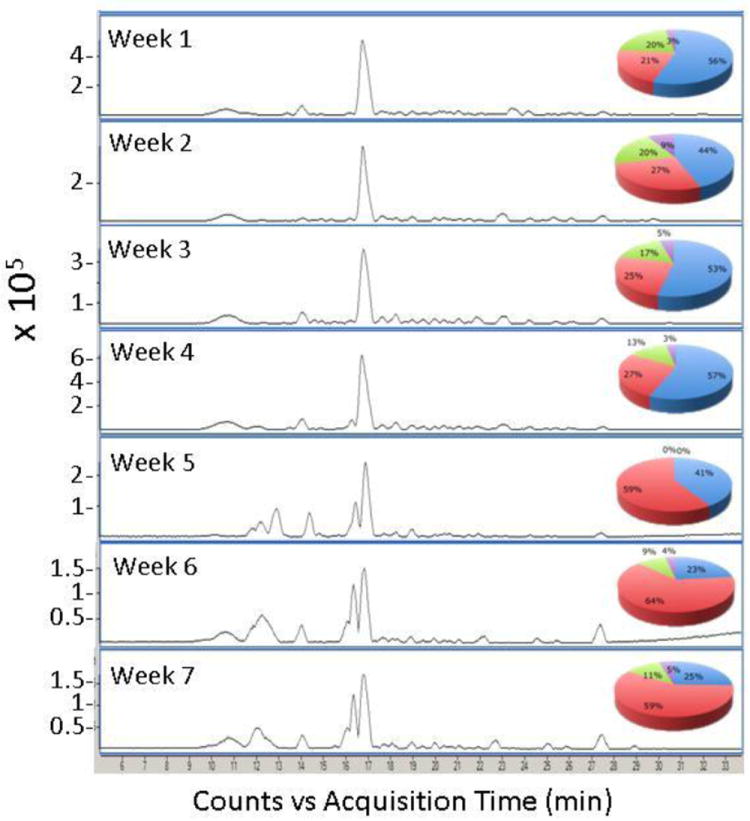
Temporal nano-LC Chip/TOF MS base peak chromatograms of the MS spectra shown in Figure 5. The pie charts show the distributions based on abundances normalized according to the total HMO abundance per sample using nano-LC Chip/TOF MS
Fecal oligosaccharide profiling of preterm infants receiving prebiotic galacto-oligosaccharide (GOS) or probiotic Bifidobacterium lactis supplements
Shown in Figure 7 are the fecal oligosaccharide profiles of preterm infants receiving feeding regimen three (infant formula milk supplemented with GOS) and feeding regimen four (infant formula plus twice daily doses of B. lactis). As expected, no HMO peaks were observed in the feces of preterm infants fed exclusively infant formula milk (data not shown). Figure 7A shows the presence of GOS peaks in the fecal oligosaccharide profile of the infant, suggesting that at least a portion of the GOS dose passes through the intestinal tract undigested by the intestinal microbiota. Figure 7B, however, shows GOS peaks in the fecal profile of the infant receiving the probiotic B. lactis, which is known to be a non-consumer of HMOs. The presence of higher m/z GOS peaks was observed in several fecal samples of preterm infants receiving formula (that does not contain GOS) and supplemental B. lactis. The presence of larger GOS oligomers is unexpected and suggests the hypothesis that GOS may be synthesized by bacterial enzymes. The demonstrated method is ideal for testing this hypothesis.
Figure 7.
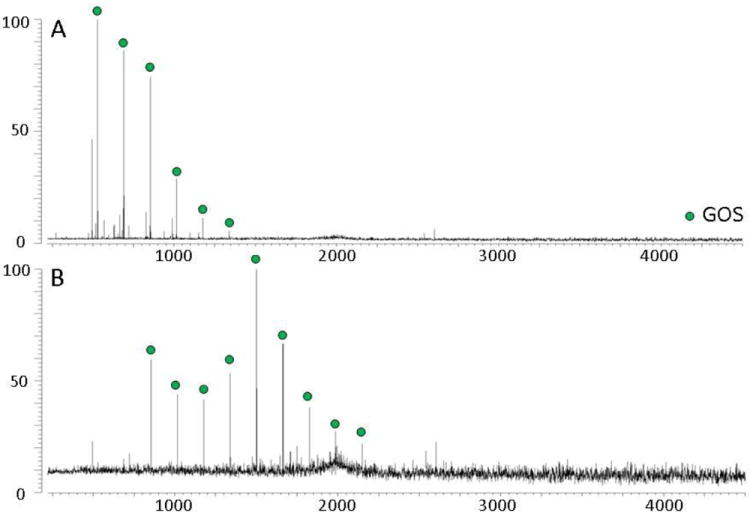
Fecal oligosaccharide MALDI FT-ICR MS profiles taken in the positive ion mode of an infant fed formula supplemented with A) GOS, and B) B. lactis
In summary, we have demonstrated a method for high throughput analysis of a broad range of HMOs and other oligosaccharides in infant feces and urine. Fecal HMOs represent structures that either survived passage through or were synthesized within the gastrointestinal tract. HMOs in the urine are absorbed from the intestinal tract and excreted and may be a marker of gut permeability and renal filtration. This method has the following advantages over existing methods: no need for maternal or infant ingestion of radio-labeled substances, high throughput, high mass accuracy and specificity, and structural identification of a broad range of oligosaccharides.
Premature infants are at high risk for opportunistic infections and nutrient deficiencies due to their immature intestinal tract and immune system. A method to monitor oligosaccharides passing through the gut intact (feces) or being absorbed into the bloodstream and then filtered (urine) may provide diagnostic and therapeutic opportunities. Furthermore, although this paper focuses on preterm mother-infant dyad samples, our method for the isolation and characterization of HMOs in feces and urine samples could also be used for term infants and even adults.
Acknowledgments
Research reported in this publication was supported by the Eunice Kennedy Shriver National Institute of Child Health & Human Development of the National Institutes of Health (NIH) under Award Number R01HD059127, and NIH Award Number HD061923. The content is solely the responsibility of the authors and does not necessarily represent the official views of the National Institutes of Health.
We express our thanks to the nurses in the neonatal intensive care unit for their assistance in collecting samples, to Rudi Grimm, PhD and Agilent Technologies for providing the nano-LC Chip/TOF MS instrument, and to Prolacta Bioscience Inc for providing the Prolact+4®.
ABBREVIATIONS
- BPC
base peak chromatogram
- CID
collision-induced dissociation
- DHB
2,5-dihydroxy-benzoic acid
- Fuc
L-Fucose
- Gal
D-galactose
- Glc
D-glucose
- GlcNAc
N-acetylglucosamine
- GOS
galacto-oligosaccharides
- HMO
human milk oligosaccharide
- IRMPD
infrared multiphoton dissociation
- MALDI FT-ICR
matrix-assisted laser desorption/ionization Fourier transform-ion cyclotron resonance
- nano-LC Chip/TOF
nano-liquid chromatography chip/time-of-flight
- Neu5Ac
N-acetyl neuraminic acid
- Neu5Gc
N-glycolyl neuraminic acid
- SPE
solid phase extraction
References
- 1.Bode L. Human milk oligosaccharides: prebiotics and beyond. Nutr Rev. 2009;67(Suppl 2):S183–191. doi: 10.1111/j.1753-4887.2009.00239.x. [DOI] [PubMed] [Google Scholar]
- 2.Coppa GV, Bruni S, Morelli L, Soldi S, Gabrielli O. The first prebiotics in humans: human milk oligosaccharides. J Clin Gastroenterol. 2004;38(6 Suppl):S80–83. doi: 10.1097/01.mcg.0000128926.14285.25. [DOI] [PubMed] [Google Scholar]
- 3.Kunz C, Rudloff S, Baier W, Klein N, Strobel S. Oligosaccharides in human milk: structural, functional, and metabolic aspects. Annu Rev Nutr. 2000;20:699–722. doi: 10.1146/annurev.nutr.20.1.699. [DOI] [PubMed] [Google Scholar]
- 4.Marcobal A, Barboza M, Froehlich JW, Block DE, German JB, Lebrilla CB, Mills DA. Consumption of human milk oligosaccharides by gut-related microbes. J Agric Food Chem. 2010;58(9):5334–5340. doi: 10.1021/jf9044205. [DOI] [PMC free article] [PubMed] [Google Scholar]
- 5.Kunz C, Rudloff S. Biological functions of oligosaccharides in human milk. Acta Paediatr. 1993;82(11):903–912. doi: 10.1111/j.1651-2227.1993.tb12597.x. [DOI] [PubMed] [Google Scholar]
- 6.Chaturvedi P, Warren CD, Buescher CR, Pickering LK, Newburg DS. Survival of human milk oligosaccharides in the intestine of infants. Adv Exp Med Biol. 2001;501:315–323. doi: 10.1007/978-1-4615-1371-1_39. [DOI] [PubMed] [Google Scholar]
- 7.Wang B, Brand-Miller J, McVeagh P, Petocz P. Concentration and distribution of sialic acid in human milk and infant formulas. Am J Clin Nutr. 2001;74(4):510–515. doi: 10.1093/ajcn/74.4.510. [DOI] [PubMed] [Google Scholar]
- 8.Zivkovic AM, German JB, Lebrilla CB, Mills DA. Human milk glycobiome and its impact on the infant gastrointestinal microbiota. Proc Natl Acad Sci U S A. 2011;108(Suppl 1):4653–4658. doi: 10.1073/pnas.1000083107. [DOI] [PMC free article] [PubMed] [Google Scholar]
- 9.Ninonuevo MR, Park Y, Yin H, Zhang J, Ward RE, Clowers BH, German JB, Freeman SL, Killeen K, Grimm R, Lebrilla CB. A strategy for annotating the human milk glycome. J Agric Food Chem. 2006;54(20):7471–7480. doi: 10.1021/jf0615810. [DOI] [PubMed] [Google Scholar]
- 10.Wu S, Tao N, German JB, Grimm R, Lebrilla CB. Development of an annotated library of neutral human milk oligosaccharides. J Proteome Res. 2010;9(8):4138–4151. doi: 10.1021/pr100362f. [DOI] [PMC free article] [PubMed] [Google Scholar]
- 11.Shen Z, Warren CD, Newburg DS. High-performance capillary electrophoresis of sialylated oligosaccharides of human milk. Anal Biochem. 2000;279(1):37–45. doi: 10.1006/abio.1999.4448. [DOI] [PubMed] [Google Scholar]
- 12.Nwosu CC, Aldredge DL, Lee H, Lerno LA, Zivkovic AM, German JB, Lebrilla CB. Comparison of the Human and Bovine Milk N-Glycome via High-Performance Microfluidic Chip Liquid Chromatography and Tandem Mass Spectrometry. Journal of Proteome Research. 2012;11(5):2912–2924. doi: 10.1021/Pr300008u. [DOI] [PMC free article] [PubMed] [Google Scholar]
- 13.Galeotti F, Coppa GV, Zampini L, Maccari F, Galeazzi T, Padella L, Santoro L, Gabrielli O, Volpi N. On-line high-performance liquid chromatography–fluorescence detection–electrospray ionization–mass spectrometry profiling of human milk oligosaccharides derivatized with 2-aminoacridone. Analytical Biochemistry. 2012;430(1):97–104. doi: 10.1016/j.ab.2012.07.027. [DOI] [PubMed] [Google Scholar]
- 14.Ninonuevo MR, Perkins PD, Francis J, Lamotte LM, LoCascio RG, Freeman SL, Mills DA, German JB, Grimm R, Lebrilla CB. Daily variations in oligosaccharides of human milk determined by microfluidic chips and mass spectrometry. J Agric Food Chem. 2008;56(2):618–626. doi: 10.1021/jf071972u. [DOI] [PubMed] [Google Scholar]
- 15.Ninonuevo MR, Ward RE, LoCascio RG, German JB, Freeman SL, Barboza M, Mills DA, Lebrilla CB. Methods for the quantitation of human milk oligosaccharides in bacterial fermentation by mass spectrometry. Anal Biochem. 2007;361(1):15–23. doi: 10.1016/j.ab.2006.11.010. [DOI] [PubMed] [Google Scholar]
- 16.de Leoz ML, Young LJ, An HJ, Kronewitter SR, Kim J, Miyamoto S, Borowsky AD, Chew HK, Lebrilla CB. High-mannose glycans are elevated during breast cancer progression. Mol Cell Proteomics. 2011;10(1) doi: 10.1074/mcp.M110.002717. [DOI] [PMC free article] [PubMed] [Google Scholar]
- 17.de Leoz ML, An HJ, Kronewitter S, Kim J, Beecroft S, Vinall R, Miyamoto S, de Vere White R, Lam KS, Lebrilla C. Glycomic approach for potential biomarkers on prostate cancer: profiling of N-linked glycans in human sera and pRNS cell lines. Dis Markers. 2008;25(4-5):243–258. doi: 10.1155/2008/515318. [DOI] [PMC free article] [PubMed] [Google Scholar]
- 18.Ninonuevo MR, Lebrilla CB. Mass spectrometric methods for analysis of oligosaccharides in human milk. Nutr Rev. 2009;67(Suppl 2):S216–226. doi: 10.1111/j.1753-4887.2009.00243.x. [DOI] [PubMed] [Google Scholar]
- 19.Wu S, Grimm R, German JB, Lebrilla CB. Annotation and structural analysis of sialylated human milk oligosaccharides. J Proteome Res. 2011;10(2):856–868. doi: 10.1021/pr101006u. [DOI] [PMC free article] [PubMed] [Google Scholar]
- 20.Rudloff S, Pohlentz G, Diekmann L, Egge H, Kunz C. Urinary excretion of lactose and oligosaccharides in preterm infants fed human milk or infant formula. Acta Paediatr. 1996;85(5):598–603. doi: 10.1111/j.1651-2227.1996.tb14095.x. [DOI] [PubMed] [Google Scholar]
- 21.Obermeier S, Rudloff S, Pohlentz G, Lentze MJ, Kunz C. Secretion of 13C-labelled oligosaccharides into human milk and infant’s urine after an oral [13C]galactose load. Isotopes Environ Health Stud. 1999;35(1-2):119–125. doi: 10.1080/10256019908234084. [DOI] [PubMed] [Google Scholar]
- 22.Rudloff S, Pohlentz G, Borsch C, Lentze MJ, Kunz C. Urinary excretion of in vivo (1)(3)C-labelled milk oligosaccharides in breastfed infants. Br J Nutr. 2012;107(7):957–963. doi: 10.1017/S0007114511004016. [DOI] [PubMed] [Google Scholar]
- 23.De Leoz ML, Gaerlan SC, Strum JS, Dimapasoc LM, Mirmiran M, Tancredi DJ, Smilowitz JT, Kalanetra KM, Mills DA, German JB, Lebrilla CB, Underwood MA. Lacto-N-tetraose, fucosylation, and secretor status are highly variable in human milk oligosaccharides from women delivering preterm. J Proteome Res. 2012;11(9):4662–4672. doi: 10.1021/pr3004979. [DOI] [PMC free article] [PubMed] [Google Scholar]
- 24.Clowers BH, Dodds ED, Seipert RR, Lebrilla CB. Dual polarity accurate mass calibration for electrospray ionization and matrix-assisted laser desorption/ionization mass spectrometry using maltooligosaccharides. Anal Biochem. 2008;381(2):205–213. doi: 10.1016/j.ab.2008.06.041. [DOI] [PMC free article] [PubMed] [Google Scholar]
- 25.Rivero-Marcotegui A, Olivera-Olmedo JE, Valverde-Visus FS, Palacios-Sarrasqueta M, Grijalba-Uche A, Garcia-Merlo S. Water, fat, nitrogen, and sugar content in feces: reference intervals in children. Clin Chem. 1998;44(7):1540–1544. [PubMed] [Google Scholar]
- 26.Iwatsuru R, Nakamura T, Inokuchi T. On the Digestibility of Proteins in Diets. J Biochem. 1950;37(4):409–420. [Google Scholar]
- 27.Rosdahl CB, Kowalski MT, editors. Textbook of Basic Nursing. 9. Woltors Kluwer Health; 2008. [Google Scholar]
- 28.Folch J, Lees M, Sloane Stanley GH. A simple method for the isolation and purification of total lipides from animal tissues. J Biol Chem. 1957;226(1):497–509. [PubMed] [Google Scholar]
- 29.Vanoss CJ. On the Mechanism of the Cold Ethanol Precipitation Method of Plasma-Protein Fractionation. J Protein Chem. 1989;8(5):661–668. doi: 10.1007/BF01025606. [DOI] [PubMed] [Google Scholar]
- 30.Kronewitter SR, de Leoz ML, Peacock KS, McBride KR, An HJ, Miyamoto S, Leiserowitz GS, Lebrilla CB. Human serum processing and analysis methods for rapid and reproducible N-glycan mass profiling. J Proteome Res. 2010;9(10):4952–4959. doi: 10.1021/pr100202a. [DOI] [PMC free article] [PubMed] [Google Scholar]
- 31.Chu CS, Ninonuevo MR, Clowers BH, Perkins PD, An HJ, Yin H, Killeen K, Miyamoto S, Grimm R, Lebrilla CB. Profile of native N-linked glycan structures from human serum using high performance liquid chromatography on a microfluidic chip and time-of-flight mass spectrometry. Proteomics. 2009;9(7):1939–1951. doi: 10.1002/pmic.200800249. [DOI] [PMC free article] [PubMed] [Google Scholar]


