

Abstract
T cell activation is mediated via the recognition of peptides by the T cell receptor (TCR). This receptor ligand interaction is highly specific, and the TCR has to discriminate between a huge number of peptides presented by the products of the major histocompatibility complexes (MHCs). Recent studies indicate that cells probe the TCR-pMHC interaction by imposing force on the interaction. Here we investigated in a theoretical analysis the consequences of such force-induced unbinding for T cell recognition. Our findings are as follows. First, the bond rupture under force is much faster, improving the time resolution of the discrimination process. Second, cells can access additional parameters characterizing the shape of the binding energy surface. Third, load-induced unbinding yields a reduced coefficient of variation of the bond lifetimes, which improves the discriminative power even between peptide/MHCs (pMHCs) with similar off-rates.
Introduction
Cell-surface receptors (CSRs) are transmembrane proteins that mediate the binding of an external stimulus to an intracellular signal. While many CSRs recognize soluble ligands, a few are optimized to discriminate ligands presented by other CSRs on an opposing cell. One example is the T cell receptor (TCR), which specifically binds to peptides presented by major histocompatibility complexes (pMHCs) on an antigen-presenting cell (APC). For both CD8+ and CD4+ T cells, there are strong indications that the TCR-pMHC off-rate is the decisive parameter for T cell activation (1,2). The results can be rationalized by the kinetic-proofreading model, for example, in which sufficient TCR engagement time is needed for a sequence of modifications that ultimately lead to the formation of the active complex (3,4); the more modification steps one assumes, the better is the specificity—i.e., the power to discriminate between good and poor ligands. However, current models fall short when it comes to discriminating ligands with only marginal differences in their off-rates: even if the discriminative power of the TCR response itself was perfect, stochastic ligand dissociation would ultimately limit the specificity (5).
We and others have recently found out that the lifetime of TCR-pMHC interactions is reduced more than 10-fold in the cell-to-cell interface compared to the lifetime of interactions with purified proteins (6–8); the effect vanished when degrading the actin cytoskeleton (6). The mechanism behind the acceleration is not understood yet, but it may well involve the local application of force; force-dependent decreases in the interaction lifetime were previously determined for various peptides using a constant-force flow-chamber assay (9). Indeed, T cells were observed to push and pull against model APCs with constant velocity (10). One may further speculate that membrane fluctuations put the protein contacts under load so that the TCR-pMHC bonds break earlier (Fig. 1 A). Such distance fluctuations between the surfaces of adhering cells and their substrates have been observed (11), and they are the basis of our understanding of the early steps in the formation of a synapse between a T cell and an APC (12,13). Moreover, a model was recently formulated in which TCR-pMHC complexes are put under tension due to the spatial segregation of long versus short surface molecules; in that model also, kinetics would be substantially accelerated (14).
Figure 1.
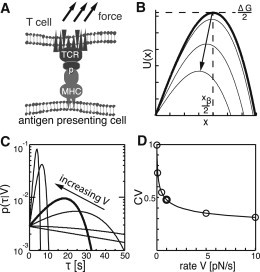
Force-induced rupture of CSR interactions. (A) Schematic of the interaction between TCR and pMHC. (B) The intrinsic free-energy surface with minimum-to-barrier distance and activation free energy is depicted as a bold line for V = 0. For pulling velocity V > 0, the combined free energy is reduced to (gray lines), yielding a reduced bond lifetime. (C) The probability density function of the bond lifetime, , is plotted logarithmically for pulling velocities of V = 0, 0.1, 0.5, 1, 5, and 10 pN/s. The bold line depicts for a rate of 1 pN/s. (D) CV of as a function of pulling velocity. Circles indicate the curves shown in C. All data were taken for the peptide K5 in Krogsgaard et al. (18).
Here, we argue that the possibility that the bonds experience a (constant) pulling velocity suggests an additional advantage of force-induced bond rupture: it leads to narrower probability distributions, which provide the T cell with a means of improved ligand discrimination. In addition, we point out that the force-induced acceleration of unbinding depends on parameters of the binding-energy landscape: the larger the distance to the activation barrier, the greater is the effect on the off-rate. This may provide T cells with an additional handle for peptide discrimination.
Results
Load dependences of biomolecular interactions have been studied extensively using atomic force microscopy (AFM) (15). In a typical molecular recognition experiment, surface and AFM tip are functionalized with a receptor and its ligand, respectively. When the AFM tip is retracted from the surface at velocity V, the molecular interaction experiences an increasing load until it ruptures at a characteristic force, Fr; the rupture force is related to rupture time via , where K is the spring constant of the cantilever. Fr has been assessed in single-molecule pulling experiments for various receptor-ligand pairs, yielding histograms with rather narrow force peaks (see, e.g., Hinterdorfer et al. (16)). Dudko et al. described such pulling experiments analytically and derived the probability distribution of rupture forces at a given pulling velocity, (17). Rewriting this distribution for rupture times yields
| (1) |
with
| (2) |
where k0 denotes the off-rate at zero pulling velocity. Dudko et al. calculated for a linear-cubic free-energy surface (; see Fig. 1 B), which gives a single energy barrier of height ΔG/2 between the bound and unbound states; xβ/2 specifies the distance of the transition state along the reaction coordinate. Note that this model does not make assumptions about the specific way in which forces are applied, as long as there is a single energy barrier along the reaction coordinate: normal (vertical) or tangential (shear) forces can be envisioned.
With increasing force, the energy barrier gets smaller so that thermal bond breakage becomes more likely, thereby reducing the bond lifetime. Therefore, as the CSRs are separated at constant velocity V, the load increases until the bond breaks at time τ. In Fig. 1 C, we have plotted the probability for various V, : at high pulling speeds, a narrow distribution with a pronounced maximum can be seen, whereas for , the probability distribution widens and approaches an exponential function, . The decrease in the dispersions of the distribution functions with increasing V can best be seen when plotting the coefficient of variation (CV), defined as the standard deviation over the mean (Fig. 1 D). At the end of this article, we show that it is this narrowing of the probability distribution at high pulling speeds that leads to higher specificity in the recognition process. Before discussing this aspect, however, we take a little detour.
To quantitatively guide our further description, we used the kinetic off-rates measured under zero force via surface plasmon resonance on the 2B4 TCR system (18). k0 can be linked to the height of the energy barrier by the Kramers theory (17,19):
| (3) |
We used Eq. 3 to estimate the energy barrier for unbinding the peptides K5, K3, PCC(103K), K2, MCC, PCC, and 102S (Fig. 2 A), yielding energies ranging from 17kBT to 20kBT. For our calculation, we set xβ = 9 Å and set the diffusion coefficient to D = 5 × 10⁻¹⁴m2/s (D denotes the diffusion of the system on the free-energy surface). Values of xβ <1 nm have frequently been observed in AFM studies of receptor-ligand complexes (20–22); the same value of D was used by Dudko et al. (17). Next, we adjusted the pulling velocity such that the agonistic peptide MCC experienced approximately a fivefold reduced mean bond lifetime, (similar accelerations were found in our previous study (6)), yielding V = 1 pN/s. Such pulling velocities are in agreement with data obtained on T cells contacting beads coated with CD3 antibody; using a biomembrane force apparatus, loading rates in the range V ∼ 1.6–8 pN/s were determined, depending on target stiffness (10).
Figure 2.
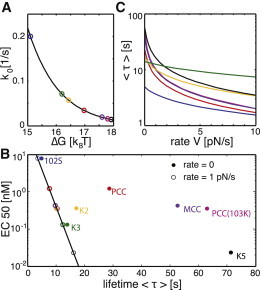
pMHC-TCR interactions accelerated by pulling. (A) Equation 3 was used to estimate the activation barrier, ΔG, from the published data for the off-rate of the seven peptides 102S (blue), PCC (red), MCC (violet), K2 (yellow), PCC(103K) (magenta), K3 (green), and K5 (black) (18). The black line shows Eq. 3, using D = 5 × 10⁻¹⁴ m2/s and xβ = 4 Å. (B) EC50 values of different peptides are plotted against the mean bond lifetime, , for a rate of V = 1 pN/s (open symbols) and V = 0 (solid symbols); ΔG was taken from A, and xβ was adjusted such that the log(EC50) values show a linear dependence on τ. (C) Mean bond lifetime, , is plotted against the applied pulling rate for seven different pMHCs (seeTable 1).
In their Fig. 1 B, Krogsgaard et al. plotted the bond lifetime versus the EC50 values for IL-2 production (18), which we reproduce here in Fig. 2 B as solid symbols. Clearly, there is some correlation in the data, but there are outliers such as K3 and K2 that show potency too strong for the rather short interaction lifetime. Krogsgaard et al. argued that conformational changes might account for the discrepancy; when plotting the EC50 against , with denoting the heat capacity, a much better correlation was found. We point out here also that force-induced unbinding could lead to a similarly improved correlation. In open symbols, Fig. 2 B shows the reduced average lifetimes when a constant pulling velocity of 1 pN/s was applied to the bonds: indeed, by adjusting xβ between 0.4 Å and 9.6 Å, all data could be forced onto a straight line in the semilogarithmic plot. In Fig. 2 C, we illustrate how further increase of the pulling speed up to 10 pN/s would alter the mean lifetime: for some combinations of ΔG and xβ, there is hardly any effect (see, e.g., K3), whereas others yield a substantial reduction by more than a factor of 10 (see, e.g., PCC). Taken together, force-induced rupture reduces interaction lifetimes between CSRs differently: in general, the profiles of EC50 versus bond lifetime will be distorted; even the order may be reversed (compare PCC and K2 in Fig. 2 B). In other words, a strong binder under zero load may become a weak binder under load, whereas for other peptides, hardly any effect may be observable. For example, modeling the bond lifetimes for the weak agonist 102S predicts only a 1.39-fold reduction under load; this agrees with our previous in situ measurements, where we observed a 1.41-fold decreased interaction lifetime upon degradation of the actin cytoskeleton (6). Note that the bond lifetime under load depends on the shape of the energy surface: cells could in principle use this information as an additional means for discrimination.
Rather small values of xβ are in agreement with recent findings, where a flow-chamber assay was used to estimate characteristic rupture forces via the Bell model, (9); in that model, the characteristic rupture force is related to xβ via ; that study yielded even lower values, between xβ = 0.007 nm and xβ = 0.06 nm. We were thus interested in determining whether substantially reduced xβ values would affect our conclusions. For this, it is interesting to note that xβ and pulling velocity occur in Eqs. 1 and 2 only in the form (the effect of Eq. 3 turned out to be negligible). That means that pulling at 10-fold increased rates (V = 10 pN/s) would yield 10-fold-reduced xβ (Table 1) but otherwise identical results to Fig. 2 B. We further tested whether the data reported by Robert et al. (9) for the 1G4 TCR would benefit from a constant pulling speed. For each F0, we calculated, accordingly, the xβ and—via Eq. 3—an estimator of ΔG. Fig. 3 A shows the EC50 versus bond lifetime at zero pulling rate (solid symbols). We next calculated the correlation between EC50 and bond lifetime for various pulling velocities ranging from 0 to 100 pN/s (Fig. 3 B). The correlation was substantially improved when the pulling velocity was increased, and it peaked at around V = 28 pN/s. The resulting values of are shown as open symbols in Fig. 3 A.
Table 1.
Parameters for the different peptides
| [1/s] | Lifetime (s) at 0 pN/s | Lifetime (s) at 1 pN/s | G (kBT) | xβ (nm) | EC50 (nM) | |
|---|---|---|---|---|---|---|
| K5 | 0.014 | 71.43 | 16.34 | 19.86 | 0.485 | 0.023 |
| PCC(103K) | 0.0159 | 62.89 | 10.28 | 19.73 | 0.96 | 0.35 |
| MCC | 0.019 | 52.63 | 10 | 19.54 | 0.9 | 0.42 |
| PCC | 0.0348 | 28.74 | 7.6 | 18.9 | 0.93 | 1.2 |
| K2 | 0.058 | 17.24 | 10.05 | 18.36 | 0.26 | 0.36 |
| K3 | 0.071 | 14.08 | 11.28 | 18.15 | 0.044 | 0.13 |
| 102S | 0.202 | 4.95 | 3.56 | 17.04 | 0.4 | 7.7 |
The off-rate, (1/s), lifetime with and without externally applied pulling rate, activation free energy, ΔG, minimum-to-barrier distance, xβ, and EC50 values are shown for the different peptides for a temperature of 300 K. Off-rates and EC50 values are taken from Krogsgaard et al. (18).
Figure 3.
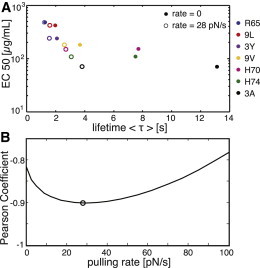
pMHC-TCR interactions accelerated by pulling. (A) For the seven peptides R65 (blue), 9L (red), 3Y (violet), 9V (yellow), H70 (magenta), H74 (green), and 3A (black) from Robert et al. (9), the EC50 values are plotted against the mean bond lifetime, , for a rate of V = 28 pN/s (open symbols) and V = 0 (solid symbols); the rate of V = 28 pN/s was estimated by the maximal anticorrelation in B. (B) The correlation between EC50 and mean bond lifetime, , was calculated using the Pearson coefficient for different pulling rates. The black circle indicates the curve’s minimum, which was used for calculating the open symbols in A.
Finally, we were interested in whether the specificity of T cell antigen recognition could be improved by the narrow probability distributions generated under load. We selected here the good signal, K5, and tested the discrimination against the poor signals, PCC(103K) and 102S; without pulling, K5 and 102S are clearly distinct, whereas K5 and PCC(103K) show very similar unbinding kinetics. In the following, we assumed that the TCR allows for perfect discrimination. In other words, the TCR response shall be a step function in time: each unbinding event is accepted above a given threshold, τthresh, whereas it is rejected below that threshold. Such perfect discrimination could indeed be possible, e.g., by means of a sequence of modifications in which the last modification is required for signal generation (5). In Fig. 4 A, we plotted for the chosen peptides, and in Fig. 4 B, we show the data at zero pulling velocity for comparison. K5 and 102S show clearly distinct curves, both with and without load. More interestingly, whereas there is hardly any difference between K5 and PCC(103K) at zero load, the data show clearly distinct curves at V = 1 pN/s. We next quantified this effect.
Figure 4.
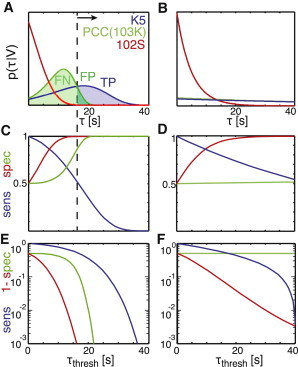
Peptide discrimination. (A) For K5 (blue), PCC(103K) (green), and 102S (red), the bond rupture probability, , versus rupture time, τ, is plotted for a pulling velocity of 1 pN/s according to Eq. 1 and Table 1. An exemplary threshold for TCR triggering is indicated as a dashed line. K5 is assumed to be the good pMHC, which shall be discriminated against the poor ligands PCC(103K) and 102S. TPs, TNs, and FPs are indicated as shaded areas below the curves. (B) Exponential probabilities are plotted for the pMHCs listed in A. (C) The sensitivity (blue) defined as TP/(TP + FN) and the specificity (red, green) defined as TP/(TP + FP) are plotted for the curves in A against the threshold τthresh. Red and green relate to discrimination of K5 against 102S and PCC(103K), respectively. (D) The specificity (red, green) and sensitivity (blue) are plotted for the exponential pdfs in B. (E and F) Semilogarithmic plots of sensitivity and 1 − specificity against τthresh for V = 1 pN/s (E) and V = 0 (F).
Ideally, each single binding event of a good ligand—but no binding event of a poor ligand—leads to TCR triggering. A correct signaling event of a good ligand due to an interaction lifetime of is termed a true positive event (TP), a correct rejection of a poor ligand due to is termed a true negative event (TN). If acceptance or rejection are mistaken, they are termed false positive (FP) or false negative (FN). Fractions of positives and negatives can be calculated by the integrals and . Fig. 4 A shows the different populations in color code. To optimize discrimination, the system needs to maximize the , which is the fraction of the true positives over all positive events. This can be accomplished by increasing τthresh. In Fig. 4, C and D, we have plotted the specificity as a function of τthresh for a pulling speed of V = 1 pN/s (Fig. 4 C) and V = 0 (Fig. 4 D). The curves show the discrimination between K5 and 102S (red) and between K5 and PCC(103K) (green). Under load, the discrimination reaches high specificity even at a threshold of <20 s. In contrast, discrimination between K5 and 102S requires much higher thresholds if no load is applied; discrimination between K5 and PCC(103K) fails completely.
A second important figure of merit is the , which denotes the fraction of counted events over all binding events for a given good peptide (Fig. 4, C and D, blue curve). Naturally, the higher the choice of threshold, the lower the sensitivity becomes due to rejection of an increasing number of events. Similar to the specificity, the sensitivity also shows steeper curves if interactions are put under load, which is a consequence of the steeper probability distribution functions. Still, a regime with high specificity and decent sensitivity can be obtained under load at a threshold around 20 s, whereas no such regime is found at zero load. The remarkable discriminative power of the system becomes apparent in the logarithmic plot shown in Fig. 4 E: at a threshold of 20 s, the specificity is >99% for both discrimination scenarios; still, ∼30% of all good events are counted.
Note that for peptides with large differences in xβ, curves may intersect in a plot of mean lifetime versus pulling velocity. An example would be K5 and K3, which yield at and vice versa (Fig. 2 C). At first glance, one may expect discrimination to actually get worse at the intersection point, where = . To characterize this effect, we analyzed in Fig. 5 the specificity and sensitivity for pulling rates below, at, and above the intersection point. The probability distributions, , differ markedly: K5 shows the characteristic maximum, whereas K3 approaches an exponential-like behavior. At V = 0.1 pN/s, K5 can be discriminated over K3 with decent specificity and sensitivity (Fig. 5 F). Even at the intersection point, V = 1.7 pN/s, the probability distributions allow for discrimination. Fig. 5 G shows the results for discriminating the good ligand, K5, over the poor ligand, K3. The specificity is modest over the whole range of thresholds. In this case, however, it would be preferential for the cell to exchange the good and the poor ligands. Indeed, Fig. 5 K shows that discrimination of K3 over K5 would work reasonably well. This is because of the steep flank of the K5 probability distribution toward longer τ, which gives no FPs at high thresholds, whereas TPs can be detected due to the long exponential tail of K3. The effect becomes more pronounced at higher pulling speeds (Fig. 5, D, H, and L).
Figure 5.
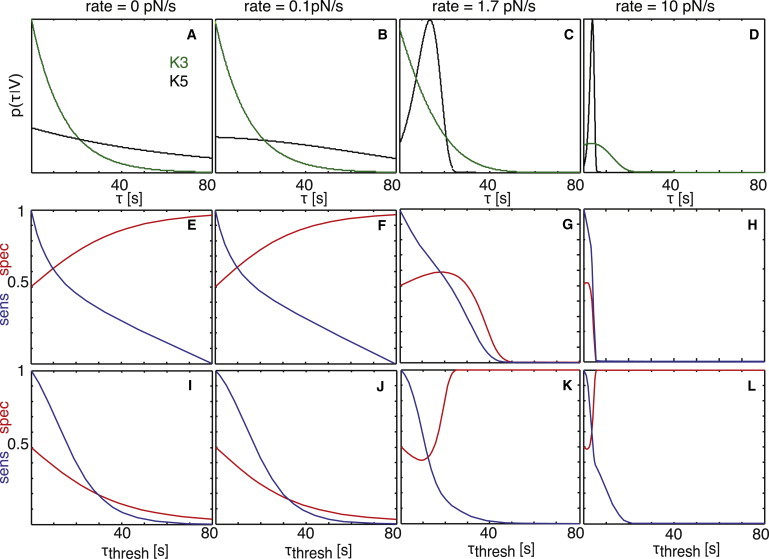
Peptide discrimination at different pulling rates. (A–D) For K5 (black) and K3 (green), the bond rupture probability, , versus rupture time, τ, is plotted for the exponential case (rate = 0 pN/s) and for rates of 0.1 pN/s, 1.7 pN/s, and 10 pN/s. The rate V = 1.7 pN/s is equivalent to the intersection of the mean bond lifetime, , versus the applied pulling-rate plot in Fig. 2C. (E–H) Assuming K5 to be the good and K3 to be the poor pMHC, the sensitivity (blue) and specificity (red) are plotted for the curves from A–D against the threshold, τthresh. (I–L) Here, sensitivity (blue) and specificity (red) are plotted for K3 as the good and K5 as the poor pMHC.
Discussion
We propose here a modified view of recognition via CSRs by including the pulling of cells on the interaction bonds. By doing this, the system achieves several advantages.
-
1.
The bond rupture becomes faster, thereby improving the resolution in time for the recognition process.
-
2.
The bond lifetime becomes dependent on pulling velocity and the shape of the binding energy landscape. This way, the system gets additional adjustable parameters for fine-tuning the interaction process. For example, cells could vary the response to a specific ligand by varying the pulling velocity. Cells could even record the full loading-rate dependence by pulling on the same bond repeatedly at different velocities, yielding a much clearer picture of the interaction profile. Finally, the pulling direction also influences the reaction coordinate and thereby the load dependence of the off-rate. Indeed, different TCR-pMHC docking geometries were found for agonistic versus nonagonistic peptides, which indicates peptide-specific constraints on the pulling angle (23).
-
3.
The probability distribution for interaction lifetimes changes from exponential to a much narrower profile with a pronounced maximum. As a consequence, a small number of interactions would be sufficient to produce a reliable signaling output. As an example, we have described the discrimination between the strong agonist K5 and the weak agonists 102S and PCC(103K). In the case of K5 versus PCC(103K), a standard measurement at zero load would yield no difference between the two peptides. In contrast, at a pulling velocity of 1 pN/s, the curves become very well separated, and a discrimination window opens up at a threshold of ∼20 s. In this case, ∼30% of all positive signals would be counted, with a specificity of ∼99%. The situation is further improved if it comes to discriminating K5 from 102S. At the same sensitivity, the specificity is now >99.9%, so that even in a 1000-fold excess of unspecific ligand, the specific triggers would dominate.
Until now, hardly any efforts have been made to observe deviations from first-order kinetics in trans-interactions of CSRs, mainly due to technical constraints. For example, our previous studies were based on rather short single-molecule trajectories, which did not enable a detailed analysis of the distribution functions (6,7). In principle, dyes with improved photostability should allow for recording the distribution functions and screening for deviations from exponential kinetics. In summary, experiments in recent years have provided increasing evidence that mechanical force is an important parameter to consider when describing T cell antigen recognition. In this theoretical work, we have focused on one aspect—improved discrimination specificity due to narrower distribution functions whenever bonds are put under tension. However, there are a variety of additional effects that may be induced by local force application. For example, mechanical forces could affect signal transmission directly by inducing conformational changes or by altering the quaternary structure of the TCR complex. Indeed, T cell antigen recognition was found to be modulated by mechanical stress exerted on the T cells (24,25). How can a cell put bonds under load? There are various mechanisms conceivable: cells may splay the intermembrane cleft by translocating larger proteins into the interface; alternatively, the plasma membrane of one cell may be curved inward by active actin-based mechanisms, thereby increasing the distance to the opposing cell. Separations of a few nanometers would be absolutely sufficient to apply such forces and release the bonds.
Acknowledgments
This work was supported by the GEN-AU project of the Austrian Federal Ministry for Science and Research and the Austrian Science Fund (FWF project Y250-B10) to G.J.S. E.K. was supported by a Federation of European Biochemical Societies Long-term Fellowship.
Footnotes
This is an Open Access article distributed under the terms of the Creative Commons-Attribution Noncommercial License (http://creativecommons.org/licenses/by-nc/2.0/), which permits unrestricted noncommercial use, distribution, and reproduction in any medium, provided the original work is properly cited.
References
- 1.Dushek O., Aleksic M., van der Merwe P.A. Antigen potency and maximal efficacy reveal a mechanism of efficient T cell activation. Sci. Signal. 2011;4:ra39. doi: 10.1126/scisignal.2001430. [DOI] [PMC free article] [PubMed] [Google Scholar]
- 2.Kersh G.J., Kersh E.N., Allen P.M. High- and low-potency ligands with similar affinities for the TCR: the importance of kinetics in TCR signaling. Immunity. 1998;9:817–826. doi: 10.1016/s1074-7613(00)80647-0. [DOI] [PubMed] [Google Scholar]
- 3.McKeithan T.W. Kinetic proofreading in T-cell receptor signal transduction. Proc. Natl. Acad. Sci. USA. 1995;92:5042–5046. doi: 10.1073/pnas.92.11.5042. [DOI] [PMC free article] [PubMed] [Google Scholar]
- 4.Coombs D., Goldstein B. T cell activation: kinetic proofreading, serial engagement and cell adhesion. J. Comput. Appl. Math. 2005;184:121–139. [Google Scholar]
- 5.Chan C., George A.J.T., Stark J. T cell sensitivity and specificity: kinetic proofreading revisited. Discrete Continuous Dyn. Syst. Ser. B. 2003;3:343–360. [Google Scholar]
- 6.Huppa J.B., Axmann M., Davis M.M. TCR-peptide-MHC interactions in situ show accelerated kinetics and increased affinity. Nature. 2010;463:963–967. doi: 10.1038/nature08746. [DOI] [PMC free article] [PubMed] [Google Scholar]
- 7.Axmann M., Huppa J.B., Schütz G.J. Determination of interaction kinetics between the T cell receptor and peptide-loaded MHC class II via single-molecule diffusion measurements. Biophys. J. 2012;103:L17–L19. doi: 10.1016/j.bpj.2012.06.019. [DOI] [PMC free article] [PubMed] [Google Scholar]
- 8.Huang J., Zarnitsyna V.I., Zhu C. The kinetics of two-dimensional TCR and pMHC interactions determine T-cell responsiveness. Nature. 2010;464:932–936. doi: 10.1038/nature08944. [DOI] [PMC free article] [PubMed] [Google Scholar]
- 9.Robert P., Aleksic M., van der Merwe P.A. Kinetics and mechanics of two-dimensional interactions between T cell receptors and different activating ligands. Biophys. J. 2012;102:248–257. doi: 10.1016/j.bpj.2011.11.4018. [DOI] [PMC free article] [PubMed] [Google Scholar]
- 10.Husson J., Chemin K., Henry N. Force generation upon T cell receptor engagement. PLoS ONE. 2011;6:e19680. doi: 10.1371/journal.pone.0019680. [DOI] [PMC free article] [PubMed] [Google Scholar]
- 11.Pierres A., Benoliel A.M., Bongrand P. How cells tiptoe on adhesive surfaces before sticking. Biophys. J. 2008;94:4114–4122. doi: 10.1529/biophysj.107.125278. [DOI] [PMC free article] [PubMed] [Google Scholar]
- 12.Weikl T.R., Lipowsky R. Pattern formation during T-cell adhesion. Biophys. J. 2004;87:3665–3678. doi: 10.1529/biophysj.104.045609. [DOI] [PMC free article] [PubMed] [Google Scholar]
- 13.James J.R., Vale R.D. Biophysical mechanism of T-cell receptor triggering in a reconstituted system. Nature. 2012;487:64–69. doi: 10.1038/nature11220. [DOI] [PMC free article] [PubMed] [Google Scholar]
- 14.Allard J.F., Dushek O., van der Merwe P.A. Mechanical modulation of receptor-ligand interactions at cell-cell interfaces. Biophys. J. 2012;102:1265–1273. doi: 10.1016/j.bpj.2012.02.006. [DOI] [PMC free article] [PubMed] [Google Scholar]
- 15.Hinterdorfer P., Dufrêne Y.F. Detection and localization of single molecular recognition events using atomic force microscopy. Nat. Methods. 2006;3:347–355. doi: 10.1038/nmeth871. [DOI] [PubMed] [Google Scholar]
- 16.Hinterdorfer P., Baumgartner W., Schindler H. Detection and localization of individual antibody-antigen recognition events by atomic force microscopy. Proc. Natl. Acad. Sci. USA. 1996;93:3477–3481. doi: 10.1073/pnas.93.8.3477. [DOI] [PMC free article] [PubMed] [Google Scholar]
- 17.Dudko O.K., Hummer G., Szabo A. Intrinsic rates and activation free energies from single-molecule pulling experiments. Phys. Rev. Lett. 2006;96:108101. doi: 10.1103/PhysRevLett.96.108101. [DOI] [PubMed] [Google Scholar]
- 18.Krogsgaard M., Prado N., Davis M.M. Evidence that structural rearrangements and/or flexibility during TCR binding can contribute to T cell activation. Mol. Cell. 2003;12:1367–1378. doi: 10.1016/s1097-2765(03)00474-x. [DOI] [PubMed] [Google Scholar]
- 19.Kramers H.A. Brownian motion in a field of force and the diffusion model of chemical reactions. Physica. 1940;7:284–304. [Google Scholar]
- 20.Rankl C., Kienberger F., Hinterdorfer P. Multiple receptors involved in human rhinovirus attachment to live cells. Proc. Natl. Acad. Sci. USA. 2008;105:17778–17783. doi: 10.1073/pnas.0806451105. [DOI] [PMC free article] [PubMed] [Google Scholar]
- 21.Nevo R., Stroh C., Hinterdorfer P. A molecular switch between alternative conformational states in the complex of Ran and importin β1. Nat. Struct. Biol. 2003;10:553–557. doi: 10.1038/nsb940. [DOI] [PubMed] [Google Scholar]
- 22.Li A., Lim T.S., Lim C.T. Molecular mechanistic insights into the endothelial receptor mediated cytoadherence of Plasmodium falciparum-infected erythrocytes. PLoS ONE. 2011;6:e16929. doi: 10.1371/journal.pone.0016929. [DOI] [PMC free article] [PubMed] [Google Scholar]
- 23.Adams J.J., Narayanan S., Garcia K.C. T cell receptor signaling is limited by docking geometry to peptide-major histocompatibility complex. Immunity. 2011;35:681–693. doi: 10.1016/j.immuni.2011.09.013. [DOI] [PMC free article] [PubMed] [Google Scholar]
- 24.Li Y.C., Chen B.M., Roffler S.R. Cutting edge: mechanical forces acting on T cells immobilized via the TCR complex can trigger TCR signaling. J. Immunol. 2010;184:5959–5963. doi: 10.4049/jimmunol.0900775. [DOI] [PubMed] [Google Scholar]
- 25.Kim S.T., Takeuchi K., Reinherz E.L. The αβ T cell receptor is an anisotropic mechanosensor. J. Biol. Chem. 2009;284:31028–31037. doi: 10.1074/jbc.M109.052712. [DOI] [PMC free article] [PubMed] [Google Scholar]