

A new immuno-TRAP technique overcomes limitations of spatial resolution and selection bias to identify gene locus associations with a nuclear subcompartment such as promyelocytic leukemia nuclear bodies.
Abstract
Important insights into nuclear function would arise if gene loci physically interacting with particular subnuclear domains could be readily identified. Immunofluorescence microscopy combined with fluorescence in situ hybridization (immuno-FISH), the method that would typically be used in such a study, is limited by spatial resolution and requires prior assumptions for selecting genes to probe. Our new technique, immuno-TRAP, overcomes these limitations. Using promyelocytic leukemia nuclear bodies (PML NBs) as a model, we used immuno-TRAP to determine if specific genes localize within molecular dimensions with these bodies. Although we confirmed a TP53 gene–PML NB association, immuno-TRAP allowed us to uncover novel locus-PML NB associations, including the ABCA7 and TFF1 loci and, most surprisingly, the PML locus itself. These associations were cell type specific and reflected the cell’s physiological state. Combined with microarrays or deep sequencing, immuno-TRAP provides powerful opportunities for identifying gene locus associations with potentially any nuclear subcompartment.
Introduction
Chromosomes in interphase cells occupy nonrandom radial and relative positioning (Parada et al., 2004). The basis for this likely depends on many factors that restrict an otherwise random distribution. The accumulation of heterochromatin domains from one or more chromosomes can take place along the lamina at the nuclear periphery. Likewise, the constitutive heterochromatin accumulations in mouse cells, called chromocenters, often consist of heterochromatic loci contributed from several chromosomes. Thus, heterochromatin domains can restrict the relative and radial orientation of chromosomes. Similarly, chromosomes that share transcription-activating factors, such as those that possess nucleolar organizing regions, will be restricted in their relative localization because they have to come together to form a nucleolus. Specific transcribed genes have also been shown to colocalize at nuclear speckles (Shopland et al., 2003) and in transcription factories (Osborne et al., 2004). These discrete subnuclear domains all contribute to a three-dimensionally structured genome (Spector, 2001). Spatial and temporal relationships between chromatin and subnuclear compartments are likely to have profound regulatory effects under physiological and developmental conditions (Misteli, 2007). Identifying these relationships is critically important for understanding the regulation of nuclear events.
Another subnuclear compartment that we and others have hypothesized may interact nonrandomly with the genome is the promyelocytic leukemia nuclear body (PML NB). The main constituent of this nuclear body is the PML protein itself. More than 60 other proteins may accumulate in these bodies under certain conditions, thereby implicating this compartment in a variety of nuclear activities (Dellaire and Bazett-Jones, 2004). A general model for PML NB function, however, has remained elusive. Although the core structure of a typical PML NB is protein-based, containing no detectable DNA, this protein core does appear to make numerous contacts with the surrounding chromatin (Boisvert et al., 2000). It is tempting to hypothesize that PML NB–chromatin contacts reflect an underlying function of these bodies.
To understand the functional importance and regulatory potential of subnuclear compartments, methods are required that can identify the genetic loci that are localized there. Two main approaches that can define a link between a protein component of the cell’s regulatory machinery and a genetic locus both use specific antibodies against the protein factor. These have been used to identify the relationship between PML protein and specific genes. Chromatin immunoprecipitation (ChIP), one of these techniques, allows for the identification of DNA sequences that are mediated either with a direct interaction with a protein of interest or indirectly through a multiprotein complex. Studies using ChIP have identified specific regions of the genomes that are bound by PML protein (Kumar et al., 2007; Gialitakis et al., 2010). However, a serious limitation of this method is that by using an antibody against PML protein, ChIP cannot differentiate between chromatin interactions with PML in nuclear bodies versus with PML protein dispersed throughout the nucleoplasm. A second drawback of ChIP is that it works optimally with soluble proteins. Unfortunately, a large fraction of PML protein is found in an insoluble nuclear matrix (Chang et al., 1995). Chromatin associated with this insoluble component would not be represented in a ChIP fraction. Therefore, ChIP results using anti-PML antibodies are difficult to interpret.
A second approach has been used extensively for probing the spatial relationships between genes and subnuclear compartments such as nuclear speckles (Shopland et al., 2003) and transcription factories (Osborne et al., 2004). Immuno-FISH combines immunofluorescence microscopy with fluorescence in situ hybridization (FISH) and has been used to demonstrate the localization of two specific genomic loci with PML NBs, the major histocompatibility complex (MHC; Shiels et al., 2001), and a region of the genome containing the TP53 gene (Sun et al., 2003). In spite of this information, immuno-FISH suffers from two significant drawbacks. First, it is limited by the resolution of light microscopy; genetic elements that are within 50–100 kbp of each other are unresolved in the micrographs (Trask et al., 1989). Second, immuno-FISH requires an a priori basis for selecting a specific locus to probe. Therefore, new or unpredicted associations between specific genes and PML NBs cannot be discovered with this approach.
To circumvent the limits of ChIP and immuno-FISH, we have developed a method called immuno-TRAP, which deposits biotin onto only the chromatin that is immediately adjacent to potentially any subnuclear structure or compartment. Affinity purification of this biotinylated chromatin then allows for further downstream analysis of functional outcomes of such an association. Here, we used the PML NB as an example of a subnuclear domain to develop immuno-TRAP and demonstrate its power to identify specific gene loci found to be associated with this structure (Sun et al., 2003). In addition to confirming a previously described association of the TP53 locus with PML NBs, the advantage of the naive aspect of our new method uncovered novel locus–PML NB associations, including the ABCA7 and TFF1 loci, and most surprisingly, the PML locus itself. We show that these associations are nonrandom, are cell type specific, and depend on the physiological state of the cell.
Results
Isolation of DNA associated with PML NBs using immuno-TRAP
To isolate DNA associated at molecular dimensions with PML NBs, we modified the RNA tagging and recovery of associated proteins (TRAP) method developed by Fraser and colleagues to deposit biotin onto the chromatin through a biotin-tyramide reagent (Carter et al., 2002). RNA TRAP was originally developed to describe the chromatin organization around the transcribing β-globin gene in liver cells from mouse embryos (Carter et al., 2002). We modified the protocol by using antibodies targeted against PML protein to localize the required peroxidase activity around PML NBs, and, therefore, named the modified protocol immuno-TRAP (Fig. 1 A). In brief, an antibody against PML protein is used to label fixed and permeabilized cells. A secondary antibody conjugated with horseradish peroxidase is added. This localizes the peroxidase activity to PML NBs and catalyzes the deposition of biotinylated tyramide to protein in the immediate vicinity of PML NBs. Once the deposition is complete, the cells are collected and the DNA purified. We chose to test the feasibility of immuno-TRAP using the Jurkat cell line because a previous study using immuno-FISH had demonstrated that the TP53 locus was associated with PML NBs, in contrast to the BCL2 locus, which was not associated (Sun et al., 2003). Thus, these two loci serve as suitable positive and negative controls for the immuno-TRAP technique.
Figure 1.

Affinity purification of PML NB–associated chromatin using immuno-TRAP. (A) Schematic of the immuno-TRAP protocol. (1) Cells are placed or grown on glass slides. (2) Cells are then fixed and permeabilized for immunolabeling for PML protein using a primary antibody against PML (blue) and a secondary antibody conjugated with HRP (red). Biotinylated tyramide (orange) and hydrogen peroxide are added to the samples and tyramide deposition occurs at PML NBs and the surrounding chromosome territories (CT). (3) Cells are collected and the DNA sheared and affinity purified on a streptavidin-agarose column. (B) Verification of the tyramide deposition. Jurkat cells were prepared for immuno-TRAP and treated with anti-PML (+Ab) and control anti-FLAG (−Ab) antibodies. Tyramide-biotin was detected with streptavidin-Cy3. Tyramide-biotin labeling occurred predominantly around PML NBs, visualized by immunofluorescence microscopy with an anti-PML antibody. Images shown are single optical planes from a z stack. Bar, 5 µm. (C) DNA gel electrophoresis was performed on three samples: sheared genomic Jurkat DNA (lane 1), immuno-TRAP isolated Jurkat DNA using a control anti-FLAG (lane 2), and using an anti-PML antibody (lane 3). Significantly more DNA was isolated when a PML-specific antibody was used compared with the control (compare lanes 2 and 3). (D) DNA dot blot analysis was performed to determine which regions within Chr17p13.2-13.1 were enriched at PML NBs. See Table S1 for the BACs used. The affinity-purified DNA (AP) and a PCR product against the CAT gene (CAT), used as a normalization standard, were radiolabeled and used to probe the membranes. Values plotted on the graph are relative to the BCL2 locus (a putative nonassociated locus). Three regions (red circles) near the TP53 locus were more enriched than the BAC containing the TP53 locus itself (arrow). (E) Bar graph comparing the enrichment of the PML locus relative to the BCL2 locus and the three highest hits from chromosome 17, measured from the DNA dot blot. Error bars in graphs (D and E) represent the standard deviation of three independent sample preparations. Paired t tests confirmed that the peaks were significantly enriched over BCL2 (*, P < 0.02; **, P < 0.01). (F) DNA dot blot analysis was performed to determine the resolution capabilities of immuno-TRAP. Six FOSMIDs spanning peak 2, the BCL2 BAC, and the BACs flanking and containing peak2 were spotted on a membrane (see Table S1 for FOSMIDs used). Probing and normalization was performed similarly as in D. Values plotted are relative to the BCL2 locus. Paired t tests indicated that FOSMID pairs 1 and 4, and 4 and 5 are significantly different (*, P < 0.05; **, P < 0.10, respectively).
To determine if biotin-tyramide deposition was specifically confined to PML NBs, immuno-TRAP was performed on fixed and permeabilized Jurkat cells before examination with fluorescence microscopy. The biotin-tyramide deposition was detected with streptavidin conjugated with the Cy3 fluorophore. As shown in Fig. 1 B, tyramide deposition was confined to PML NBs as observed by the colocalization of streptavidin and PML immunofluorescence signal. When a nonspecific anti-FLAG primary antibody was used as a control, followed by the peroxidase-tagged secondary antibody, no detectable tyramide deposition at PML NBs was observed. In addition, DNA could only be purified by streptavidin agarose beads when the anti-PML and not the anti-FLAG antibody was used (Fig. 1 C). Collectively, we conclude that immuno-TRAP is capable of tagging chromatin on the basis of its proximity to PML NBs. This tagging is within the molecular dimensions of primary and secondary antibodies.
Having demonstrated that immuno-TRAP is capable of depositing tyramide specifically to PML NBs, the next step was to confirm whether specific loci could be detected. To test the specificity, we performed immuno-TRAP on Jurkat cells and used the affinity-purified DNA as a probe for a DNA dot blot spotted with a set of BACs spanning chromosome 17p13.2-13.1, one of which contains the TP53 gene, and another BAC from chromosome 18 that contains the BCL2 locus (Table S1). Quantification of enrichment of DNA sequences along chromosome 17, relative to the BCL2 locus, revealed that our immuno-TRAP method had indeed enriched the TP53 locus (Fig. 1, D and E, arrow). Moreover, with immuno-TRAP we were able to identify genomic regions, peaks 1–3 (see Table S2 for a list of genes contained within BACs), which are even more enriched than the TP53 locus. We also detected loci that are less enriched than the BCL2 locus. Because of possible regulatory interactions between both TP53 and PML at both the protein and transcription levels (Fogal et al., 2000; de Stanchina et al., 2004), we asked whether there was a remote possibility that the PML locus itself might also be associated with PML NBs. Surprisingly, we found that the PML locus was indeed enriched at PML NBs when probed with the affinity-purified Jurkat DNA. This is the first observation of the PML locus being nonrandomly associated with PML NBs.
The resolution demonstrated with the BAC probes appears to be ∼300 kbp (Fig. 1 D), the same order as the average length of the BACs. To determine whether immuno-TRAP can actually provide higher resolution than this, we performed a similar DNA dot blot with FOSMIDs (FOSMIDs used can be found in Table S1) that spanned peak 2 (Fig. 1 F). The genomic inserts of the FOSMIDs were on average 30 kbp. From this analysis, resolution of at least 110 kbp (P < 0.05) is achieved, and possibly as high as 32 kbp (P < 0.10).
Although immuno-TRAP provides advantages over immuno-FISH, which will be discussed later, immuno-FISH is indispensable for confirmation of the gene loci identified by the immuno-TRAP result. PML NBs in Jurkat cells were detected using an antibody against PML protein, and FISH probes were prepared using the same BACs used in the DNA dot blot analysis. As expected, FISH demonstrated that the PML locus and the three highest chromosome 17 loci hits do indeed associate with PML NBs and with a frequency much greater than that of the BCL2 locus (Fig. 2, A–E). This was quantified by mean minimal distance (mmd) analysis between the locus of interest and the nearest PML NB (Fig. 2 F). By comparing the box plots of the associated loci with the BCL2 box plot, the loci we identified by immuno-TRAP were significantly more associated than the BCL2 locus (P < 0.0001). In addition, there was less variance in the data for loci targeted to PML NBs than that of the BCL2 locus. Thus, we conclude that the loci enriched by the immuno-TRAP technique are indeed associated with PML NBs.
Figure 2.

Confirmation of loci enrichment at PML NBs with immuno-FISH. (A–E) Jurkat cells were probed with the three BACs from Chr 17p13.2-13.1 that gave the highest dot blot signals (Fig. 1, D and E; red) and immunolabeled for PML NBs (green). (F) mmd measurements were obtained from the immuno-FISH images. In the box plots, the box represents the second and third quartiles, the whiskers represent the minimum and maximum values, the middle line represents the median, and an “X” denotes the mean. The three enriched regions found in this study and the PML locus were all significantly more associated with PML NBs than the BCL2 locus (P < 0.0001). (G–I) Dual-color immuno-FISH was performed where Jurkat cells were probed against peaks 1 and 2 (Fig. 1, D and E; red and green, respectively) simultaneously and immunolabeled for PML protein (cyan). The following loci arrangements were observed: (G) peak 1 is closer to the PML NB than peak 2 in 43.9% of the measurements, (H) peak 2 is closer to a PML NB than peak 1 in 30.6% of the measurements, and (I) both peaks were approximately equidistance from the PML NB. Images shown are single optical planes from a z stack. Broken lines outline cell nuclei. Bars, 5 µm.
Locus organization around PML NBs
The FISH results then begged the question of whether these distinct loci around the TP53 gene associated simultaneously with the same PML NB. Jurkat cells were prepared for immuno-FISH using BAC probes corresponding to both peaks 1 and 2. At least one locus was found near a PML NB (where FISH and immunofluorescence signal overlapped) in ∼34% of interphase cells. Three PML NB–loci interaction patterns were observed (Fig. 2, G–I). The first pattern, where peak 1 was closer to the PML NB than peak 2, occurred 43.9% of the time. The second pattern, where peak 2 was closer to the PML NB, occurred 30.6% of the time. Lastly, the third pattern, where the two FISH loci were approximately equidistant from the PML NB, occurred 12.2% of the time. This indicates that the loci do indeed associate with the same PML NB, though the actual locus that tethers this chromosome region to the PML NB may vary between cells. Although immuno-TRAP indicates that the loci represented by peak 2 are more enriched at PML NBs than loci represented by peak 1, immuno-FISH shows a slightly higher propensity for peak 1 interactions than peak 2. However, the standard deviation of the interaction measured by the dot blot analysis was greater for peak 2 than peak 1. Our interpretation of this minor discrepancy is that the association of peak 2 loci with the PML NB is more transient, possibly characterized by an interaction with a shorter half-life.
Cell type specificity of PML NB–locus associations
We then asked whether the association of particular genes with PML NBs is general or displays cell type dependence. Because PML NBs are found in regions of high transcriptional activity (Wang et al., 2004) and a majority of cell types express PML protein, we chose to probe for the association of the PML locus with PML NBs in other cell lines. To test this, we performed mmd analysis for PML and BCL2 locus association with PML NBs in the following cell lines: GM05757 cells (normal human diploid fibroblasts), HT1080 cells (derived from a fibrosarcoma), and SK-N-SH cells (neuroblastoma origin). The FISH of GM05757 and SK-N-SH cells displayed no significant association of either the PML or BCL2 locus with PML NBs. In HT1080 cells, however, the PML locus was significantly more associated (P < 0.001) with PML NBs than the control BCL2 locus (Fig. 3 D). This relationship was similar to that observed in Jurkat cells. Therefore, we conclude that associations of specific loci, such as the PML locus, with PML NBs are cell type dependent.
Figure 3.
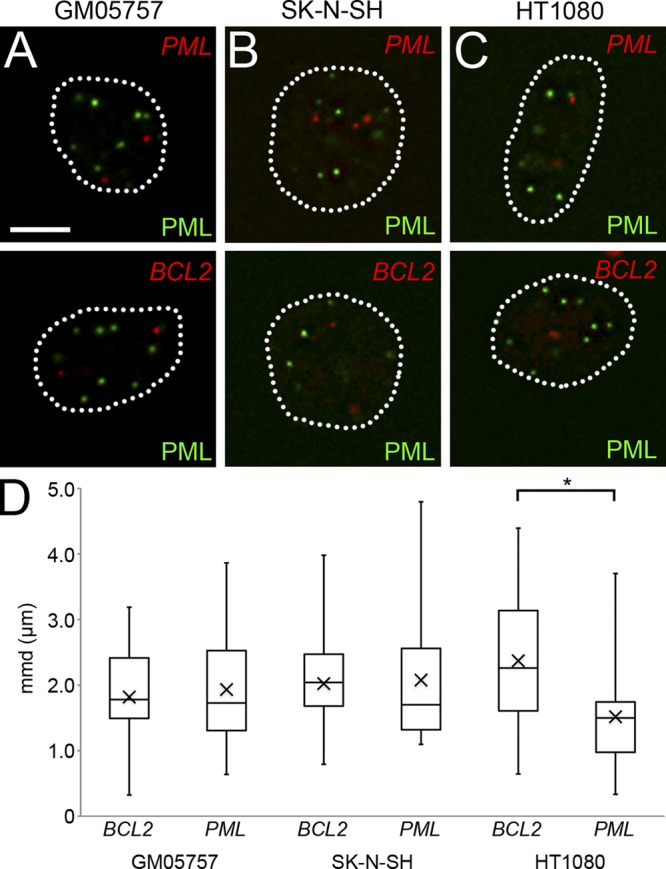
Cell type specificity of PML NB loci associations. (A–C) Immuno-FISH was performed on GM05757, SK-N-SH, and HT1080 cells to determine if the PML locus association with PML NBs is cell type specific. Cells were probed for the PML and BCL2 loci (red) and PML NBs (green). Broken lines outline cell nuclei. Bar, 5 µm. (D) Box plots comparing BCL2 and PML mmd measurements. The asterisk denotes a significant association (P < 0.001) between the PML locus and PML NBs observed in HT1080 cells. Elements in the box plots are defined the same as in Fig. 2 F. Images shown are single optical planes from a z stack.
Creating new PML NB associations
Because PML NBs are found in regions of high transcriptional activity, it may be possible to form new PML NB–locus associations by changing the transcriptional profile of the cell. To test this, we treated GM05757 cells with IFN-α. The up-regulation of the PML gene and an increase in the number and size of PML NBs (Stadler et al., 1995), typically associated with IFN treatment, was confirmed in the GM05757 cells (Fig. 4, A and B). Immuno-FISH of GM05757 cells demonstrated that new PML NB–locus associations did indeed occur. IFN treatment of GM05757 cells resulted in the formation of a specific PML NB–PML locus association (Fig. 4 C). Although the number of PML NBs increases with IFN treatment, we did not observe an association between PML NBs and the BCL2 locus (Fig. 4 C, box plot). Thus, we conclude that the association of PML NBs with the PML locus observed after IFN treatment was not the result of more and larger PML NBs, which could increase the random chance of nonspecific interactions, but the result of the formation of a bona fide association. This result was confirmed using a dot blot analysis with sequences enriched by immuno-TRAP from GM05757 cells treated with IFN-α (Fig. 4 D; see Table S1 for BACs used for the dot blot). After normalizing spot intensities, it was observed that enrichment for the PML locus increased threefold after IFN treatment (compare values for spot 4). The BAC used for identifying the PML locus region contains three other genes (LOXL1, STOML1, and GOLGA6) besides the PML gene itself. Therefore, we can only conclude with certainty that the PML locus region becomes associated with PML NBs upon IFN treatment. We believe, however, that the positions of the genes found within the PML locus also change upon IFN treatment and associate at least indirectly with PML NBs because they are found within the same genomic region. High throughput sequencing could reveal which genes within the locus directly associate with PML NBs after IFN treatment.
Figure 4.

Creating new locus–PML NBs associations. (A) GM0575 cells were treated with IFN-α for 24 h. Protein samples were prepared and Western blots were performed showing that PML protein levels increase after IFN-α. (Multiple bands correspond to various splice isoforms of PML and posttranslational modifications, i.e., sumoylation.) (B) Immunofluorescence for PML NBs was performed on GM05757 cells, and the number of PML NBs was determined. The bar graph shows that PML NBs increased in number after IFN-α treatment. (C) Immuno-FISH was performed on GM05757 cells treated with IFN-α and probed for either the PML or BCL2 locus (red) and with an antibody against PML to detect PML NBs (green). Box plots show that the PML locus was significantly more associated than the BCL2 locus after IFN-α treatment in GM05757 cells (*, P < 0.0001). Elements in the box plots are defined the same as in Fig. 2 F. Broken lines outline cell nuclei. Bar, 5 µm. (D) DNA dot blot analysis was performed on DNA (AP) isolated from IFN-α–treated GM05757 cells with immuno-TRAP and probed for enrichment against BACs corresponding to BCL2 and five BACs surrounding and including the PML locus (see Table S1 for a list of BACs). The CAT gene (CAT) was used as a normalization standard. The bar graph shows relative enrichment for each BAC relative to the BCL2 locus. This experiment was performed using three biological replicates and the error bars represent the standard deviation. Images shown are single optical planes from a z stack.
Promoter association with PML NBs
Past results have shown that DNA viruses such as herpes virus, adenovirus, human cytomegalovirus, and SV40 target their genomes to PML NBs for transcription and replication (Ishov and Maul, 1996). In addition, artificially tethering a reporter construct to PML NBs affects the transcription of the plasmid (Block et al., 2006). Therefore, we reasoned that promoters might be in the vicinity of PML NBs with possible functional consequences. Thus, we performed promoter analysis using the Agilent human promoter array with Jurkat DNA obtained with immuno-TRAP. To validate the immuno-TRAP microarray results, we used immuno-FISH. We chose to probe for 11 gene promoters significantly enriched for PML NB association based on low q-values. Besides low q-values, these 11 gene promoters were also found within BACs that had previously been FISH-mapped onto the human genome (Cheung et al., 2001; Fig. 5). Using the BCL2 locus as a negative control and the PML locus as a previously verified positive control for PML NB association, all 11 loci had a significantly higher association than BCL2. More importantly, 7 of these 11 loci had distributions equal or significantly greater than that of PML. Sequences near these promoter elements found in their respective BACs could also contribute to the PML NB association observed by the immuno-FISH verification. Nevertheless, we conclude that these seven loci found on the microarray are also able to make bona fide associations with PML NBs (see table in Fig. 5).
Figure 5.

Promoter analysis and confirmation. 11 loci were chosen and tested by immuno-FISH for possible association with PML NBs. These loci were chosen based on significance of the enrichment (low q-values) and on their having been previously FISH-mapped on the human genome. The table on the left shows the mmd averages and standard deviations between the locus of interest and PML NBs. The percent association is also shown. The mmd values were then compared with the BCL2 and PML loci. The asterisks denote values that are significantly different than BCL2mmd but similar to PMLmmd values (P < 0.001). Representative immuno-FISH of four loci (red) are shown (right) that demonstrate significant associations with PML NBs (green). Images are derived from single optical planes from a z stack. Broken lines outline cell nuclei. Bar, 5 µm.
Discussion
Our motivation in developing the immuno-TRAP technique was to provide an unbiased approach for discovering gene loci associations with potentially any subnuclear compartment. The relative positioning of gene loci to structures, such as transcription factories, nuclear bodies, and heterochromatin domains, is critical in regulating physiological responses and in genetic programming through development. Therefore, methods that define these relationships will have enormous value. With this new technique, we have verified the association between the TP53 locus and PML NBs (Sun et al., 2003), but more importantly, we uncovered novel gene–PML NB associations.
We have shown that when immuno-TRAP-purified DNA is probed with FOSMID fragments, statistically significant resolution of loci separated by 30–100 kbp can be attained (Fig. 1 F). Hence, immuno-TRAP can achieve at least this degree of genetic resolution, and may be able to surpass this resolution if even shorter probes were used. Can we relate the resolution limits of immuno-TRAP and immuno-FISH? Two gene loci on the same chromosome can be resolved by FISH (not immuno-FISH) if they are separated by at least ∼100 kbp (Trask et al., 1989), based on the spatial resolution of light microscopy and the estimated 100-fold linear compaction ratio of the DNA. However, it is more difficult to determine by immuno-FISH which of two closely linked loci (locus A or locus B) actually contacts a nuclear substructure such as a PML NB and thereby tethers the other locus to the body. The difficulty is particularly apparent when the nuclear body is large relative to the 200-nm spatial resolution of the microscope. By imaging scores of cells, however, it might be possible to determine whether locus A tethers locus B or vice versa. This depends on the genomic distance between the two loci, the degree of compaction of the chromatin, and the size of the target, i.e., the dimensions of the nuclear body. Our new immuno-TRAP technique is more suited to this question because it is based on molecular interactions and not on optics. It also benefits from the statistical advantage of sampling millions rather than only scores of cells. Ultimately, immuno-TRAP resolution is limited to the molecular dimensions of the primary and secondary antibodies and, critically, to the diffusion of activated tyramide away from the secondary antibody conjugated with the peroxidase enzyme. Modifications of the technique to limit the “blooming” of the tyramide signal around PML NBs through manipulating reaction time, tyramide concentration, and temperature may optimize both signal strength and spatial resolution. Though the spatial resolution of immuno-TRAP demonstrated with the FOSMID probes exceeds that attained by immuno-FISH, the major advantage over immuno-FISH is that immuno-TRAP can reveal unexpected or unpredicted gene loci associations, with no a priori assumptions.
Another question relates to the advantages and disadvantages of ChIP relative to immuno-TRAP. For proteins that bind DNA directly, ChIP is able to identify the same loci as immuno-TRAP, but ChIP would provide much higher resolution in the gene domain, on the order of nucleosome resolution. Immuno-TRAP, however, is more suited to the question of gene loci interactions with specific subnuclear structures, such as nuclear bodies. In other words, the question of which genes are associated with PML NBs is better answered by immuno-TRAP, whereas determining where a protein such as PML binds within a gene would be better answered with ChIP. This is true in part because of differences in the techniques. In the ChIP procedure, cells are cross-linked, then fragmented and homogenized, before antibody treatment. In the immuno-TRAP procedure, cells are cross-linked, but fragmentation occurs after the antibody step. This means that, unlike ChIP, immuno-TRAP benefits from antibody-based signal amplification. In addition, the higher the local concentration of protein, such as at nuclear bodies, the greater the amplification of the signal will be. Therefore, significantly more tyramide will be deposited on chromatin around nuclear bodies than on chromatin near nuclear-diffuse PML protein. This principle, along with the fact that PML does not bind DNA directly, weights detection in favor of genes that are in the vicinity of nuclear bodies. This, indeed, is what we observed; immuno-FISH confirmed the nuclear body association of several loci identified by immuno-TRAP.
Immuno-TRAP provides a good starting point for further downstream analysis. For example, we probed two loci for their relative configurations around a single PML NB (Fig. 2, G–I). Previously we have shown that PML NBs rapidly “jiggle” or “twitch” with an amplitude less than their diameter during interphase (Dellaire et al., 2006). Therefore, the variable association pattern displayed by these two loci could be a result of PML NBs jostling between these nearby regions along the chromosome. Sample fixation in preparation for immuno-FISH would instantly capture or freeze one of these loci in contact with the PML NB. In addition, the alternating pattern of high and low associations along the chromosomes with the same PML NB (Fig. 1 D and Fig. 2, G–I) lead us to conclude that this chromosome region forms loops tethered by a PML NB, an idea consistent with the giant loop model (Yokota et al., 1995). This model explains how the distances between loci observed through FISH can decrease even though genomic distances are increasing. To account for this observation, Trask and colleagues (Yokota et al., 1995) proposed that the chromatin forms loops are created by intrastrand protein connections. We suggest that a PML NB may function as the intrastrand protein connection for this region of Chr17. A similar function of the SATB1–PML protein complex was implicated in chromatin looping of the MHC I locus (Kumar et al., 2007). ChIP with antibodies against SATB1 and PML in combination with the 3C technique was used to identify the looped regions of the chromatin. They found PML protein to associate with the following genes: HCG4, HLA-G, HLA-A, and HCG9. When comparing our array data with the SATB1-PML dataset, we were not able to find these genes associating with PML NBs using immuno-TRAP. This difference may reflect how the datasets were obtained. Kumar et al. (2007) were looking specifically at matrix attachment region (MAR) binding sites within the region of Chr6. We, however, analyzed promoter enrichment at PML NBs with a combination of immuno-TRAP and microarray analysis. It is possible that we did enrich for those sequences, but could not detect them because they were not represented on our microarray. Although their study demonstrated an involvement of PML protein in chromatin looping of the MHC I locus, they did not explore whether PML NBs were involved in this process per se.
In addition to discovering new locus associations with PML NBs, we also observed that they are cell type specific; the PML locus–PML NB association was observed in two of the four cell lines we tested (Fig. 3). A cell type dependency for specific associations could have several explanations. The first is based on the heterogeneity of PML NBs. Composition of PML NBs differs between cell types and even between PML NBs within the same cell (Bloch et al., 1999). A particular protein complement may define the function of a given body, including the subset of genes that cluster around it through the unique repertoire of regulatory factors. This principle is observed in ALT cells, where a subset of PML NBs associate with telomeric DNA sequences and telomere-associated proteins (Yeager et al., 1999). A second possible mechanism for cell type dependence of gene associations could reflect cell type–dependent combinations of the various PML splice isoforms (Condemine et al., 2006). Whether the association of the PML locus with PML NBs in some cell types and under defined physiological states represents an opportunity for autoregulation will be explored in future studies.
These locus–PML NB associations are not static in the sense that new associations can be formed depending on the cellular state of the cell. For example, stimulating human fibroblasts with IFN led to a de novo PML locus–PML NB association not present in the unstimulated state. New PML locus–PML NB associations were detected by immuno-TRAP and confirmed by immuno-FISH (Fig. 4 C). In addition, dot blot analysis revealed a significantly higher enrichment of the PML locus in the immuno-TRAP DNA samples after IFN-α treatment relative to the no treatment control (Fig. 4 D). This result indicates that the location of newly formed PML NBs, or the movement of the locus and/or a preexisting PML NB toward each other, is a reflection of the physiological state of the cell.
By combining immuno-TRAP with high-throughput promoter microarray analysis, we were able to discover novel genomic loci that associate nonrandomly with PML NBs (Fig. 5). One advantage of using the microarray over FISH to find novel gene associations is that it provides a larger scope with no a priori bias. Microarrays, however, lack the coverage and resolution that is provided by deep sequencing techniques. In spite of this disadvantage, we were still able to find novel gene associations. TFF1 is one locus of particular interest because a possible mechanistic basis for the association is obvious. The RFP protein, which is a transcription factor for this gene (Townson et al., 2006), is also a component of a subset of PML NBs (Cao et al., 1998). Hence, RFP may be the adaptor that tethers the TFF1 gene to a PML NB. Further testing is needed to confirm this. ABCA7 is another target of interest because of its high expression in myelolymphatic tissue (Broccardo et al., 2001). Because Jurkat cells are T lymphocytes, it is tempting to think that the expression of ABCA7 may be affected by its localization at PML NBs. Future studies will test this hypothesis.
In summary, immuno-TRAP is a powerful technique for tagging and isolating chromatin that is associated with PML NBs. The aim of this technique is similar to that of DamID. Like immuno-TRAP, DamID tags chromatin associated with a nuclear subcompartment, specifically the nuclear lamina (Pickersgill et al., 2006). The difference between these two techniques is that immuno-TRAP involves aldehyde fixation (as do ChIP and 3C-based techniques), which could affect subnuclear associations through altered molecular interactions, whereas DamID requires the overexpression of a fusion protein, which could also induce nonnative associations. Although DamID has been used to tag chromatin located at the nuclear periphery, our immuno-TRAP technique can be easily adapted to any subnuclear structure for which specific primary antibodies are available. The power of immuno-TRAP could be augmented by combining immuno-TRAP with 3C or any of its derivatives and with deep sequencing to examine the chromatin environment of any nuclear subcompartment, including the nuclear lamina, nuclear pores, nucleolar periphery, late DNA repair foci, nuclear speckles, and other nuclear bodies. These combined approaches will help us to understand how the positioning of a gene locus in the nucleus is related to its regulation.
Materials and methods
Tyramide deposition and affinity purification of DNA
Tyramide deposition was modified from a previous protocol (Chakalova et al., 2004). Cells were fixed in 2% paraformaldehyde (Electron Microscopy Sciences) in PBS (Wisent) for 10 min at RT and permeabilized in 0.5% Triton X-100 (Sigma-Aldrich) in PBS for 5 min at RT. In between fixation and permeabilization, cells were washed in PBS three times. After fixation and permeabilization, cells were washed in TS buffer (100 µM Tris-HCl and 150 mM NaCl, pH 7.0). Endogenous peroxidase activity was quenched with 0.5% H2O2 in TS for 10 min at RT. After another TS wash, samples were blocked in 5% donkey serum in TS for 20 min. mAb 5E10 (a gift from R. van Driel, University of Amsterdam, Netherlands) was used to detect PML protein. A secondary antibody conjugated with horseradish peroxidase was then added to the samples. Biotinylated tyramide (Invitrogen) was diluted in 0.1 M boric acid and 0.003% H2O2 and then incubated on the samples for 2 min. Washing the cells three times in TS buffer stopped the reaction. After this, the samples were either processed for immunofluorescence microscopy or for affinity purification of the PML NB–associated chromatin.
For immunofluorescence microscopy, after the TS washes, the samples were incubated with streptavidin conjugated with Cy3, and PML was detected with anti–mouse Cy5. Samples were mounted in Vectashield containing DAPI and imaged as described in the “Immunofluorescence microscopy” section.
For affinity purification, the cells were scraped off the slides into an Eppendorf tube containing PBS. The samples were pelleted at 2,900 g at 4°C for 25 min. The pellet was resuspended in 5 M urea, 2 M NaCl, and 10 nM EDTA. This suspension was then sonicated in a sonicator (Sonicator 3000; Misonix) equipped with a cup horn in an iced water bath with the following program (5 s pulse/15 s pause repeated 15 times at power level 4). The program was repeated four more times with changes of the iced water bath between repetitions. The sample was then centrifuged at 13,000 rpm for 15 min at 4°C. The supernatant was then dialyzed overnight in PBS. Streptavidin agarose beads (Invitrogen) were washed three times in PBS and the supernatant was incubated with the beads for 3–4 h at 4°C. The beads were washed with the following buffers in this order: PBS, TSE150 (20 mM Tris, pH 8.0, 1% Triton X-100, 0.1% SDS, 2 mM EDTA, and 150 mM NaCl), TSE 500 (20 mM Tris, pH 8.0, 1% Triton X-100, 0.1% SDS, 2 mM EDTA, and 500 mM NaCl), and TE (10 mM Tris, pH 8.0, and 1 mM EDTA). The beads were collected in TE buffer, and the formaldehyde cross-links were reversed by shaking the samples at 65°C overnight. The slurry was then treated with 2 µg/ml RNase A (Thermo Fisher Scientific) for 30 min at 37°C and then with 100 µg/ml proteinase K (Thermo Fisher Scientific) for 6 h at 37°C. The DNA was phenol extracted and ethanol precipitated using glycogen as carrier. The DNA was amplified using the Whole Genome Amplification (WGA) kit (Sigma-Aldrich).
Cell culture
Jurkat cells were cultured in RPMI (Invitrogen) supplemented with 10% FBS (Wisent), 10 µg/ml penicillin and streptomycin (Invitrogen), and 2 mM l-glutamine (Invitrogen). GM05757 cells were cultured in AMEM (Invitrogen) supplemented with 15% FBS (Wisent), 10 µg/ml penicillin and streptomycin (Invitrogen), and 2 mM l-glutamine (Invitrogen). Jurkat cells were deposited on poly-l-ornithine (Sigma-Aldrich)-coated slides before processing for tyramide deposition, FISH, and immunofluorescence microscopy. GM05757 cells were grown on glass slides for FISH. For the interferon treatments, GM05757 cells were treated with 1,000 U/ml of interferon-α (PBL Interferon Source) for 24 h.
Immunofluorescence microscopy
Cells were fixed in 2% paraformaldehyde (Electron Microscopy Sciences) in PBS (Wisent) for 10 min at RT and permeabilized in 0.5% Triton X-100 (Sigma-Aldrich) in PBS for 5 min at RT. PML protein was detected with mAb 5E10 (a gift from R. van Driel), and biotinylated tyramide was detected with streptavidin conjugated with Cy3 fluor (Sigma-Aldrich). The secondary antibody used was donkey anti–mouse Cy3 or Cy5 (Jackson ImmunoResearch Laboratories, Inc.). Coverslips were then mounted using Vectashield (Vector Laboratories) containing DAPI. Images were collected using a brightfield microscope (IX81; Olympus) equipped with a camera (Cascade 512; Photometrics) using a 60×, 1.32 NA, oil-immersion objective lens and Immersion Oil Type DF (Cargille Laboratories) imaging medium. QED InVivo 3.2 (Media Cybernetics) was used to collect images, which were processed with Photoshop CS4 (Adobe).
Western blot analysis
Cells were grown in 10-cm culture dishes and were treated with or without IFN-α for 24 h. After IFN treatment, cells were harvested and resuspended with 9 M urea in 10 mM Tris-HCl, pH 6.8. 6× SDS-PAGE loading buffer was added to the cell lysates after quantification with Bradford reagent (Bio-Rad Laboratories). Protein samples were resolved on 10% SDS-PAGE gels and transferred onto nitrocellulose (GE Healthcare). PML and GAPDH protein was detected with rabbit anti-PML (Abcam) and rabbit anti-GAPDH antibodies (Abcam). A goat anti–rabbit-HRP was used for secondary labeling. Detection was performed using Western Lightning Plus ECL (PerkinElmer).
DNA dot blot
BACs and FOSMIDs (both from the Children’s Hospital Oakland Research Institute) used in this study (see Table S1) were boiled for 5 min, immediately chilled on ice, and spotted on nylon membrane Hybond-N (GE Healthcare). The membrane was then baked at 80°C for 2 h. The membrane was probed with either the affinity-purified DNA or a PCR product from the CAT gene present in the BAC backbone. The CAT PCR product was used to normalize the amount of DNA spotted on each membrane. The DNA was radiolabeled with [α-32P]dATP using the Strip-EZ kit (Ambion). Following the manufacturer’s instructions, the membranes were first probed with the affinity-purified DNA, stripped, and then probed with the CAT PCR product. Images of the membrane were exposed and collected using a STORM 860 Imager. Spots were quantified using ImageQuant 5.0 (Molecular Dynamics).
3D FISH
Cells were fixed in 2% paraformaldehyde (Electron Microscopy Sciences) in PBS for 5 min, washed three times with PBS, permeabilized in 0.5% Triton X-100 (Sigma-Aldrich) in PBS for 20 min, washed three times with PBS, and kept overnight in a solution of 20% glycerol in PBS at 4°C. The slides were then snap frozen in liquid nitrogen and allowed to partially thaw. The slides were then placed back into the solution of 20% glycerol in PBS. This was repeated for a total of five times. The slides were washed three times in PBS and then treated with 0.1 N HCl for 5 min. Cells were then washed in 2× SSC and left overnight in a solution of 50% formamide (Invitrogen) in 2× SSC. Slides were denatured in a solution of 70% formamide in 2× SSC warmed to 75°C for 3 min and then immediately placed in a cold solution of 70% formamide in 2× SSC. Probes were directly labeled with either spectrum green or spectrum orange fluor-conjugated nucleotides and obtained from The Centre for Applied Genomics. Probe and human Cot-1 DNA were mixed in a 2:1 ratio in hybridization buffer (50% formamide, 10% dextran sulfate, and 50 nM sodium phosphate buffer, pH 7.0, in 2× SSC). The hybridization mixture was denatured at 80°C for 5 min and then allowed to reanneal at 37°C for 20 min. Hybridization was allowed to proceed overnight in a humidified chamber at 37°C. The slides were washed three times in 50% formamide in 2× SSC at 42°C, and then washed in 0.5× SSC at 60°C. Next, slides were washed three times in PBS. Slides were immunolabeled for PML protein as described in the “Immunofluorescence microscopy” section and mounted in Vectashield containing DAPI. To determine the mmd between PML NBs and a locus of interest: first, z stacks were obtained at 200-nm intervals and the 3D coordinates of the center of mass for each focus were determined using ImageJ (National Institutes of Health); then the Euclidian distance between any two points was determined.
Microarray analysis
Microarray data were preprocessed largely as described previously (Ponzielli et al., 2008), with slight modifications. In brief, the A and B chips of this two-array set were considered separately. Array data were scanned using a G2565BA DNA scanner (Agilent Technologies) with Agilent Scan Control (version 7.0; http://www.chem.agilent.com/Library/usermanuals/Public/G2566-90017.pdf) using the software parameters: 5 µm, 61 mm × 21.6 mm, 16-bit TIF images, and no <XDR>. The resulting data were quantitated using Agilent Feature Extraction software (version 9.5; http://www.chem.agilent.com/Library/usermanuals/Public/ReferenceGuide_050416.pdf) using the software parameters: ChIP-v1_95_May07. The resulting data were loaded into the R statistical environment (version 2.8.1; http://cran.r-project.org/bin/windows/base/old/) and assessed for spatial and distributional homogeneity; two arrays were excluded for having highly atypical intensity distributions, leaving six total biological replicates. Data were preprocessed using the variance-stabilizing normalization algorithm with default parameter settings, as implemented in the vsn package (version 3.8.0) of the BioConductor open-source library (http://bioconductor.org/packages/2.11/bioc/html/vsn.html; Rocke and Durbin, 2001). Statistical analysis using a linear model was then fit to each probe on the array to capture differences between the enriched and control channels using the limma package (version 2.16.5; http://bioconductor.org/packages/2.11/bioc/html/limma.html) for the R statistical environment (version 2.9.0; http://cran.r-project.org/bin/windows/base/old/). The resulting hits were subjected to an empirical Bayes moderation of standard error (Smyth, 2004) and a false-discovery rate adjustment for multiple testing (Efron and Tibshirani, 2002). To identify regions of the genome enriched for hits beyond chance, we developed a novel permutation-based methodology. We took the union of the A and B chips of this two-array set and removed all control probes (those having ControlType values other than zero in the Agilent annotation). We identified candidate probes as those having log2|Fold Change| > 0 and padjusted < 0.25. We also restricted this analysis to genomic regions represented by more than three unique probes. These relaxed thresholds will initially allow up to 25% of hits to be false positives. Next, for each gene on the array (using the Agilent annotation field “GeneName”), we calculated the number of candidate probes and the mean of the log10|p| of the candidate probes. We then randomized the gene-to-data labels 100,000 times (requiring >160 h of computer processing time) and for each randomization calculated the same metrics. We determined the fraction of randomizations that exceeded the observed values and used this as an estimate of the probability that each gene was enriched relative to chance expectations. False-discovery rate adjustments were applied separately to the p-value vectors for each metric. Both raw and preprocessed microarray data have been deposited in the GEO repository at NCBI under accession GSE40554.
Online supplemental material
Table S1 lists the BACs and FOSMIDs used in the study. Table S2 lists the genes within the BACs representing the peaks in Fig. 1. Table S3 lists the number of cells analyzed in the immuno-FISH experiments. Online supplemental material is available at http://www.jcb.org/cgi/content/full/jcb.201211097/DC1. Additional data are available in the JCB DataViewer at http://dx.doi.org/10.1083/jcb.201211097.dv.
Supplementary Material
Acknowledgments
We thank R. van Driel for the 5E10 antibody, the University Health Network microarray center for their array services, and The Center for Applied Genomics (TCAG) for BAC preparation and labeling. We thank members of our laboratory for assistance with editing the manuscript and Dr. Graham Dellaire for our many discussions on approaches to tag genes in situ.
This work was supported by an operating grant from the Canadian Institutes of Health Research to D.P. Bazett-Jones. D.P. Bazett-Jones is the recipient of the Canada Research Chair in Molecular and Cellular Imaging, and L.Z. Penn is the recipient of the Canada Research Chair in Molecular Oncology. R.W. Ching was supported by a Natural Sciences and Engineering Research Council of Canada scholarship. P.C. Boutros was supported by a Natural Sciences and Engineering Research Council of Canada scholarship, an Excellence In Radiation Research for the 21st Century Program fellowship, and the Ontario Institute for Cancer Research through funding provided by the Government of Ontario.
Footnotes
Abbreviations used in this paper:
- ChIP
- chromatin immunoprecipitation
- MHC
- major histocompatibility complex
- mmd
- mean minimal distance
- PML NB
- promyelocytic leukemia nuclear body
References
- Bloch D.B., Chiche J.D., Orth D., de la Monte S.M., Rosenzweig A., Bloch K.D. 1999. Structural and functional heterogeneity of nuclear bodies. Mol. Cell. Biol. 19:4423–4430 [DOI] [PMC free article] [PubMed] [Google Scholar]
- Block G.J., Eskiw C.H., Dellaire G., Bazett-Jones D.P. 2006. Transcriptional regulation is affected by subnuclear targeting of reporter plasmids to PML nuclear bodies. Mol. Cell. Biol. 26:8814–8825 10.1128/MCB.00636-06 [DOI] [PMC free article] [PubMed] [Google Scholar]
- Boisvert F.M., Hendzel M.J., Bazett-Jones D.P. 2000. Promyelocytic leukemia (PML) nuclear bodies are protein structures that do not accumulate RNA. J. Cell Biol. 148:283–292 10.1083/jcb.148.2.283 [DOI] [PMC free article] [PubMed] [Google Scholar]
- Broccardo C., Osorio J., Luciani M.F., Schriml L.M., Prades C., Shulenin S., Arnould I., Naudin L., Lafargue C., Rosier M., et al. 2001. Comparative analysis of the promoter structure and genomic organization of the human and mouse ABCA7 gene encoding a novel ABCA transporter. Cytogenet. Cell Genet. 92:264–270 10.1159/000056914 [DOI] [PubMed] [Google Scholar]
- Cao T., Duprez E., Borden K.L., Freemont P.S., Etkin L.D. 1998. Ret finger protein is a normal component of PML nuclear bodies and interacts directly with PML. J. Cell Sci. 111:1319–1329 [DOI] [PubMed] [Google Scholar]
- Carter D., Chakalova L., Osborne C.S., Dai Y.-F., Fraser P. 2002. Long-range chromatin regulatory interactions in vivo. Nat. Genet. 32:623–626 10.1038/ng1051 [DOI] [PubMed] [Google Scholar]
- Chakalova L., Carter D., Fraser P. 2004. RNA fluorescence in situ hybridization tagging and recovery of associated proteins to analyze in vivo chromatin interactions. Methods Enzymol. 375:479–493 10.1016/S0076-6879(03)75029-0 [DOI] [PubMed] [Google Scholar]
- Chang K.S., Fan Y.H., Andreeff M., Liu J., Mu Z.M. 1995. The PML gene encodes a phosphoprotein associated with the nuclear matrix. Blood. 85:3646–3653 [PubMed] [Google Scholar]
- Cheung V.G., Nowak N., Jang W., Kirsch I.R., Zhao S., Chen X.N., Furey T.S., Kim U.J., Kuo W.L., Olivier M., et al. ; BAC Resource Consortium 2001. Integration of cytogenetic landmarks into the draft sequence of the human genome. Nature. 409:953–958 10.1038/35057192 [DOI] [PMC free article] [PubMed] [Google Scholar]
- Condemine W., Takahashi Y., Zhu J., Puvion-Dutilleul F., Guegan S., Janin A., de Thé H. 2006. Characterization of endogenous human promyelocytic leukemia isoforms. Cancer Res. 66:6192–6198 10.1158/0008-5472.CAN-05-3792 [DOI] [PubMed] [Google Scholar]
- de Stanchina E., Querido E., Narita M., Davuluri R.V., Pandolfi P.P., Ferbeyre G., Lowe S.W. 2004. PML is a direct p53 target that modulates p53 effector functions. Mol. Cell. 13:523–535 10.1016/S1097-2765(04)00062-0 [DOI] [PubMed] [Google Scholar]
- Dellaire G., Bazett-Jones D.P. 2004. PML nuclear bodies: dynamic sensors of DNA damage and cellular stress. Bioessays. 26:963–977 10.1002/bies.20089 [DOI] [PubMed] [Google Scholar]
- Dellaire G., Ching R.W., Dehghani H., Ren Y., Bazett-Jones D.P. 2006. The number of PML nuclear bodies increases in early S phase by a fission mechanism. J. Cell Sci. 119:1026–1033 10.1242/jcs.02816 [DOI] [PubMed] [Google Scholar]
- Efron B., Tibshirani R. 2002. Empirical bayes methods and false discovery rates for microarrays. Genet. Epidemiol. 23:70–86 10.1002/gepi.1124 [DOI] [PubMed] [Google Scholar]
- Fogal V., Gostissa M., Sandy P., Zacchi P., Sternsdorf T., Jensen K., Pandolfi P.P., Will H., Schneider C., Del Sal G. 2000. Regulation of p53 activity in nuclear bodies by a specific PML isoform. EMBO J. 19:6185–6195 10.1093/emboj/19.22.6185 [DOI] [PMC free article] [PubMed] [Google Scholar]
- Gialitakis M., Arampatzi P., Makatounakis T., Papamatheakis J. 2010. Gamma interferon-dependent transcriptional memory via relocalization of a gene locus to PML nuclear bodies. Mol. Cell. Biol. 30:2046–2056 10.1128/MCB.00906-09 [DOI] [PMC free article] [PubMed] [Google Scholar]
- Ishov A.M., Maul G.G. 1996. The periphery of nuclear domain 10 (ND10) as site of DNA virus deposition. J. Cell Biol. 134:815–826 10.1083/jcb.134.4.815 [DOI] [PMC free article] [PubMed] [Google Scholar]
- Kumar P.P., Bischof O., Purbey P.K., Notani D., Urlaub H., Dejean A., Galande S. 2007. Functional interaction between PML and SATB1 regulates chromatin-loop architecture and transcription of the MHC class I locus. Nat. Cell Biol. 9:45–56 10.1038/ncb1516 [DOI] [PubMed] [Google Scholar]
- Misteli T. 2007. Beyond the sequence: cellular organization of genome function. Cell. 128:787–800 10.1016/j.cell.2007.01.028 [DOI] [PubMed] [Google Scholar]
- Osborne C.S., Chakalova L., Brown K.E., Carter D., Horton A., Debrand E., Goyenechea B., Mitchell J.A., Lopes S., Reik W., Fraser P. 2004. Active genes dynamically colocalize to shared sites of ongoing transcription. Nat. Genet. 36:1065–1071 10.1038/ng1423 [DOI] [PubMed] [Google Scholar]
- Parada L.A., McQueen P.G., Misteli T. 2004. Tissue-specific spatial organization of genomes. Genome Biol. 5:R44 10.1186/gb-2004-5-7-r44 [DOI] [PMC free article] [PubMed] [Google Scholar]
- Pickersgill H., Kalverda B., de Wit E., Talhout W., Fornerod M., van Steensel B. 2006. Characterization of the Drosophila melanogaster genome at the nuclear lamina. Nat. Genet. 38:1005–1014 10.1038/ng1852 [DOI] [PubMed] [Google Scholar]
- Ponzielli R., Boutros P.C., Katz S., Stojanova A., Hanley A.P., Khosravi F., Bros C., Jurisica I., Penn L.Z. 2008. Optimization of experimental design parameters for high-throughput chromatin immunoprecipitation studies. Nucleic Acids Res. 36:e144 10.1093/nar/gkn735 [DOI] [PMC free article] [PubMed] [Google Scholar]
- Rocke D.M., Durbin B. 2001. A model for measurement error for gene expression arrays. J. Comput. Biol. 8:557–569 10.1089/106652701753307485 [DOI] [PubMed] [Google Scholar]
- Shiels C., Islam S.A., Vatcheva R., Sasieni P., Sternberg M.J., Freemont P.S., Sheer D. 2001. PML bodies associate specifically with the MHC gene cluster in interphase nuclei. J. Cell Sci. 114:3705–3716 [DOI] [PubMed] [Google Scholar]
- Shopland L.S., Johnson C.V., Byron M., McNeil J., Lawrence J.B. 2003. Clustering of multiple specific genes and gene-rich R-bands around SC-35 domains: evidence for local euchromatic neighborhoods. J. Cell Biol. 162:981–990 10.1083/jcb.200303131 [DOI] [PMC free article] [PubMed] [Google Scholar]
- Smyth G.K. 2004. Linear models and empirical bayes methods for assessing differential expression in microarray experiments. Stat. Appl. Genet. Mol. Biol. 3:e3. [DOI] [PubMed] [Google Scholar]
- Spector D.L. 2001. Nuclear domains. J. Cell Sci. 114:2891–2893 [DOI] [PubMed] [Google Scholar]
- Stadler M., Chelbi-Alix M.K., Koken M.H., Venturini L., Lee C., Saïb A., Quignon F., Pelicano L., Guillemin M.C., Schindler C., et al. 1995. Transcriptional induction of the PML growth suppressor gene by interferons is mediated through an ISRE and a GAS element. Oncogene. 11:2565–2573 [PubMed] [Google Scholar]
- Sun Y., Durrin L.K., Krontiris T.G. 2003. Specific interaction of PML bodies with the TP53 locus in Jurkat interphase nuclei. Genomics. 82:250–252 10.1016/S0888-7543(03)00075-2 [DOI] [PubMed] [Google Scholar]
- Townson S.M., Kang K., Lee A.V., Oesterreich S. 2006. Novel role of the RET finger protein in estrogen receptor-mediated transcription in MCF-7 cells. Biochem. Biophys. Res. Commun. 349:540–548 10.1016/j.bbrc.2006.08.063 [DOI] [PMC free article] [PubMed] [Google Scholar]
- Trask B., Pinkel D., van den Engh G. 1989. The proximity of DNA sequences in interphase cell nuclei is correlated to genomic distance and permits ordering of cosmids spanning 250 kilobase pairs. Genomics. 5:710–717 10.1016/0888-7543(89)90112-2 [DOI] [PubMed] [Google Scholar]
- Wang J., Shiels C., Sasieni P., Wu P.J., Islam S.A., Freemont P.S., Sheer D. 2004. Promyelocytic leukemia nuclear bodies associate with transcriptionally active genomic regions. J. Cell Biol. 164:515–526 10.1083/jcb.200305142 [DOI] [PMC free article] [PubMed] [Google Scholar]
- Yeager T.R., Neumann A.A., Englezou A., Huschtscha L.I., Noble J.R., Reddel R.R. 1999. Telomerase-negative immortalized human cells contain a novel type of promyelocytic leukemia (PML) body. Cancer Res. 59:4175–4179 [PubMed] [Google Scholar]
- Yokota H., van den Engh G., Hearst J.E., Sachs R.K., Trask B.J. 1995. Evidence for the organization of chromatin in megabase pair-sized loops arranged along a random walk path in the human G0/G1 interphase nucleus. J. Cell Biol. 130:1239–1249 10.1083/jcb.130.6.1239 [DOI] [PMC free article] [PubMed] [Google Scholar]
Associated Data
This section collects any data citations, data availability statements, or supplementary materials included in this article.