

Abstract
Interstitial fluid flow within blood clots is a biophysical mechanism that regulates clot growth and dissolution. Assuming that a clot can be modeled as a porous medium, the physical property that dictates interstitial fluid flow is the hydraulic permeability. The objective of this study was to bound the possible values of the hydraulic permeability in clots formed in vivo and present relationships that can be used to estimate clot permeability as a function of composition. A series of clots with known densities of fibrin and platelets, the two major components of a clot, were formed under static conditions. The permeability was calculated by measuring the interstitial fluid velocity through the clots at a constant pressure gradient. Fibrin gels formed with a fiber volume fraction of 0.02–0.54 had permeabilities of 1.2 × 10⁻¹–1.5 × 10⁻⁴μm2. Platelet-rich clots with a platelet volume fraction of 0.01–0.61 and a fibrin volume fraction of 0.03 had permeabilities over a range of 1.1 × 10⁻²–1.5 × 10⁻⁵μm2. The permeability of fibrin gels and of clots with platelet volume fraction of <0.2 were modeled as an array of disordered cylinders with uniform diameters. Clots with a platelet volume fraction of >0.2 were modeled as a Brinkman medium of coarse solids (platelets) embedded in a mesh of fine fibers (fibrin). Our data suggest that the permeability of clots formed in vivo can vary by up to five orders of magnitude, with pore sizes that range from 4 to 350 nm. These findings have important implications for the transport of coagulation zymogens/enzymes in the interstitial spaces during clot formation, as well as the design of fibrinolytic drug delivery strategies.
Introduction
Interstitial fluid flow through the extracellular space is an important phenomenon in the homeostasis, development, and pathology of tissues (1). Interstitial flows have been used to distribute drugs and drug delivery systems by either exploiting endogenous flows (2) or inducing flow by local infusion into a targeted tissue (3,4). Blood clots are a tissue where interstitial flows exist owing to the pressure gradient created by flowing blood along the periphery of a clot. There is growing evidence that interstitial fluid and solute transport plays an important role in the growth, arrest, and dissolution of blood clots (5,6). However, there are few measurements of the constitutive properties in clots that regulate interstitial transport. One of those properties is the permeability.
The permeability of a porous medium can be calculated from Darcy’s law,
| (1) |
where v is the interstitial fluid velocity, k is the permeability, μ is the viscosity of the percolating fluid, and P is the pressure. The permeability is a function of the volume fraction of solids, pore size, and fiber or cell/cell aggregate size. A blood clot, like most tissues, is a material that has both fibrous and granular structures. We define fibrous structures as those defined by proteins and carbohydrates in the extracellular space and granular structures as those defined by cells. Fibrin fibers that form between and around platelets give the clot a fibrous structure. Platelets and platelet aggregates give the clot a granular structure. The relative density of these two components—fibrin and platelets—dictates the interstitial fluid transport. The objective of this study is to measure and model the hydraulic permeability of clots as a function of platelet and fibrin density.
The hydraulic permeability of pure fibrin gels has been extensively measured dating back to the seminal studies in the 1970s by Roberts et al. (7) and Rosser et al. (8). To date, most reports of fibrin gel permeability have been measured at or near plasma fibrinogen concentrations (∼3 mg/mL) (9). These permeability measurements are typically used to determine how biochemical conditions affect fibrin polymerization. For example, for a given fibrinogen concentration, fibrin gels formed at higher thrombin concentrations consist of densely packed thin fibers compared to gels formed at low thrombin concentrations (9). Permeability has also been used as a measure of how a drug or certain disorders affect fibrin polymerization. Consumption of low doses of acetylsalicylic acid results in a 44% increase in fibrin permeability (10). Fibrin clots made from the plasma of individuals after ischemic stroke have lower permeability than healthy controls (11).
There are few direct measurements of the permeability of clots with significant cellular volume fractions. The volume fraction of platelets in clots formed from platelet-rich plasma is ∼0.005, too small to significantly influence the permeability. Yet, the histology of clots retrieved from humans with atrial fibrillation and stroke suggest that platelets make up 20–80% of the solid volume (12,13). Furthermore, the density of fibrin is likely much higher in clots than in gels formed at plasma concentration of fibrinogen. A recent electron microscopy study of aspirated clots from myocardial infarction patients found an average fibrin solids volume fraction of 56% (14).
In this study, we measured how the volume fraction of fibrin and platelets affects fluid transport within the interstitial spaces of clots. The focus here is on platelet-rich clots that are characteristic of the initial stages of hemostatic and thrombotic clots. Our approach was to induce clotting with thrombin in suspension with known fibrin and platelet densities, and then measure the permeation of a buffer solution through the clots at defined pressure gradients. Clots were treated as porous media where the average interstitial fluid velocity at the macroscopic scale was governed by Darcy’s law. We measured the permeability of fibrin gels with a fiber volume fraction of 0.02–0.54 and platelet-rich clots (PRC) with a platelet volume fraction of 0.01–0.61. Measured permeability values were compared to models of fibrous, granular, and mixed porous media to delineate the relative contributions of each component to the overall hydrodynamic resistance. These data bound the magnitude of clot permeability and can be used for predicting clot growth and dissolution.
Materials and Methods
Materials
Human fibrinogen (free of plasminogen, von Willebrand factor, and fibronectin) in 20 mM sodium citrate, human α-thrombin, and bovine α-thrombin were purchased from Enzyme Research Laboratories (South Bend, IN). Centrifuge filtration units with a 50-kDa molecular mass cutoff were purchased from Millipore (Billerica, MA). Citrated bovine whole blood was purchased from Hemostat Laboratories (Dixon, CA). Trizma buffer, calcium chloride, sodium chloride, and HMDS (hexamethlydisilazane) were purchased from Sigma-Aldrich (St. Louis, MO). Tris-buffered saline (TBS: 50 mM Tris, 100 mM NaCl) was made in-house at pH 7.4. The AlexaFluor 488 labeling kit and DiOC6 (3,3′-dihexyloxacarbocyanine iodide) fluorescent dye were purchased from Molecular Probes (Grand Island, NY).
Fibrinogen solution
Fibrinogen stock solutions (14.2 mg/mL) in sodium citrate were concentrated to 130–160 mg/mL by centrifuge filtration. Two milliliters of the stock solution were centrifuged at 2200 x g for 10 h. After centrifugation, the retentate was removed from the device and diluted for permeability measurements. A modified Clauss assay was performed to determine the fibrinogen concentration of the retentate (15). Briefly, 10 nM thrombin and 2.5 mM CaCl2 was added to the diluted (100:1 in TBS) retentate fibrinogen solution into a well of a 96-well plate (200 μL final volume). After 20 min, the absorbance was measured in a plate reader (Victor X; PerkinElmer, Waltham, MA) and the concentration was calculated by comparing the absorbance to a standard curve.
Fibrin gel preparation
Permeation chambers were created by removing the top of the barrel of 3 mL plastic syringes (Cat. No. 309585; BD Biosciences, Franklin Lakes, NJ) and sealing the adaptor of the syringe with a PDMS (polydimethlysiloxane) cork. Before forming a fibrin gel, 1.1 mL of a 3 mg/mL fibrinogen solution was incubated in the permeation chamber for 1 h and then rinsed with deionized water and dried with an airbrush. The adsorbed fibrinogen was necessary to provide an adhesive surface for the fibrin gels. Next, the fibrinogen solution used for gelation was added to the permeation chamber and 1 M CaCl2 was added to a final concentration of 2.5 mM CaCl2. Finally, 200 nM human α-thrombin was added and quickly mixed with a Pasteur pipette to yield a final concentration of 10 nM thrombin. The chamber was then sealed with parafilm and allowed to gel for 24 h.
Platelet-rich clot preparation
Platelets were isolated from citrated bovine whole blood in a three-step process:
Step 1. Whole blood was centrifuged at 40 x g for 2 h resulting in an erythrocyte-rich bottom fraction and a platelet-rich plasma (PRP) top fraction.
Step 2. The platelet-rich plasma was pipetted off the top and then centrifuged at 2200g for 20 min. This step resulted in a platelet plug at the bottom of the centrifuge tube and platelet-poor plasma (PPP) in the supernatant.
Step 3. The platelet plug was resuspended in the PPP to the desired cell count. The PPP from Step 2 was added to the erythrocyte-rich bottom fraction from Step 1, and the two-step centrifugation process was repeated again to extract the maximum number of platelets.
From 1 L of whole blood, we recovered 2–4 mL of packed platelets. Packed platelets were diluted in plasma and the cell density was measured using a hemocytometer (model No. DHC-N01; Neubauer Incyto, Chonan, South Korea). Once diluted to the desired platelet density, 500 μL of the resuspended platelets were transferred to the 3-mL permeation chambers and recalcified to 20 mM CaCl2. Clot formation was induced with 10 nM bovine α-thrombin. Clots were allowed to form for 24 h to ensure complete conversion of fibrinogen to fibrin.
Hydraulic permeability measurements
After removal of the PDMS plug and the parafilm seal, a reservoir containing TBS was connected to the top of the permeation chamber (see Fig. S1 in the Supporting Material). Small diameter silastic tubing (0.76 mm ID; Dow Corning, Midland, MI) was connected to the bottom of the chamber via a blunt 16-gauge needle. The volumetric flow rate of buffer through the fibrin gel or platelet-rich clot was calculated by tracking the velocity of the air-buffer interface in the tubing. The volumetric flow rate of the TBS was measured at 3–5 pressure gradients for 5 min. The large volume of the TBS reservoir ensured that the pressure gradient was constant over the course of the measurements. Measurements at different pressure gradients were taken in random order. We used a pressure gradient that was adequate to provide a measurable flow rate (1–10 μL/min) but did not possess enough force to rupture the gel. The flow through the clot was visualized by adding a food dye to the permeation buffer in a 1000:1 dilution. Ruptures or detachments from the wall were identified by fingers of dye protruding into the gel/clot.
Scanning electron microscope measurements of fiber diameter
Gel samples were prepared for scanning electron microscopy (SEM) by forming gels (3–156 mg/mL, 2.5 mM CaCl2, 105 mM NaCl, 100 nM thrombin) in a Slide-A-Lyzer mini dialysis device (Cat. No. 69560; ThermoScientific, Rockford, IL). After gelation, the clots were fixed in 2.5% glutaraldehyde for 30 min. Next, the dialysis device was immersed in the following series of solutions for 10 min each to dehydrate the samples: Deionized water in triplicate, 50%, 70%, 80%, 90%, 100%; and 100% ethanol in DI water, 33%, 67%, 100%, and 100% HMDS in ethanol. After the final HMDS treatment the clot was removed from the dialysis device and air-dried before being sputter-coated with ∼10 nm of gold. SEM images were taken at an accelerating voltage of 1.5 kV and 6-mm working distance. IMAGEJ software (National Institutes of Health, Bethesda, MD) was used to manually measure the ∼100 fiber diameters for each condition.
Confocal microscopy of fibrin gels and platelet-fibrin thrombi
Fibrin gels and PRC for confocal microscopy were prepared exactly as described above, except rather than forming the samples in a permeation chamber, the samples were formed between glass slide and glass coverslip. For fibrin gels, a fluorescently labeled fibrinogen (AlexaFluor 555) was added to each solution at a molar ratio of 1000:1 unlabeled/labeled fibrinogen. For PRC, platelets were labeled with DiOC6 (10 μM) and fluorescently labeled fibrinogen was added at a molar ratio of 250:1 unlabeled:labeled fibrinogen. Images were captured on a laser scanning confocal microscope (Fluoview FV10i; Olympus, Melville, NY) using a 60× objective (NA = 1.2) and excitation/emission wavelengths of 556/573 nm and 495/521 nm for the AlexaFluor555 and DiOC6, respectively. Grayscale images were made binary in the software IMAGEJ by subtracting the background using the Sternberg rolling-ball method with a rolling-ball radius that was at least five times larger than the largest group of platelets (∼100 μm for higher platelet concentrations, ∼10 μm for the 50× and below). After background subtraction, a threshold value of 5 was applied to all images and the platelet volume fraction was calculated from binary images. The average area and diameter of platelet aggregates was also calculated from the binary images. Each step in the image analysis procedure is depicted in Fig. S2.
Statistical analysis
A line was fit to the plot of the normalized flow rate (μQ/A) as function of the pressure gradient (ΔP/L) using the MATLAB software routine Robustfit (The MathWorks, Natick, MA), which uses iteratively reweighted least-squares with a bisquare weight function. The slope of that line was reported as the permeability according to Darcy’s law (see Eq. 1). The uncertainly in the permeability is reported as the standard error (SE) of the fit. All other data are presented as the mean ± standard deviation (SD). A weighted sum least-squares parameter was used to compare model predictions of permeability to experimental data. The weighted residual was defined as
| (2) |
where FEi is the fractional error of the ith component, ki is the ith measured permeability, and is the theoretical permeability. The sum of squares of the fractional error is used to determine the goodness of fit parameter (χ2):
| (3) |
Theory
Permeability of fibrin gels
Numerous analytical, computational, and empirical relationships have been developed to predict the permeability of fibrous media (16–23). Most of these relationships have the general form of
| (4) |
where kf is the permeability, af is the fiber radius, and ϕf is the fiber volume fraction. In this study, we compare our experimental measurements of permeability for fibrin gels with three models. The first model is the Davies’ equation, which is an empirical relationship based on air flow through fibrous media at low Reynolds numbers (24):
| (5) |
Equation 5 has been commonly used to estimate the permeability of fibrin gels and blood clots (9,25–27). The second model by Jackson and James (18) is the weighted average of the solution to the Stokes equation for flow parallel to or normal to two-dimensional periodic square arrays of cylinders:
| (6) |
The third model comes from Clague et al. (28), who used the lattice Boltzmann (LB) method to calculate the permeability of random fibrous media. We used Eq. 14 from Clague et al. (28), which is their solution for an array of disordered fibers:
| (7) |
Equation 7 gives the appropriate scaling of the permeability over a wide range of fiber volume fraction (0.05–0.7). To compare these three models to our experimental data, it is necessary to estimate the fiber volume fraction, ϕf, of the fibrin gels and the fiber radius, af, as a function as fibrinogen concentration, cFbg. The fiber volume fraction was calculated using a mass balance where we assumed that all the fibrinogen was incorporated into a fiber and that each individual fiber consists of an internal solid fraction, Φint, and water fraction, 1-Φint. The internal solid fraction, Φint, was estimated from neutron scattering data collected from fibrin gels formed at fibrinogen concentrations of 1–40 mg/mL (29). A fit of the data from Fig. 5 in Weigandt et al. (29) gives
| (8) |
where cFbg is in mg/mL. We extrapolated Eq. 8 out to 155 mg/mL because, to the best of our knowledge, there is no data on the internal solid fraction beyond 40 mg/mL. It is possible that, at higher fibrinogen concentrations, this trend may not hold; but given the weak dependence of internal solid fraction on fibrinogen concentration, any deviations should be small.
Figure 5.
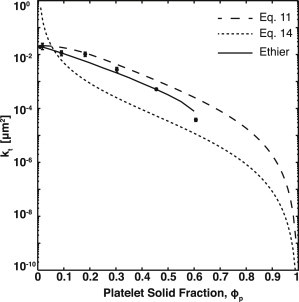
Comparison of platelet-rich clot permeability to mixed porous media models. The experimentally measured permeability, kt, of platelet-rich clots (●) compared with the resistor-in-parallel model, Eq. 11 (— —); the fractional packing model (- -), Eq. 14; and Ethier’s solution for kf/acoarse2 = 1 (—). Error bars represent SDs.
The overall fiber volume fraction (ϕf) is calculated by
| (9) |
The mass density of an individual fibrinogen protein (ρm) is 1.4 g/mL (30).
The dehydrated fiber radius was determined by analysis of SEM images as described in the Materials and Methods. The hydrated fiber radius (af) was calculated by
| (10) |
where ad is the dehydrated radius. We assume that there is no void space in the dehydrated fibers.
Permeability of platelet-rich clots
In platelet-rich clots, viscous losses on the platelet surface will contribute to the overall hydrodynamic resistance through the clot in conjunction with losses on fibrin fibers. Platelets also increase the superficial velocity within the fibrin gel and increase the tortuosity. Platelet-rich clots have elements of both granular (platelets) and fibrous (fibrin) media. Similar to the treatment of fibrin gels described above, we compared our experimental data to three models that account for this type of mixed porous media.
In the first model, we treat the granular and fibrous media components as independent hydraulic resistances and add their contributions in parallel as an unweighted resistivity,
| (11) |
where kt is the overall permeability, kp is the permeability of the platelets, and kf is the permeability of the fibrin. We refer to Eq. 11 as the resistors-in-parallel model. An unweighted resistivity was found to be the most accurate method of averaging permeabilities in bimodal mixtures of fibers of different radii (23). We measured kf directly from bovine platelet-poor plasma. We estimate kp using the Kozeny-Carmen equation for packed beds (31),
| (12) |
where Ψ is the sphericity, ϕp is the platelet volume fraction, and ap is the platelet radius. The diameter of a bovine platelet is ∼1 μm. Sphericity was calculated by assuming platelets are flat cylinders with a diameter of 1 μm and a height of 100 nm,
| (13) |
where Vp is the platelet volume and Ap is the platelet surface area.
The second model we considered was the fractional packing model, which was developed to describe porous media with a mixture of coarse and fine grains (32). In the fractional packing model, a volume-weighted fiber radius and volume fraction are used to modify the Kozeny-Carmen equation
| (14) |
| (15) |
where kt is the total permeability, ϕt is the total volume fraction of solids, Ψ is the sphericity, and ac is the effective characteristic length.
The third model we considered was developed by Ethier (33), and considers a two-component fibrous medium with highly dissimilar fiber radii. This model is particularly relevant for blood clots because the radius of fibrin fibers (50–100 nm) is much smaller than the size of single platelet (1 μm). In the model, flow through the media is described using the higher-order Brinkman equation rather than Darcy’s law,
| (16) |
where μ is the fluid viscosity, v is the fluid velocity, kf is the fibrin permeability, and P is the pressure. In the Ethier model, the composite medium can be thought of as a matrix of fine fibers embedded with large solid inclusions. The no-slip boundary condition on these large inclusions is satisfied by the Laplacian term in Eq. 16. Experimental measurements of permeability of PRC were compared to the unit-cell matching in Fig. 3b of Ethier (33). Note that Eq. 16 is only applicable at length scales where the pressure gradient is balanced by the Laplacian of the velocity. This length is often referred to as the Brinkman screening length, and is equal to the square-root of the permeability, kf.
Figure 3.
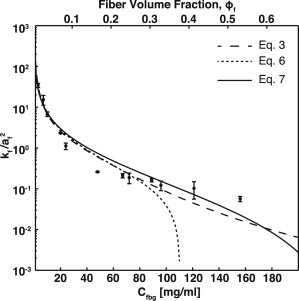
Comparison of fibrin gel permeability to fibrous media models. The experimentally measured dimensionless permeability (kf/af2) of fibrin gels (●) compared with the Davies’ equation, Eq. 3 (— —); Jackson and James (- -), Eq. 6; and lattice Boltzmann simulation results, Eq. 7 (—). Error bars represent SDs.
In all three of the mixed porous media models described above, the void fraction of the clot, ε, was calculated by
| (17) |
where ε is the void fraction of the clot, and ϕp and ϕf are the volume fractions of the platelets and fibers, respectively. The platelet volume fraction was estimated based on calculations of the maximum packing of circular disks and verified by image analysis of confocal images of PRC as described in the Materials and Methods. The volume fraction of the fibers was calculated using Eq. 9.
Results
Permeability of fibrin gels
Fibrin gels were made from 3–156 mg/mL fibrinogen solutions with 10 nM thrombin (Table 1). The permeability of each gel was calculated using Darcy’s law (see Eq. 1). Measurements were made for at least three pressure gradients for each fibrinogen concentration. It was necessary to increase the magnitude of the pressure gradient concomitantly with fibrinogen concentration to achieve flow rates that could be measured over a reasonable time (Table 1). Experiments were conducted with food dye added to the permeation buffer to visualize the permeation front. For each gel, we measured the failure pressure, which was defined as the pressure at which the gel either breaks apart or tears away from the tube wall. These failure events were clearly visible due to uneven distribution of the dye. For permeability measurement experiments, the maximum pressure for each gel was 40–60% of the failure pressure. The flow rate for each gel was measured at three pressures. The calculated permeability was independent of pressure over the range used in these measurements.
Table 1.
Permeability of fibrin gels
| ϕf | cFbg (mg/mL) | Hydrated radius af (nm) | ΔP/L (Pa/m) | kf (SE) (× 103μm2) | Effective screening length (nm) |
|---|---|---|---|---|---|
| 0.02 | 3 | 60 | 3 × 10⁴–1 × 10⁵ | 120 (15) | 346 |
| 0.03 | 7 | 58 | 8 × 10⁴–1 × 10⁵ | 52 (14) | 228 |
| 0.04 | 10 | 57 | 7 × 10⁴–1 × 10⁵ | 22 (3) | 148 |
| 0.08 | 20 | 55 | 8 × 10⁴–5 × 10⁵ | 7.0 (0.2) | 84 |
| 0.10 | 24 | 55 | 3 × 10⁵–7 × 10⁵ | 3.4 (0.6) | 58 |
| 0.18 | 48 | 53 | 4 × 10⁵–2 × 10⁶ | 0.73 (0.02) | 27 |
| 0.25 | 67 | 52 | 4 × 10⁵–2 × 10⁶ | 0.57 (0.07) | 24 |
| 0.27 | 72 | 52 | 7 × 10⁵–2 × 10⁶ | 0.51 (0.15) | 23 |
| 0.32 | 89 | 52 | 4 × 10⁵–2 × 10⁶ | 0.44 (0.04) | 21 |
| 0.35 | 96 | 52 | 8 × 10⁵–2 × 10⁶ | 0.33 (0.09) | 18 |
| 0.43 | 121 | 51 | 8 × 10⁵–2 × 10⁶ | 0.27 (0.12) | 16 |
| 0.54 | 156 | 51 | 8 × 10⁵–3 × 10⁶ | 0.15 (0.02) | 12 |
Fibrin gels were made from fibrinogen solutions using 10 nM thrombin and 2.5 mM CaCl2. Fiber volume fractions, ϕf, were calculated from Eq. 9. The hydrated fiber radius, af, was calculated from Eq. 10 using a dehydrated fiber radius of 23 nm. Flow was induced through the fibrin gels by pressure gradients that range from ΔP/L (Pa/m)min to ΔP/L (Pa/m)max. The permeability is reported as a fit to Eq. 1 with uncertainty estimated by the SE of the fit. The effective screening length is the square-root of the measured permeability.
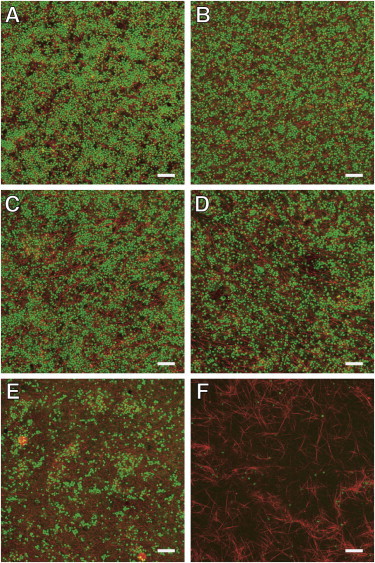
An increase in fiber volume fraction with increasing fibrinogen concentration was observed by confocal microscopy (Fig. 1). Gels made of 3–10 mg/mL fibrinogen consist of fibers spaced as far apart as ∼10 μm within a given plane. The effective hydrodynamic screening length for these gels, estimated as the square-root of the permeability, is 148–346 nm (Table 1). Gels of 20–24 mg/mL fibrinogen consist of a dense mat of fibers with fibers spaced as far apart as ∼1 μm within a given optical plane. These gels have an effective hydrodynamic screening length of 58–83 nm. Gels of 67 mg/mL and greater have no discernible porous structure at the resolution of the microscope and have an effective hydrodynamic screening length of 27 nm or less. The fiber volume fraction ranges from 0.02 (3 mg/mL) to 0.54 (156 mg/mL), as calculated by Eq. 8.
Figure 1.
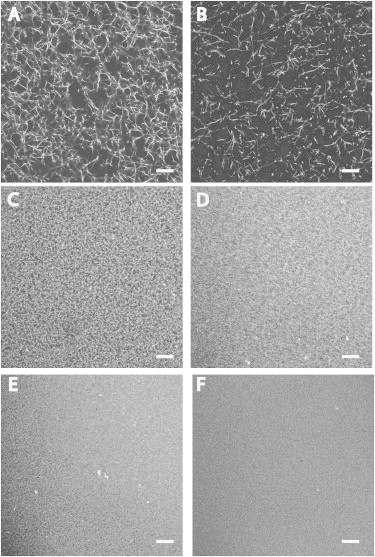
Fibrin gel morphology as a function of fibrin density. Fibrin gels were made at various fibrinogen concentrations using 10 nM thrombin and imaged by confocal microscopy. Gels consisted of unlabeled fibrinogen and fluorescent-labeled fibrinogen at a ratio 1000:1 unlabeled/labeled. Final fibrinogen concentration of gels: (A) 3 mg/mL; (B) 10 mg/mL; (C) 20 mg/mL; (D) 40 mg/mL; (E) 60 mg/mL; and (F) 100 mg/mL. Scale bar = 20 μm.
Dehydrated fiber radii were measured by SEM and were found to be relatively insensitive to fibrinogen concentration (Fig. 2). For example, the average fiber radius at 7 mg/mL fibrinogen was 21 ± 6 nm and the average fiber radius at 72 mg/mL was 24 ± 8 nm. Based on these measured values, we used 23 nm as an average dehydrated fiber radius for all fibrinogen concentrations. The hydrated average fiber radius (af) was calculated using Eq. 10 (Table 1). The hydrated fiber radius for each fibrinogen concentration was used for permeability calculations using the models described by Eqs. 5–7.
Figure 2.
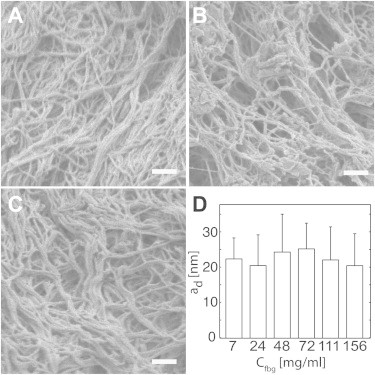
Fibrin fiber diameter as a function of fibrinogen concentration. Scanning electron micrographs were taken of fibrin gels as various fibrinogen concentrations to enable the measurement of fiber radius, ad: (A) 7 mg/mL; (B) 48 mg/mL; (C) 156 mg/mL; and (D) measured dehydrated radii of fibrin fibers. Scale bar = 500 nm.
The permeability of fibrin gels spans three orders of magnitude over a fiber volume fraction range of 0.02–0.54 (Table 1). The permeability was most sensitive to volume fraction over the range 0.02–0.18, which corresponded to permeabilities of 1.2 × 10⁻¹ μm2 to 7.3 × 10⁻⁴ μm2. Over the volume fraction range of 0.18–0.54 the change in permeability was more modest, varying from 7.3 × 10⁻⁴ to 1.5 × 10⁻⁴ μm2. These observations are in agreement with models of fibrous media that show a linear sensitivity to volume fraction over the range of 0–0.05 compared to ln(ϕf)/ϕf sensitivity to volume fraction over the range of 0.05–0.6 (19).
The measured dimensionless permeability (kf/af2) of fibrin gels was compared to predictions from three models of three-dimensional disordered fibrous media: the semiempirical Davies equation (see Eq. 5); the Jackson and James expression which is a weighted average of analytical solutions for flow parallel and perpendicular to an array of cylinders (see Eq. 6); and LB simulations for flow through disordered fibers (see Eq. 7). Equations 6 and 7 are solutions to Stokes’ flow past arrays of periodic or randomly oriented cylinders, respectively. In the semidilute limit (ϕf < 0.2), all three models are in good agreement with the measured permeabilities (Fig. 3). The Jackson and James model asymptotically approaches zero as the volume fraction approaches 0.4. Both the Davies equation and LB simulations are in good agreement with experimental values over the entire range of volume fractions with χ2 values of 15 and 5, respectively. Based on these comparisons, we conclude that fibrin gels over a fiber volume fraction of 0.02–0.54 are well described by models of disordered cylinders with uniform diameters.
Permeability of platelet-rich clots
Platelet-rich clots (PRC) were formed by adding 10 nM thrombin to platelet suspensions in plasma with cell densities of 7 × 10⁵/μL to 5 × 10⁷/μL. There was no visual evidence of platelet aggregation during the preparation of PRC before the addition of thrombin. The platelet volume fraction range was estimated based on analysis confocal microscopy images (Fig. 4) and spanned the range of 0.01–0.61 (Table 2). The permeability of PRC decreased by three orders of magnitude over this range of platelet volume fraction. The permeability of bovine plasma clotted with 10 nM thrombin in the absence of any platelets was 1.2 × 10⁻² ± 0.6 × 10⁻² μm2. We did not observe a contribution of the platelets to the permeability for platelet volume fractions of <0.19 (Table 2). At a platelet volume fraction of 0.19–0.31, we observed a modest contribution of the platelets to permeability with ∼50% decrease compared to a pure fibrin gel. At higher platelet volume fractions (>0.31) the contribution of the platelets begins to dominate the overall hydraulic resistance. The permeability of a PRC with a platelet volume fraction of 0.37 was an order-of-magnitude less than that of a pure fibrin gel, decreasing from 1.5 × 10⁻² μm2 to 1.1 ×10⁻³ μm2.
Figure 4.
Platelet-rich clots morphology as function of platelet density. Platelet-rich clots were made with platelets diluted into platelet-poor plasma containing labeled fibrinogen and imaged by confocal microscopy. Clotting was induced with 10 nM thrombin. The volume fraction of platelets, ϕp, for each panel is (A) 0.61; (B) 0.45; (C) 0.31; (D) 0.19; (E) 0.05; and (F) 0.01. Scale bar = 20 μm.
Table 2.
Permeability of platelet-rich clots
| Measured platelet volume fraction ϕp (SD) | Platelets density (platelets/μL) | ap (μm) (SD) | ΔP/L (Pa/m) | kt (SE) (× 103μm2) | Effective screening length (nm) |
|---|---|---|---|---|---|
| 0.01 (0.004) | 7 × 10⁵ | 1 (0.2) | 3 × 10⁴–8 × 10⁴ | 11 (0.98) | 105 |
| 0.05 (0.01) | 1 × 10⁶ | 1 (0.3) | 3 × 10⁴–8 × 10⁴ | 12 (0.96) | 110 |
| 0.19 (0.02) | 7 × 10⁶ | 4 (4) | 3 × 10⁴–8 × 10⁴ | 6.7 (0.83) | 82 |
| 0.31 (0.04) | 1 × 10⁷ | 8 (3) | 3 × 10⁴–8 × 10⁴ | 6.1 (0.69) | 78 |
| 0.37 (0.05) | 2 × 10⁷ | 16 (5) | 6 × 10⁴–2 × 10⁵ | 1.1 (0.53) | 33 |
| 0.45 (0.02) | 4 × 10⁷ | 17 (6) | 1 × 10⁵–4 × 10⁵ | 0.20 (0.020) | 14 |
| 0.61 (0.06) | 5 × 10⁷ | 26 (6) | 1 × 10⁵–2 × 10⁶ | 0.015 (0.0019) | 4 |
Platelet- rich clots (PRC) were made from solutions of platelets diluted into platelet-poor plasma and clotted with 10 nM thrombin in the presence of 2.5 mM CaCl2. Platelet volume fractions, ϕp, were calculated from confocal microscopy images. Flow was induced through the thrombi by pressure gradients that range from ΔP/L (Pa/m)min to ΔP/L (Pa/m)max. The radii of platelets and platelet aggregates, ap, were estimated from confocal microscopy images of PRC. The permeability, kt, is reported as a fit to Eq. 1 with uncertainty estimated by the SE of the fit. The effective screening length is the square-root of kt.
We compared experimental results to three mixed porous media models: a resistors-in-parallel model (see Eq. 11), a fractional packing model (see Eq. 14), and Ethier’s numerical calculations of the Brinkman equation for fibrous media with two dissimilar radii (Fig. 5). The resistors-in-parallel model treats the PRC as two independent and noninteracting media—a fibrous medium defined by fibrin and a granular medium defined by platelets where the overall permeability is calculated by adding the resistances of each medium in parallel. We used the measured permeability of a fibrin gel from bovine plasma and estimated the platelet permeability using the Kozeny-Carmen equation (see Eq. 12). The resistors-in-parallel model provides a good estimate of the permeability over most of the range of platelet volume fractions but begins to deviate as the platelet volume fraction increases beyond 0.3. The χ2 for this model is 0.95.
The fractional packing model assumes that the PRC can be treated as homogeneous porous medium based on a volume-weighted volume fraction and a characteristic radius. A characteristic radius of 214 nm was calculated by taking the harmonic mean of the diameter of a fiber and the diameter of platelet. We calculated the characteristic radius based on the size of platelet aggregates (Table 2) as well, but there was no appreciable difference between these values and those based on a single platelet. The permeability was then estimated using the Kozeny-Carmen equation (see Eq. 14). The fractional packing model predicts that the permeability is much lower than the measured values over nearly the entire range of platelet volume fractions. At low platelet volume fraction (<0.1), the model overestimates the permeability as the PRC approaches a pure fibrin gel. Consequently, the fractional packing model is a poor fit with χ2 = 500. This suggests that PRC cannot be reduced to a porous medium with a single characteristic length scale over a large range of platelet volume fractions.
Comparison of the data with the Ethier model shows that a PRC is well described as a Brinkman medium. The best fit of Ethier’s calculation to the experimental data occurs when kf/acoarse2 is close to unity (see Fig. S3), where acoarse is the radius of the coarse media (platelet aggregates). The χ2 value for this model equals 0.82. The calculated value of kf/acoarse2 is ∼0.01, based on the permeability of bovine plasma and the size of single platelet. This discrepancy suggests that kf may be larger in a PRC than in a fibrin gel in the absence of platelets. One explanation for a higher permeability is that some of the fibrinogen or fibrin monomers are bound to αIIbβ3 receptor on activated platelets, and thus are not available for polymerization into fibers. There are ∼80,000 αIIbβ3 receptors per platelet (34). At a platelet density of 107/μL, the ratio of αIIbβ3 receptors to fibrinogen molecules is roughly 1:1, so the probability that a significant fraction of fibrin(ogen) is bound to platelet surfaces seems feasible. Comparison of confocal images of fibrin in the presence and absence of platelets confirms that platelets affect fibrin polymerization (see Fig. S4). Fibers in the presence of platelets appear much shorter than in platelet-poor plasma.
Because the Ethier model incorporates the volume fraction of fibrin and platelets as independent parameters, we can use these solutions to predict the total permeability of a clot based on the volume fractions of each component. Fig. 6 shows the predicted permeability of a clot as a function of platelet volume fraction at constant fibrin volume fractions. The fibrin permeability, kf, was calculated using Eq. 7 because this gave the best fit to the experimental data. The measured platelet aggregate diameter, acoarse, was used to determine the appropriate value for kf/acoarse2. The total permeability, kt, was then estimated from Fig. S3.
Figure 6.
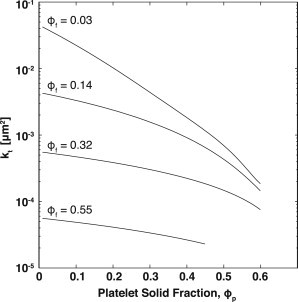
Estimated permeability of blood clots as a function of platelet and fibrin volume fractions. The permeability of a blood clot was calculated using a combination of Ethier’s solution to the Brinkman equation (see Fig. S3) and Clague’s solution for random fibrous media (Eq. 7). (Line) Total permeability, kt, at constant fibrin volume fraction, ϕf, as a function of platelet volume fraction, ϕp.
The transition from a fibrin-rich medium described by an array of uniform cylinders to a platelet-rich medium described by Brinkman’s equation accounts for viscous losses on the surface of platelets. The criteria under which these viscous losses become significant can be estimated by considering the simple scenario of unidirectional flow through a fibrin gel between two parallel plates that represent two platelets spaced a distance h apart (see the Supporting Material for derivation and Truskey et al. (35)). Assuming the flow is described by Eq. 16, the total permeability is
| (18) |
The first term in Eq. 18 represents Darcy’s law and the second term is the Brinkman correction. Note that as , the total permeability approaches the fibrin permeability and Darcy’s law describes interstitial flow in the space between the two plates. The effect of the platelets on the interstitial velocity is only significant for < 0.05. Thus, as the fibrin volume fraction increases the total permeability becomes less sensitive to platelet volume fraction. This is shown in Fig. 6 when comparing low and high fibrin volume fractions. For the case of ϕf = 0.03, the permeability of a clot will decrease by greater than two orders of magnitude because ϕp ranges from 0.01 to 0.6. For the case of ϕf = 0.55, the permeability of a clot will decrease only threefold because ϕp ranges from 0.01 to 0.45.
Viscous losses alone do not account for the effect of the addition of platelets into a fibrin gel. Note that we begin to observe decrease in the permeability at a ϕp = 0.19 (Table 2). The effective screening length of bovine plasma is 109 nm, which—based on the argument presented above—suggests that platelets need to be ∼2.2 μm apart to influence the permeability. However, inspection of PRC images at ϕp = 0.19 (Fig. 4 D) show that gaps of ∼10 μm exist between platelets. The influence of platelets at lower volume fractions than predicted by Eq. 18 is a result of an increase in tortuosity and an increase in superficial velocity within the fibrin gel. In the limit of low fibrin permeability or large platelet aggregates (kf/acoarse2 → 0), Ethier’s solution to the Brinkman equation reduces to
| (19) |
The numerator represents the area obstruction by platelets and platelet aggregates, and leads to an increase in superficial velocity in the fibrin gel. The denominator represents the increase in the tortuosity of the fluid path due to the platelets and platelet aggregates. Equation 19 correctly predicts the influence of platelets over the range of ϕp from 0.01 to 0.31. For example, at ϕp = 0.19, Eq. 19 predicts a permeability of 8.0 × 10⁻³ μm2, which is close to the measured value of 6.7 × 10⁻³ μm2. At ϕp ≥ 0.37, Eq. 19 overestimates the permeability, suggesting that viscous losses begin to play a role at these higher platelet volume fractions.
Discussion
The objective of this study was to measure the permeability of fibrin gels and platelet-rich clots over a wide range of fibrin and platelet densities. Fibrin gels were formed using a range of fiber volume fractions of 0.02–0.54, resulting in permeabilities of 0.12–1.5 × 10⁻⁴ μm2. PRCs were formed in plasma (∼7 mg/mL fibrinogen) at platelet volume fractions of 0.01–0.61, resulting in permeabilities of 1.1 × 10⁻²–1.5 × 10⁻⁵ μm2. These data suggest that the interstitial flow within clots will vary widely depending on their structure. Fibrin gels were well described as a Darcy medium consisting of disordered fibers with uniform diameters. PRCs were best described as a Brinkman medium of platelets embedded in a fibrin gel.
Permeability measurements of fibrin gels at low fibrinogen concentration (3–10 mg/mL) in this study are in good agreement (within 25%) of previously reported values (9). The volume fraction of fibers in gels made at plasma fibrinogen concentrations is <0.05. However, analysis of retracted clots from humans suggests that fibrin can make up a large fraction of the solids in arterial clots. For example, the solid fraction of emboli retrieved from patients with atrial fibrillation was reported to consist of 65% fibrin and the balance platelets (12). Similarly, electron microscopy analysis of the solid fraction of acute myocardial infarction clots show that these clots consist of 56% fibrin and 17% platelets, with the balance being other blood cells (14). These data are evidence that the volume fraction of interstitial fibrin within a clot is likely much higher than that of clots formed at plasma concentrations of fibrinogen, and in some types of clots, the fibrin fibers are likely the major transport barrier to fluid and solute transport. Based on these data from extracted clots, we would predict that the permeability of fibrin-rich clots such as these have permeabilities in the range of 10−3–10−4 μm2, which is 2–3 orders-of-magnitude less than fibrin gels made at physiological fibrinogen concentration.
Modeling the permeability of fibrin gels requires the measurement of fibrin diameter and fiber volume fraction. Fibrin fiber diameter was relatively insensitive to fibrinogen concentration over the range of 3–156 mg/mL. Neutron scattering studies of fibrin fibers formed from solutions of 2–40 mg/mL fibrinogen noted a similar insensitivity to fibrinogen concentration (29). The average hydrated fiber radius we measured over all fibrinogen concentrations was between 51 and 60 nm. This range is in good agreement with the maximum fiber radius of ∼50 nm caused by the twisting of protofibrils (36). However, these radii are slightly lower than those measured by neutron scattering over a similar range of fibrinogen concentrations (60–70 nm), albeit with deuterated water. This could be a result of the assumption that there was no void space in the dehydrated fibers. If there were some voids within the fibers after fixation and dehydration preparation for SEM, then we would have underestimated the hydrated radius. It should be noted that this is the size of an individual fiber, but fibers can aggregate to yield effective fiber diameters of 100–300 nm (9). Thus, one potential source of error between the normalized permeability (kf/af2) based on our measurements and those predicted in the fibrous media models is that we have assumed the appropriate characteristic length is the radius of an individual fiber. Nevertheless, it seems that flow through fibrin gels is well described by theories of flow through a network of three-dimensional disordered cylinders.
The permeability of fibrin gels over the entire range of fiber volume fractions were well described by several models of fibrous media. The semiempirical Davies equation has been commonly used to estimate the permeability of fibrin gels and blood clots in the literature (25–27). Here, we found the Davies equation had excellent agreement with experimental permeability at fiber volume fractions of 0.006–0.3, but underestimates the permeability at higher fiber volume fraction. The Jackson and James expression is another common expression used for three-dimensional fibrous media. Similar to the Davies equation, the Jackson and James expression accurately predicts permeability in the semidilute regime but approaches zero as the volume fraction approaches 0.4, due to the fact that this expression is based on asymptotic expansions in the dilute limit. The LB simulations presented by Clague et al. found that there was good agreement over the entire range of fiber volume fractions measured experimentally. Therefore, we used Eq. 7 for calculating both fibrin gel permeability and the fibrin contribution to the overall permeability in PRC. Unlike the Jackson and James expression, Eq. 7 captures the appropriate scaling behavior in both the dilute and concentrated fiber volume fraction limits. In the dilute limit, the permeability scales as ln(ϕf)/ϕf. In the concentrated limit, the permeability scales according to the lubrication approximation (16,19).
One potential limitation of the data in this study is that fibrin gels were formed under static conditions, resulting in an isotropic medium of randomly oriented fibers. However, there is evidence that flow may effect the orientation of fibrin fibers. For example, in a purified system consisting of fibrinogen and thrombin it was found that ability of fibrin fibers to form and aggregate, as well as their orientation, is profoundly influenced by the shear rate and rate of thrombin generation (37). Similarly, flowing plasma over activated platelets or tissue factor-presenting cells also showed that fibrin fibers tend to align in the direction of flow (38,39). Finite element simulation of flow through networks of aligned fibers predict that the permeability in the direction parallel to fibers will be higher than in an isotropic network but that there is little difference in permeability for aligned and isotropic networks for flow perpendicular to fibers (22). The noted dependence of permeability upon alignment in these studies, however, was shown to be secondary compared to fiber diameter and fiber volume fraction. If these predictions held for fibrin-rich clots, then the permeabilities presented in this study for isotropic fibrin gels could slightly underestimate the permeability in the direction of flow.
Clots formed in large arteries or stenosis can consist of large volume fractions of platelets. For example, ∼33% of thrombi formed on ruptured coronary plaques consist of a majority of platelets (40). Clots formed in vitro in a model of a stenotic artery consist of up to 80% platelets (41). Yet, there have been few measurements of permeability of fibrin gels with a significant (>0.2) volume fraction of blood cells. Clots formed at a fibrin volume fraction of 0.03 had an exponential decrease in permeability with increasing platelet volume fraction over the range of 0.2 < ϕp < 0.6. A resistor-in-parallel model that takes into account the viscous losses on the platelets in parallel to those on the fibrin fibers provides a good first-order estimate of the permeability of PRC. However, the more rigorously derived Ethier model based on the Brinkman equation provides at least better qualitative treatment of the interplay between fibrin and platelets as platelet volume fraction increases. Specifically, increases in platelet volume fraction result not only in viscous losses on the platelet surface but also in an increase of the tortuosity of the flow path and the superficial velocity of the fluid through the fibrin gel. Below a platelet volume fraction of 0.2, platelets play only a limited role in determining permeability and the fibrin permeability provides a good estimate of the overall permeability of the PRC. This is in agreement with the influence of erythrocytes in fibrin gels, which resulted in no significant difference in permeability up to a volume fraction of 0.2 (42).
A limitation of using the Ethier model to describe PRC is that it describes a medium consisting of two cylinders with dissimilar radii. Here, we have applied it to a medium consisting of fine fibers and larger disk or spherical particles. One difference between cylinders and spheres is that the drag force on a sphere is larger than on a cylinder with the same radius for low Reynolds number flows. Consequently, the effective coarse fiber radius in the Ethier model would likely be smaller than that of a platelet or platelet aggregate. We may have indirectly accounted for this difference because a larger value of kf/acoarse2 was needed to fit our experimentally measured permeability than would be predicted by the measured values of kf and acoarse. The authors are unaware of any theoretical treatment of spherical or elliptical objects embedded in a fibrous medium with which we could compare our experimental results.
Within a clot, the distribution of platelets and fibrin can be heterogeneous. For example, histology of clots retrieved from individuals with ischemic stroke show thin layers of fibrin-platelet interspersed with erythrocytes and leukocytes (13). The nature of an injury also will affect the clot composition. Shallow injuries that expose the collagen-rich extracellular matrix underneath endothelial cells will primarily promote platelet adhesion and aggregation. Deeper injuries can expose tissue factor-bearing adventitial cells such as fibroblasts and smooth muscle cells, which can induce coagulation and thus produce more fibrin. Intravital microscopy in the murine laser injury model of thrombosis show that fibrin density tends to be greatest near the vessel wall and on the upstream edge of a clot during the initial stages of clot formation (43). Platelets within the interior of a clot form a densely packed core that may be impermeable to fluid and solute transport (44). Platelets along the periphery of the clot are less densely packed. This heterogeneity in platelet density seems to reflect platelet activation because P-selectin positive platelets are observed in the core closest to the site of injury (45). A morphology of a dense core of activated platelets surrounded by more loosely packed inactivated platelets is also predicted in computational models (6,27). These data suggest that there are regions of a clot, notably the outside shell of platelet and fibrin that are more permeable, and thus subject to an evolving biochemical environment that includes the influx and removal of plasma and coagulation proteins. The data from this study can be used as a lookup table of permeabilities for different regions of clot within these computational models.
Conclusions
In this study, we have examined a broad range of fibrin and platelet densities in an effort to bound the possible compositions of clots formed during the initial stages of hemostatic and thrombotic clots. We found that a combination of fibrous media models and mixed porous media models can be used to predict the permeability of clots over a wide range of fibrin and platelet volume fractions. Fibrin gels or platelet-poor clots are well described as a medium of disordered fibers with a uniform diameter. Clots with significant volume fractions of platelets >0.2 are best described as a Brinkman medium. These models can be used to make predictions on the rate at which fluid can move through the interstitial spaces of a clot. Such predictions are important for estimating the rate of coagulation zymogens/enzymes entering and leaving a clot, as well as developing drug delivery strategies for disrupting clot formation or enhancing lysis.
Acknowledgments
This work was supported by a Scientist Development Grant from the American Heart Association, the Colorado Office of Economic Development and International Trade, and the Boettcher Foundation’s Webb-Waring Biomedical Research Award.
Supporting Material
References
- 1.Swartz M.A., Fleury M.E. Interstitial flow and its effects in soft tissues. Annu. Rev. Biomed. Eng. 2007;9:229–256. doi: 10.1146/annurev.bioeng.9.060906.151850. [DOI] [PubMed] [Google Scholar]
- 2.Reddy S.T., van der Vlies A.J., Hubbell J.A. Exploiting lymphatic transport and complement activation in nanoparticle vaccines. Nat. Biotechnol. 2007;25:1159–1164. doi: 10.1038/nbt1332. [DOI] [PubMed] [Google Scholar]
- 3.Morrison P.F., Laske D.W., Dedrick R.L. High-flow microinfusion: tissue penetration and pharmacodynamics. Am. J. Physiol. 1994;266:R292–R305. doi: 10.1152/ajpregu.1994.266.1.R292. [DOI] [PubMed] [Google Scholar]
- 4.Neeves K.B., Sawyer A.J., Olbricht W.L. Dilation and degradation of the brain extracellular matrix enhances penetration of infused polymer nanoparticles. Brain Res. 2007;1180:121–132. doi: 10.1016/j.brainres.2007.08.050. [DOI] [PMC free article] [PubMed] [Google Scholar]
- 5.Brass L.F., Wannemacher K.M., Stalker T.J. Regulating thrombus growth and stability to achieve an optimal response to injury. J. Thromb. Haemost. 2011;9(Suppl 1):66–75. doi: 10.1111/j.1538-7836.2011.04364.x. [DOI] [PMC free article] [PubMed] [Google Scholar]
- 6.Leiderman K., Fogelson A.L. Grow with the flow: a spatial-temporal model of platelet deposition and blood coagulation under flow. Math. Med. Biol. 2011;28:47–84. doi: 10.1093/imammb/dqq005. [DOI] [PMC free article] [PubMed] [Google Scholar]
- 7.Roberts W.W., Kramer O., Ferry J.D. Rheology of fibrin clots. I. Dynamic viscoelastic properties and fluid permeation. Biophys. Chem. 1974;1:152–160. doi: 10.1016/0301-4622(74)80002-5. [DOI] [PubMed] [Google Scholar]
- 8.Rosser R.W., Roberts W.W., Ferry J.D. Rheology of fibrin clots. IV. Darcy constants and fiber thickness. Biophys. Chem. 1977;7:153–157. doi: 10.1016/0301-4622(77)80008-2. [DOI] [PubMed] [Google Scholar]
- 9.Blombäck B., Carlsson K., Aslund N. Native fibrin gel networks observed by 3D microscopy, permeation and turbidity. Biochim. Biophys. Acta. 1989;997:96–110. doi: 10.1016/0167-4838(89)90140-4. [DOI] [PubMed] [Google Scholar]
- 10.Antovic A., Perneby C., He S. Marked increase of fibrin gel permeability with very low dose ASA treatment. Thromb. Res. 2005;116:509–517. doi: 10.1016/j.thromres.2005.02.007. [DOI] [PubMed] [Google Scholar]
- 11.Rooth E., Wallen N.H., He S. Decreased fibrin network permeability and impaired fibrinolysis in the acute and convalescent phase of ischemic stroke. Thromb. Res. 2011;127:51–56. doi: 10.1016/j.thromres.2010.09.011. [DOI] [PubMed] [Google Scholar]
- 12.Wysokinski W.E., Owen W.G., McBane R.D., 2nd Atrial fibrillation and thrombosis: immunohistochemical differences between in situ and embolized thrombi. J. Thromb. Haemost. 2004;2:1637–1644. doi: 10.1111/j.1538-7836.2004.00899.x. [DOI] [PubMed] [Google Scholar]
- 13.Marder V.J., Chute D.J., Saver J.L. Analysis of thrombi retrieved from cerebral arteries of patients with acute ischemic stroke. Stroke. 2006;37:2086–2093. doi: 10.1161/01.STR.0000230307.03438.94. [DOI] [PubMed] [Google Scholar]
- 14.Silvain J., Collet J.-P., Weisel J.W. Composition of coronary thrombus in acute myocardial infarction. J. Am. Coll. Cardiol. 2011;57:1359–1367. doi: 10.1016/j.jacc.2010.09.077. [DOI] [PMC free article] [PubMed] [Google Scholar]
- 15.Clauss A. Rapid physiological coagulation method in determination of fibrinogen [Gerinnungsphysiologische schnellmethode zur bestimmung des fibrinogens] Acta Haematol. 1957;17:237–246. doi: 10.1159/000205234. [DOI] [PubMed] [Google Scholar]
- 16.Sangani A.S., Acrivos A. Slow flow through a periodic array of spheres. Int. J. Multiph. Flow. 1982;8:343–360. [Google Scholar]
- 17.Drummond J.E., Tahir M.I. Laminar viscous flow through regular arrays of parallel solid cylinders. Int. J. Multiph. Flow. 1984;10:515–540. [Google Scholar]
- 18.Jackson G.W., James D.F. The permeability of fibrous porous media. Can. J. Chem. Eng. 1986;64:364–374. [Google Scholar]
- 19.Higdon J., Ford G. Permeability of three-dimensional models of fibrous porous media. J. Fluid Mech. 1996;308:341–361. [Google Scholar]
- 20.Clague D., Phillips R. A numerical calculation of the hydraulic permeability of three-dimensional disordered fibrous media. Phys. Fluids. 1997;9:1562–1572. [Google Scholar]
- 21.Thompson K.E. Pore-scale modeling of fluid transport in disordered fibrous materials. AIChE J. 2002;48:1369–1389. [Google Scholar]
- 22.Stylianopoulos T., Yeckel A., Barocas V.H. Permeability calculations in three-dimensional isotropic and oriented fiber networks. Phys Fluids (1994) 2008;20:123601. doi: 10.1063/1.3021477. [DOI] [PMC free article] [PubMed] [Google Scholar]
- 23.Mattern K.J., Deen W.M. “Mixing rules” for estimating the hydraulic permeability of fiber mixtures. AIChE J. 2008;54:32–41. [Google Scholar]
- 24.Davies C.N. The separation of airborne dust and particles. Inst. Mech. Eng. (London) 1952;B1:185–213. [Google Scholar]
- 25.Diamond S.L., Anand S. Inner clot diffusion and permeation during fibrinolysis. Biophys. J. 1993;65:2622–2643. doi: 10.1016/S0006-3495(93)81314-6. [DOI] [PMC free article] [PubMed] [Google Scholar]
- 26.Wootton D.M., Popel A.S., Alevriadou B.R. An experimental and theoretical study on the dissolution of mural fibrin clots by tissue-type plasminogen activator. Biotechnol. Bioeng. 2002;77:405–419. [PubMed] [Google Scholar]
- 27.Xu Z., Lioi J., Alber M. A multiscale model of venous thrombus formation with surface-mediated control of blood coagulation cascade. Biophys. J. 2010;98:1723–1732. doi: 10.1016/j.bpj.2009.12.4331. [DOI] [PMC free article] [PubMed] [Google Scholar]
- 28.Clague D.S., Kandhai B.D., Sloot P.M. Hydraulic permeability of (un)bounded fibrous media using the lattice Boltzmann method. Phys. Rev. E Stat. Phys. Plasmas Fluids Relat. Interdiscip. Topics. 2000;61:616–625. doi: 10.1103/physreve.61.616. [DOI] [PubMed] [Google Scholar]
- 29.Weigandt K., Pozzo D., Porcar L. Structure of high density fibrin networks probed with neutron scattering and rheology. Soft Matter. 2009;5:4321–4330. [Google Scholar]
- 30.Shulman S. The size and shape of bovine fibrinogen. Studies of sedimentation. Diff. Viscos. 1953;75:5846–5852. [Google Scholar]
- 31.McCabe W., Smith J., Harriott P. McGraw Hill; Englewood Cliffs, NJ: 2004. Unit Operations of Chemical Engineering, 7th Ed. [Google Scholar]
- 32.Koltermann C.E., Gorelick S.M. Fractional packing model for hydraulic conductivity derived from sediment mixtures. Water Resour. Res. 1995;31:3283–3297. [Google Scholar]
- 33.Ethier C.R. Flow through mixed fibrous porous materials. J. AIChE. 1991;37:1227–1236. [Google Scholar]
- 34.Wagner C.L., Mascelli M.A., Jordan R.E. Analysis of GPIIb/IIIa receptor number by quantification of 7E3 binding to human platelets. Blood. 1996;88:907–914. [PubMed] [Google Scholar]
- 35.Truskey G.A., Yuan F., Katz D.F. Prentice Hall; Englewood Cliffs, NJ: 2009. Transport Phenomena in Biological Systems, 2nd Ed. [Google Scholar]
- 36.Weisel J.W., Nagaswami C., Makowski L. Twisting of fibrin fibers limits their radial growth. Proc. Natl. Acad. Sci. USA. 1987;84:8991–8995. doi: 10.1073/pnas.84.24.8991. [DOI] [PMC free article] [PubMed] [Google Scholar]
- 37.Neeves K.B., Illing D.A.R., Diamond S.L. Thrombin flux and wall shear rate regulate fibrin fiber deposition state during polymerization under flow. Biophys. J. 2010;98:1344–1352. doi: 10.1016/j.bpj.2009.12.4275. [DOI] [PMC free article] [PubMed] [Google Scholar]
- 38.Gersh K.C., Edmondson K.E., Weisel J.W. Flow rate and fibrin fiber alignment. J. Thromb. Haemost. 2010;8:2826–2828. doi: 10.1111/j.1538-7836.2010.04118.x. [DOI] [PMC free article] [PubMed] [Google Scholar]
- 39.Campbell R.A., Aleman M., Wolberg A.S. Flow profoundly influences fibrin network structure: implications for fibrin formation and clot stability in haemostasis. Thromb. Haemost. 2010;104:1281–1284. doi: 10.1160/TH10-07-0442. [DOI] [PMC free article] [PubMed] [Google Scholar]
- 40.Uchida Y., Uchida Y., Morita T. Characterization of coronary fibrin thrombus in patients with acute coronary syndrome using dye-staining angioscopy. Arterioscler. Thromb. Vasc. Biol. 2011;31:1452–1460. doi: 10.1161/ATVBAHA.110.221671. [DOI] [PubMed] [Google Scholar]
- 41.Ku D.N., Flannery C.J. Development of a flow-through system to create occluding thrombus. Biorheology. 2007;44:273–284. [PubMed] [Google Scholar]
- 42.Gersh K.C., Nagaswami C., Weisel J.W. Fibrin network structure and clot mechanical properties are altered by incorporation of erythrocytes. Thromb. Haemost. 2009;102:1169–1175. doi: 10.1160/TH09-03-0199. [DOI] [PMC free article] [PubMed] [Google Scholar]
- 43.Falati S., Gross P., Furie B. Real-time in vivo imaging of platelets, tissue factor and fibrin during arterial thrombus formation in the mouse. Nat. Med. 2002;8:1175–1181. doi: 10.1038/nm782. [DOI] [PubMed] [Google Scholar]
- 44.Stalker T.J., Traxler E.A., Brass L.F. Development of a stable thrombotic core with limited access to plasma proteins during thrombus formation in vivo. ASH Annu. Mtg. Abstr. 2010;116:2013. [Google Scholar]
- 45.Bellido-Martín L., Chen V., Furie B.C. Imaging fibrin formation and platelet and endothelial cell activation in vivo. Thromb. Haemost. 2011;105:776–782. doi: 10.1160/TH10-12-0771. [DOI] [PubMed] [Google Scholar]
Associated Data
This section collects any data citations, data availability statements, or supplementary materials included in this article.