

Abstract
Microbubble-mediated ultrasound therapy can noninvasively enhance drug delivery to localized regions in the body. This technique can be beneficial in cancer therapy, but currently there are limitations to tracking the therapeutic effects. The purpose of this experiment was to investigate the potential of fluorescent imaging for monitoring the temporal effects of microbubble-mediated ultrasound therapy. Mice were implanted with 2LMP breast cancer cells. The animals underwent microbubble-mediated ultrasound therapy in the presence of Cy5.5 fluorescent-labeled IgG antibody (large molecule) or Cy5.5 dye (small molecule) and microbubble contrast agents. Control animals were administered fluorescent molecules only. Animals were transiently imaged in vivo at 1, 10, 30, and 60 min post therapy using a small animal optical imaging system. Tumors were excised and analyzed ex vivo. Tumors were homogenized and emulsion imaged for Cy5.5 fluorescence. Monitoring in vivo results showed significant influx of dye into the tumor (p < 0.05) using the small molecule, but not in the large molecule group (p > 0.05). However, after tumor emulsion, significantly higher dye concentration was detected in therapy group tumors for both small and large molecule groups in comparison to their control counterparts (p < 0.01). This paper explores a noninvasive optical imaging method for monitoring the effects of microbubble-mediated ultrasound therapy in a cancer model. It provides temporal information following the process of increasing extravasation of molecules into target tumors.
I. Introduction
The ability to monitor drug therapy over time elucidates tumor uptake mechanisms and pending response to treatment for individual patients. Cancer is the second most common cause of death in the United States, with a projected 572 000 deaths in 2011 [1]. The efficiency of drug delivery to a target tumor ultimately determines the effectiveness of the systemic treatment [2]. Therefore, increasing the amount of drug localized and taken up by the tumor will improve antitumor effects, while potentially allowing a dose reduction to minimize systemic toxicity. The demands for new noninvasive treatments have led to novel modalities to monitor and evaluate early treatment response.
In combination with chemotherapy, antibody therapy has been an emerging field in many cancer types including breast, pancreatic, head and neck, lung, colon and esophageal. Antibody-based therapies are a positive addition to chemotherapy because they use humanized or human antibodies that have high specificity and low toxicity values [3], [4]. The current difficulties with antibody therapy are the large size of the antibody and its ability to extravasate from the blood stream to the tumor region of interest. Although antibodies circulate for weeks, if blood flow to the tumor is limited, those that do not reach their intended target are metabolized by the liver before reaching the cancer [3]. Although targets for antibody therapy are extracellular, previous in vitro studies have shown that using microbubble-mediated ultrasound therapy can increase localized effectiveness of cancer therapy [5].
Imaging modalities such as positron emission tomography (PET), single-photon emission computed tomography (SPECT), magnetic resonance imaging (MRI), and ultrasound are becoming increasing popular in preclinical applications to explore drug delivery and bioeffects. Although this is true, optical imaging to monitor drug delivery gives an inexpensive, noninvasive approach to efficiently analyze longitudinal studies of molecular delivery [6]. Advantages of optical imaging include safety and immediate analysis (compared with secondary analysis such as perfusion, tumor size, etc.). One limitation to optical imaging is the difficulty to directly translate it into the clinic. Unless the drug is already fluorescently labeled, optical imaging is most effectively used in preclinical applications to study and learn about new drugs, drug delivery vehicles, and drug delivery methods [6], [7].
Microbubbles are micrometer-sized gas-filled particles, surrounded by a flexible outer core composed of polymer or lipid molecules [8]–[10]. Their original purpose was to provide ultrasound image contrast enhancement for real-time assessment of myocardial perfusion in coronary artery disease [11]. However, because of their impressive response under certain ultrasound conditions, microbubbles have emerged as a novel adjuvant therapy to conventional and targeted chemotherapeutics. Microbubble contrast agents in the presence of ultrasound have been shown to exhibit two mechanisms that complement drug delivery. These include vascular extravasation and temporarily enhancing cell membrane permeability [12], [13]. Under the influence of particular ultrasound conditions and in the presence of cells, microbubbles mechanically oscillate, which can produce pores in cellular membranes in the localized area of interest [13]–[15]. Using this technique, microbubbles have been shown to temporarily open up the blood—brain barrier to allow increased delivery of drugs to the brain [13], [16]. Molecular extravasation into tumors through microbubble therapy has also been shown to increase anticancer effects [17]. This technique can increase localized delivery of molecules directly to the cytoplasm of cells; drugs, such as paclitaxel and doxorubicin, and molecules, such as lipoplexes for increased transfection, have been demonstrated to have enhanced delivery [18], [19]. These pores created will react in a manner similar to a wound response, healing shortly after physical interaction with the contrast agent and ultrasound subsides [20], [21]. Microbubbles have also been shown to increase extravasation by breaking down gap junctions between endothelial cells and transport molecules across a cell membrane barrier through the temporary pores [22]–[26]. Two phenomena occur in microbubble-mediated ultrasound therapy: increased vascular extravasation through gaps formed between endothelial cells of the tumor and cell uptake through pore formation. Microbubble-mediated ultrasound therapy has become an increasingly attractive field of study because of its ability to noninvasively increase localized passive delivery of chemotherapeutic and other drug therapies.
With the emergence of combination cancer therapies, it has become essential to understand the mechanics behind the therapy. The ability to noninvasively monitor effectiveness of drug uptake from microbubble-mediated ultrasound therapy is beneficial in gaining further understanding on the mechanisms of the treatment. In this paper, we explore the potential of optical fluorescence imaging techniques for monitoring the temporal effects of microbubble-mediated ultrasound therapy in a preclinical breast cancer animal model.
II. Materials and Methods
A. Cell Culture
2LMP human breast cancer cells (MDA-MB-231, lung metastatic pooled) were used as a biological model for investigating microbubble-mediated ultrasound therapy in cancer therapy applications. The 2LMP cell line was maintained in Dulbecco’s modified Eagles medium (DMEM), 10% fetal bovine serum (FBS), and 1% L-glutamine. All cells were cultured to 70% to 90% confluency before passaging. Cells were grown at 37°C and in 5% CO2 and 90% relative humidity. Appropriate cell numbers for all experiments were determined using hemocytometer and trypan blue dye exclusion.
B. Animal Preparation
Animal experiments were reviewed and approved by the Institutional Animal Care and Use Committee (IA-CUC) at the University of Alabama at Birmingham. Twenty-three 6-week-old nude female athymic NCr-nu/nu mice (Jackson Laboratory, Bar Harbor, ME) were implanted subcutaneously with 2 × 10⁶ 2LMP breast cancer cells in the left flank. The implanted tumors were allowed to grow for approximately three weeks before beginning experimental studies. Mice were randomly sorted into four groups: small molecule with microbubble-mediated ultrasound treatment (N = 6), small molecule control with no additional treatment (N = 6), large molecule with microbubble-mediated ultrasound treatment (N = 6), and large molecule control with no additional treatment (N = 5). The tumor area was measured from images acquired using a small animal optical imaging system (Pearl Impulse, LI-COR Biotechnology, Lincoln, NE).
C. In Vivo Microbubble-Mediated Ultrasound Therapy
Cy5.5-labeled IgG antibody (SouthernBiotech, Birmingham, AL) and Cy5.5 dye (GE Healthcare Life Sciences, Piscataway, NJ) were analyzed in this experiment for their variation in size and representation of antibody and chemotherapeutic drugs in cancer. Cy5.5-labeled IgG [molecular weight (MW) = 150 kDa] is a larger molecule, similar in size to antibodies used in cancer therapy, whereas Cy5.5 dye (MW = 1.1 kDa) is a smaller molecule, comparable to chemotherapeutics used in cancer treatment. Hereafter, these fluorescent tracers will be referred to as either small (Cy5.5 dye) or large (Cy5.5- labeled IgG) molecular agents. The blood half-lives of these Cy5.5 molecules are estimated to be 20 min and 11 d for the small and large molecules, respectively [27], [28]. Optimized parameters from previous microbubble-mediated ultrasound therapy studies were used as a baseline to induce fluorescent tracer tumor uptake in vivo [26]. The custom experimental ultrasound setup involved an unfocused 19-mm (.75-in) single-element immersion transducer (Olympus, Waltham, MA) in series with an oscilloscope (TDS 2014B, Tektronix, Beaverton, OR), signal generator (AFG3022B, Tektronix) and power amplifier (A075, Electronics and Innovation, Rochester, NY) as shown in Fig. 1. Ultrasound parameters included: 1.0 MHz transmit frequency, 5 min duration of exposure, 5 s pulse repetition period, 20% duty cycle, and a mechanical index (MI) of 0.5 (22 mW/cm2). Mice were submerged in a custom-built 37°C water bath and remained under isoflurane gas anesthesia for the entirety of the ultrasound imaging. Each mouse was initially anesthetized, then strapped on a custom board. This board has a port to keep a constant flow of isoflurane to the animal for the entirety of its placement on the board. The board was submerged at a 30° angle in the water bath (the entire body of the mouse, except the head, is submerged) and the transducer was placed perpendicular to the tumor, as seen in Fig. 1. Mice underwent microbubble-mediated ultrasound therapy in the presence of small (25 μL, 10−3 M) or large (25 μL dye-labeled antibody, 10−7 M) fluorescent molecules and uncoated microbubbles (Definity, Lantheus Medical Imaging, North Billerica, MA) in a 37°C water bath. Cy5.5 labeled IgG molecules were purchased preconjugated from SouthernBiotech in a working dilution of 10 μL per 1 × 10⁶ cells. The amount of fluorescence on the IgG molecule was calculated with a spectrophotometer (NanoDrop 2000c, Thermo Scientific, Wilmington, DE), because this was not information given in the product sheet. Although molarity concentration was not identical for the small or large molecule group, therapy was completed using the same batches during the experiment and all therapy advancements were compared with a control injection of the same amount, allowing appropriate standardization to calculate therapeutic gains. A combination of microbubbles (30 μL) and fluorescent molecules (25 μL) was mixed and diluted with saline to a total volume of 100 μL. This mixture (100 μL) was delivered simultaneously intravenously via tail vein bolus injections. Control mice underwent sham therapy (i.e., receiving no ultrasound exposure, yet kept under the same conditions as therapy groups, including injection of microbubbles and fluorescent molecules). Animals were controlled under isoflurane anesthesia throughout the microbubble-mediated ultrasound therapy process.
Fig. 1.

The therapeutic setup for in vivo microbubble-mediated ultrasound is shown and involves a single-element immersion transducer in series with an oscilloscope, a signal generator, and power amplifier. Animals were intravenously injected with microbubbles and fluorescent tracers and then underwent therapy in a water bath with constant flow of isoflurane anesthesia.
D. In Vivo Optical Fluorescent Imaging
Immediately after completing microbubble-mediated ultrasound or sham therapy, each mouse was transiently imaged at 1, 10, 30, and 60 min post therapy using a dedicated small animal optical imaging system (Pearl Impulse). The Pearl Impulse optical imaging system is a closed configuration with a cooled charge-coupled camera that achieves deep target imaging with laser excitation, and near-infrared fluorescent detection. Imaging was performed using a near-infrared window 700-nm channel, exciting at a wavelength of 685 nm and emitting at 720 nm (Fig. 2). Animals were maintained under isoflurane anesthesia for each imaging time point. Each animal was positioned on its side, with the tumor side facing upwards in the chamber. One image for each time point was retrieved (gray scale image of the mice and fluorescence intensity were taken simultaneously). The mice were awakened between each imaging sequence. The ability to image tumors progressively over time allowed measurement of local fluorescent tracer uptake and any therapy-induced effects. Fluorescent intensity was measured using the Pearl Impulse software version 2.0 (LI-COR Biotechnology) region-of-interest (ROI) analysis of the tumors. An ROI was drawn around each tumor (this was done separately for each image, because there might be slight differences in mouse positioning). Then, using the Pearl Impulse software, total fluorescent intensity within that ROI was measured. Each ROI was then normalized by its total pixel counts to quantify mean intratumoral fluorescence. All measurements from small and large molecule groups were compared with control counterparts to quantitatively determine fluorescent tracer uptake and retention. Qualitative analysis of spatial variations in tumor samples was performed.
Fig. 2.
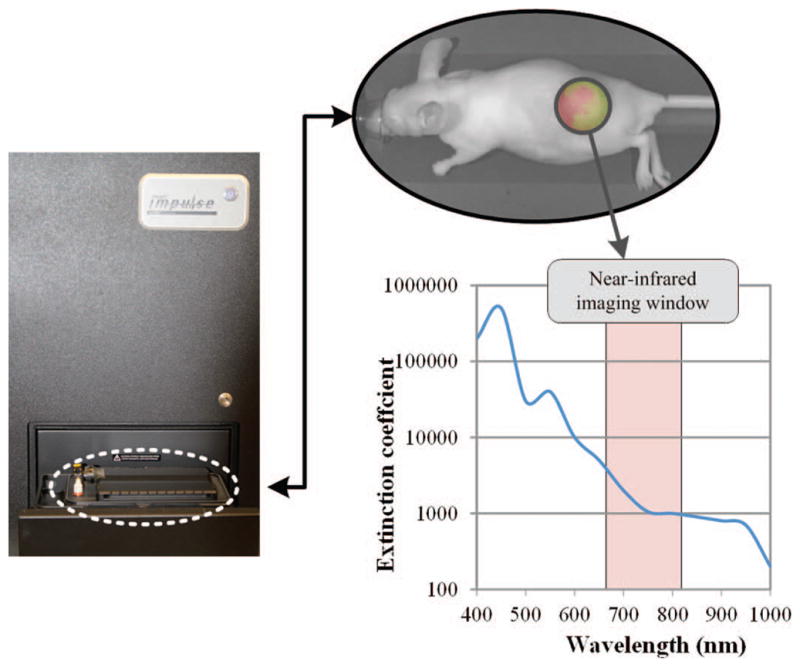
The in vivo temporal fluorescent imaging setup shows the fluorescent optical imaging system for monitoring molecular uptake in live animals. Imaging near-infrared fluorescent tracers reduces background signal and improves dye-to-tissue contrast levels.
E. Ex Vivo Optical Fluorescent Imaging
Animals were humanely euthanized immediately following the last optical imaging time point (1 h post therapy) and tumors were extracted. Excised tumors were rinsed with saline, weighed (AX105 DeltaRange, Mettler Toledo, Columbus, OH) and imaged for fluorescent signal detection using the Pearl Impulse. Tumors were then sectioned into quarters for fluorescent dye extraction.
F. Fluorescent Dye Extraction
Each of the quarters was weighed and 250 μL of a 100 mM sodium hydroxide (NaOH) solution (sodium hydroxide molecular biology grade, Fisher Scientific, Fair Lawn, NJ) was added. The tumor samples were digested in the NaOH solution for 2 h with periodic vortexing. Samples were centrifuged (10 min at 16.1 × 10³ g) and the supernatant (50 μL) was analyzed for dye extraction using a fluorescent plate reader with a 694-nm filter (Victor2 1420 Multilabel counter, PerkinElmer Life Sciences, Waltham, MA), exciting at a wavelength of 675 nm. The tumor samples continued to incubate in NaOH solution for the remainder of 48 h to extract the remaining dye. Supernatant was analyzed again using the methods described previously at 24 and 48 h after tumor extraction. At 48 h post extraction, the remaining supernatant was removed from the tumor pellets and the samples were again imaged using the small animal imaging system to determine the presence of any residual Cy5.5 dye.
G. Statistical Analysis
All statistical data was analyzed using SAS software (SAS Institute Inc., Cary, NC). Unpaired two-sample t-tests were used to assess differences between the small and large molecule group data, as well as control and microbubble-mediated ultrasound therapy exposed group data. For in vivo experiments of sequential fluorescent testing, analysis of variance (ANOVA) statistical testing was used to test difference in groups. Data was recorded as mean ± SEM. A p-value of less than 0.05 was considered statistically significant.
III. Results
A. In Vivo Optical Fluorescent Imaging
In vivo optical imaging following application of microbubble-mediated ultrasound allows monitoring of local tumor uptake of systemically circulating fluorescent tracers. The average tumor size was 113.8 ± 10.6 mm2. There were no significant differences between tumor sizes, between small molecule therapy and control group (p = 0.32), or between large molecule therapy and control group (p = 0.26). Temporal measurements showed a 70.1% increase in small molecule fluorescent tracer accumulation over control group measurements at 1 min, followed by increases of 45.1%, 25.5%, and 18.6% at 10, 30, and 60 min, respectively (p = 0.02). In the large molecule group, in vivo data demonstrated tracer accumulation increases of 9.6%, −4.3%, −2.6%, and −2.8% over control at 1, 10, 30, and 60 min, respectively, although the data were not significant (p = 0.51), as shown in Fig. 3. Fig. 3(a) depicts representative images of intratumoral fluorescent tracer uptake for the small molecule group at 60 min. Figs. 3(b) and 3(c) shows uptake trends for the small and large molecule groups, respectively. Qualitative analysis of tumor samples showed spatial variations throughout the tumor. Compared with control data, significant increases in small molecular tracer uptake were observed up to 10 min following microbubble-mediated ultrasound exposure (p < 0.05). However, this trend subsided and no significant differences in tracer accumulation were found at 30 or 60 min (p > 0.05). No such trend was observed in the large molecule group data. Tumors were quantitatively analyzed for fluorescent signal as a whole, but increased signal levels were frequently noted in the tumor periphery where vascularity is most dense in these preclinical animal models. Although this is true, accumulation in blood cannot be distinguished from uptake in tissue, therefore the variation is not known to be linked to vascularization.
Fig. 3.

Optical monitoring allows intratumoral analysis of fluorescent tracer accumulation. The mean fluorescent signal from each tumor location is normalized by tumor size. (a) Representative images of therapy and control animals at 1, 10, 30, and 60 min after microbubble-mediated ultrasound therapy exposure and/or fluorescent tracer dosing. Summary of fluorescent image temporal measurements from therapy and control tumors for the (b) small molecular and (c) large molecular trace-dosed animals.
B. Ex Vivo Optical Fluorescent Imaging
Tumors (N = 23) were imaged ex vivo with the Pearl Impulse and exhibited no significant differences during intra-group comparisons (p > 0.44), although fluorescent signals from Cy5.5 therapy samples were 19% greater than control (Fig. 4). Fig. 4(a) shows representative images of ex vivo tumors depicting detection of intratumoral fluorescence after microbubble-mediated ultrasound therapy using either the small or large molecular tracers. Fig. 4(b) shows fluorescent signal therapy and control groups, normalized by pixels in the ROI. Tumor weights were 0.312 ± 0.052 g. No differences were found during analysis of intragroup tumor weights between small molecule therapy and control group (p = 0.50) and large molecule therapy and control groups (p = 0.92), which allows direct comparison between therapy and control groups.
Fig. 4.
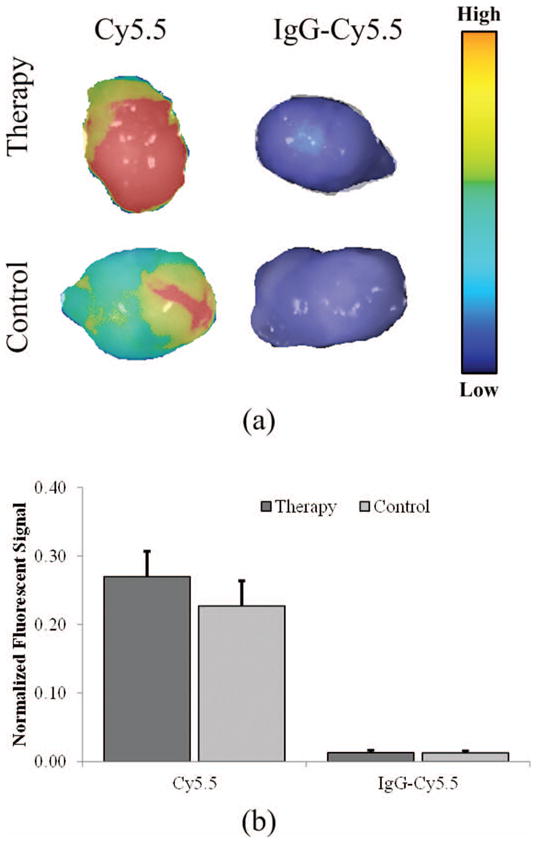
Tumor samples analyzed ex vivo for fluorescent signal detection. (a) Representative tumor images are shown for the small (Cy5.5) and large (IgG-labeled Cy5.5) molecular tracer exposed samples. (b) Differences in fluorescent signal from ex vivo samples (normalized by pixels in the region-of-interest).
C. Fluorescent Molecule Extraction
To quantify the amount of intratumoral dye (following microbubble-mediated ultrasound therapy exposure), excised tumor samples were homogenized, fluorescent dye was released from within the tumor, and the supernatant was imaged for fluorescent tracer presence. Fluorescent dye in the supernatant extracted from the tumors was used to determine the total amount of dye that was taken up or extravasated into the tumor. At 2 h of degrading in NaOH, no significant difference in supernatant fluorescence of degraded tumors was found in comparison to the counterpart control samples (p > 0.61). At 24 h of degrading in NaOH, sample analysis revealed a significant increase (10.9%, p = 0.003) for the large molecular tracer group compared with control samples. At 24 h, no significant differences in the small molecular tracer group were found, yet there was a 5.5% increase in detected fluorescence signals for the samples exposed to microbubble-mediated ultrasound therapy compared with control tissue (p = 0.09). However, after 48 h of continuous NaOH treatment on ex vivo tumors to destroy cell barriers and allow fluorescent dye release, there was significantly higher Cy5.5 signal concentration in samples receiving microbubble-mediated ultrasound therapy with both small molecular (p = 0.01) and large molecular (p = 0.002) tracers, Fig. 5(a). Specifically, the microbubble-mediated ultrasound-therapy-exposed samples exhibited increases in fluorescent signal of 9.3% and 14.2% using small and large molecular tracers, respectively. The tumor pellet samples were imaged to determine the presence of any residual fluorescent Cy5.5 signal. No significant difference between residual amounts of fluorescent tracer in pellet samples after liquid removal were found (p > 0.10), Fig. 5(b). These findings suggest that the majority of fluorescent dye was extracted from all the excised tumor samples analyzed.
Fig. 5.
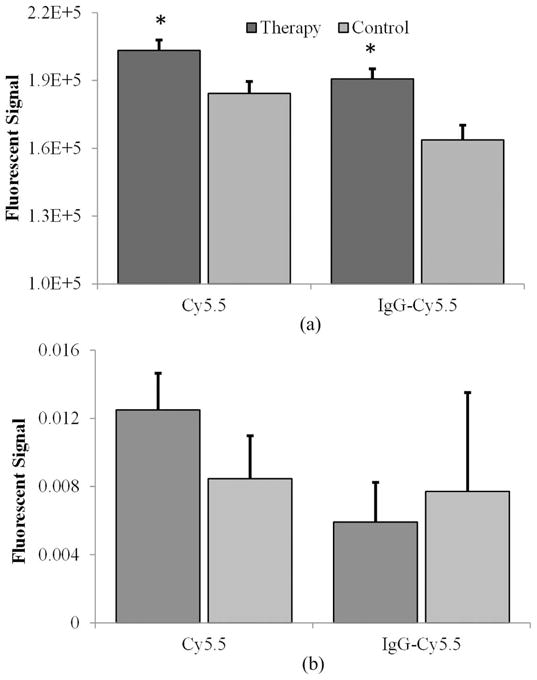
(a) Fluorescent signal analyzed in supernatant after tumor extraction. (b) Analysis of pellet fluorescence following completed dye expulsion reveals no significant differences remain between control and therapy exposed groups, indicating accurate measurements can be made from the supernatant solution and extracted dye.
IV. Discussion
Microbubble-mediated ultrasound therapy has considerable potential for increasing localized drug uptake in cancerous tissue in addition to a host of other clinical applications [10], [15]–[19]. As this novel therapy continues to be studied, it becomes increasingly important to elucidate the effects and mechanisms of this therapeutic adjunct. In this study, we investigated a noninvasive optical imaging method for monitoring the effects of microbubble-mediated ultrasound therapy in living animals. This strategy provides mechanistic insight into the process of increasing the localized delivery of molecules (such as chemotherapeutic drugs and therapeutic antibodies) to tumors, and may prove useful for optimizing this ultrasound-based technology for in vivo applications.
Both IgG-labeled Cy5.5 (large molecules, MW = 150 kDa) and Cy5.5 dye alone (small molecules, MW = 1.1 kDa) were analyzed in this experiment because of their matched size relationship to antibody and chemotherapeutic cancer drugs, respectively. Exposure parameters can influence the impact of microbubble-mediated ultrasound therapy through size, location, and number of the pores developed; therefore molecular size is an important consideration. IgG molecules are composed of four peptide bonds [29]. These IgG molecules are similar in size to drugs such as cetuximab (MW = 152 kDa), which targets the epidermal growth factor (EGF) receptor and is used to treat cancers of the head and neck, lung, colon, and esophagus [30]. Bevacizumab (MW = 148 kDa) has been used in cancer treatment and is an IgG molecule [31]. Although these antibodies have been mentioned for comparison of size, there are many other that are currently used in cancer treatment. The molecular weight of Cy5.5 dye alone is similar to the size of current breast cancer chemotherapeutics such as paclitaxel (MW = 0.9 kDa) [32], [33]. The large molecular tracer group had fluorescent molecules directly conjugated to the antibody, whereas the small molecule group was the same fluorescent molecules alone. Note that the total dye amount injected was not the same between the small and large molecular tracer groups. Because the amount of dye differed between the small and large molecules, it was necessary to analyze each group separately and use their control counterparts as direct comparison for quantitative analysis of fluorescent uptake. Although there were significant differences between the therapy and control groups in the supernatant analyzed, during the in vivo optical imaging analysis, only the small molecular tracer group data revealed significant increases in tumor uptake when comparing the microbubble-mediated ultrasound-therapy-exposed and control samples throughout the study. This is most likely because of the smaller size and ease of extravasation during microbubble-mediated ultrasound therapy exposure. It is currently unknown whether intracellular delivery of all antibodies would present an additive beneficial treatment or if it would decrease the effectiveness of some antibody therapy because of their targeting to extracellular markers. However, Maeda et al. showed that sonoporation of anti-EGFR antibody in vitro makes it possible to administer bleomycin into cells more efficiently and specifically, showing an application for cancer therapy in squamous cell carcinoma [5]. It could be possible to decrease effectiveness of the antibody when internalized if that particular antibody requires an extracellular interaction to begin its cascade of events (for example, TRA8 and targeting the DR-5 receptor to kill tumor cells) [34]. In vivo, total delivery of antibody to the tumor may be improved by endothelial cell disruptions to improve extravasation of antibody from the circulation. This data supports the need for increased research on in vivo longitudinal studies of sonoporation using both small and large molecules. Our in vivo data however, did not support this hypothesis. Further optimization of parameters might allow only increased cellular delivery of small molecules (e.g., chemotherapeutics), while allowing larger molecules (e.g., antibody treatments) to only target extracellular ligands.
When exploring in vivo microbubble-mediated ultrasound therapy, previously reported methods analyzed secondary effects, such as tumor response to chemotherapy, by measuring size and evaluating histological results post mortem [35]. Secondary effects, such as MRI signal enhancement have shown to be effective in correlating drug delivery from microbubble-mediated ultrasound therapy through the blood–brain barrier [13]. There has yet to be an established method for directly analyzing temporal affects in vivo. Optical fluorescent imaging has been used to look at investigating biological systems in many areas of interest and is extremely popular because imaging can be accomplished with native, unaltered cells [36]–[38], while still remaining noninvasive. Another option includes bioluminescent imaging; however, it is limited by genetic alteration of cells (e.g., luciferase-positive cells) [39]. One limitation to this study is the imaging system only reads near-infrared wavelengths of 700 nm or higher, therefore Cy5.5, Alexa fluor near-IR spectra and IR-dye are among the only fluorescent dyes available. Although this is a limitation, it is also advantageous because it limits the amount of background from surrounding tissue and is optimized for high-performance optical imaging. Without utilizing near-infrared dye, intrinsic autofluorescence from animal tissue can be high and can mask the signal from optical probes [40], [41]. Another limitation to this study is there was no control group of molecules plus ultrasound treatment alone (without microbubbles). This was done because of limitations in animal numbers. However, this limitation does not take away from the discoveries of the experiments, but shows that more extensive studies must be completed in the future to further explore the mechanisms of this therapy. This study demonstrates feasibility for a novel application for fluorescent optical imaging. Future studies will consist of combination microbubble-mediated ultrasound and fluorescently-labeled anticancer drug therapy with longitudinal optical monitoring.
This serial quantification allowed monitoring of direct temporal effects of microbubble-mediated ultrasound therapy on tumor tissue in vivo. This information also gives insight into biological effects on the recovery time of the cellular and vascular membranes post microbubble-mediated ultrasound therapy. In vivo results revealed significant differences over time in tumor uptake of the small molecular tracer when comparing therapy to control group data, yet no difference was seen when using the large molecular tracer. The ultrasound parameters used in this study have been previously explored in vivo with the delivery of paclitaxel [17]. The parameters may not have been optimal for antibody therapy and larger molecules, such as IgG; however, it was shown that dye was accumulated inside the tumor. When analyzing the small molecule group, there was initially a 70% increase of dye accumulation compared with control, which progressively decreases over time before plateauing at approximately 20%. There was no significant difference in fluorescent uptake at time point 30 and 60 min within the therapy group (p = 0.12), yet there were significant differences when compared with time point 10 min (p = 0.02). This is important because it may reveal significant insight regarding cell wound healing responses after microbubble-mediated ultrasound therapy. When examining this study, it appears that after 30 min post microbubble-mediated ultrasound therapy, there is no additional uptake of molecules. At that point, it is suspected that the fluorescent molecules, or chemotherapeutics, will remain entrapped in the cells or extravascular space within the solid mass tumor. It is hypothesized that the first thirty minutes of microbubble-mediated ultrasound therapy will have the greatest enhanced effect given the conditions used for this study. When monitoring the ex vivo supernatant fluorescent release from the tumors, the initial release of fluorescence (at 2 h) is believed to be released from the vascularity. After 48 h of sodium hydroxide treatment, supernatant from lysed tumor cells presented significant levels of Cy5.5 in both the small and large molecular tracer-dosed tumors. This additional fluorescent signal from time point 2 h to 48 h is hypothesized to be from the trapped fluorescent molecules within the cell membranes because it would take longer for the cells to lyse and release their fluorescence compared with the tumor vascularity. It is hypothesized that there was not enough of an increase to visualize using optical imaging for the large molecule group. In general, this experiment illustrates that it takes 48 h to completely extract the dye from the excised tissue samples. The ability to track each phenomenon is necessary to learn more about the in vivo mechanistic action of microbubble-mediated ultrasound therapy. Although both were significant when compared with their control counterpart, the small molecular tracer group produced higher levels of fluorescent signal than the large tracer group. This indicates that, in general, more fluorescent dye is being accumulated within the tumor when using the smaller particles. There was no significant difference in any of the pellet samples, showing that the majority of Cy5.5 was extracted in the supernatant for both the small and large molecule groups. This allowed an accurate reading of fluorescent levels and comparison between groups. Although tumors were quantitatively analyzed for fluorescent signal as a whole, increased fluorescence was most frequently observed around the tumor periphery. This is important to note because increased angiogenesis/vascularity in tumors is most commonly detected in animal models around the rim of the tumor. Using a near-IR dye, the amount of background from surrounding tissue is minimized, although it is important to note there is still some signal quantified from imaging the tissue itself. A limitation to the study is a lack of knowledge in whether extravasation or intracellular delivery is the dominant mechanism for the observed increased molecular uptake. We hypothesize that it is a combination effect, yet the exact mechanism still remains to be elucidated. For the study, it was necessary to use the whole tumor to directly analyze the amount of fluorescent dye released from the tumors, therefore no histological evidence is available to analyze in what cells the chromophore is located and whether it is truly intracellular. Although there is not conclusive information showing where the chromophores are residing after uptake by the tumor, we hypothesize that the initial release of fluorescence signal from the excised tumor (2 h immersed in NaOH) was from the vasculature of the tumor, whereas it took 48 h to completely degrade the cell membranes in NaOH to release the molecules that were entrapped intracellularly. Future studies will include histological analysis of tumors post microbubble-mediated ultrasound therapy to determine which cells within the tumor were involved in the molecular uptake. This study shows that microbubble-mediated ultrasound treatment may be more effective in cancer types that have increased vascularity or blood flow, and not hypo vascularized tumors, such as pancreatic cancer.
Near-infrared fluorescent optical imaging has proven useful for detecting cancer and monitoring cancer growth [42], [43]. The dye acts as a surrogate for drugs, and presents potential for analyzing uptake in preclinical studies. The ability to monitor the effectiveness of increased tumor perfusion from microbubble-mediated ultrasound therapy is extremely beneficial and will lead to increased understanding of systemic drug delivery. The capability to both monitor cancer treatment and evaluate pharmacological distribution will help us gain further understanding on the mechanisms of the treatment. As we further explore mechanisms of localized and targeting tumors in cancer therapy, optical fluorescent imaging could continue to improve our capabilities. This understanding and potentials are important as cancer research continues to progress and introduces combination therapy to current clinical practices.
V. Conclusion
A noninvasive optical imaging method for monitoring the effects of microbubble-mediated ultrasound therapy provided insight into the process of increasing extravasation of molecules into target tumors. Preliminary results are encouraging and fluorescent optical imaging may prove useful for optimizing therapy and drug delivery monitoring in preclinical cancer models.
Biographies

Anna G. Sorace (S’09) is a Ph.D. student in the Department of Biomedical Engineering at the University of Alabama at Birmingham, Birmingham, AL. She has been an IEEE Student Member since 2009. She received an M.S. degree in biomedical engineering in 2011 from the University of Alabama at Birmingham and a B.S. degree in bioengineering in 2009 from Mississippi State University. She is a member of Tau Beta Pi and the American Institute of Ultrasound in Medicine. She received the American Institute of Ultrasound in Medicine New Investigator Award in 2011. Anna Sorace’s research interests focus on ultrasound contrast agents for improved detection, monitoring, and therapy in cancer.
Reshu Saini (S’11) is a medical student at the University of Alabama at Birmingham. He received his M.S. degree from the Department of Biomedical Engineering at the University of Alabama at Birmingham in 2012. He received a B.S. degree in biomedical engineering in 2010 from the University of Alabama at Birmingham. He has been an IEEE Student Member since 2011. Reshu Saini’s research focuses on targeted strategies for improved monitoring of cancer.
Eben Rosenthal is a Julius N. Hicks Professor of Surgery at the University of Alabama at Birmingham. He received his M.D degree in 1994 from the University of Michigan Medical School, Ann Arbor, MI. He did his intern year in general surgery from 1994 to 1995, followed by residency in Otolaryngology at the University of Michigan Medical Center from 1995 to 2000. He then completed a fellowship in facial plastic and reconstructive surgery at Oregon Health Sciences University from 2000 to 2001, and then moved to the University of Alabama at Birmingham.
Dr. Rosenthal’s research interests focus on microvascular reconstruction of the head and neck, head and neck oncology, optical imaging in the operating room, and targeted therapy for head and neck cancer.

Jason M. Warram is a post-doctoral fellow in the Department of Radiology at the University of Alabama at Birmingham, Birmingham, AL. He received his B.A. degree in 2002 in biology and his Ph.D. degree in 2011 in pathology, both from the University of Alabama at Birmingham. Dr. Warram’s research interests include characterization of malignant glioma using current and novel probes for PET/CT imaging.

Kurt R. Zinn is a Professor of Radiology and Director of the Division of Advanced Medical Imaging Research and Multimodality Imaging Lab at the University of Alabama at Birmingham. He earned his Ph.D. degree in biochemisty, his M.S. degree in chemistry, and his D.V.M. degree from the University of Missouri–Columbia, Columbia, MO. Since 1995, he has focused his efforts on molecular imaging in small animal models, with the goal of translating imaging approaches to clinical trials so that human health can be improved.

Kenneth Hoyt (M’99) is an Assistant Professor in the Departments of Radiology, Biomedical Engineering, and Electrical and Computer Engineering at the University of Alabama at Birmingham (UAB). He has been an IEEE Member since 1999. He received a B.S. degree in electrical engineering from Drexel University, Philadelphia, PA, in 2001; followed by M.S. and Ph.D. degrees in biomedical engineering in 2004 and 2005, respectively, from the same institution. He completed a postdoctoral fellowship in the Department of Electrical and Computer Engineering at the University of Rochester before moving to the University of Alabama at Birmingham in 2008. Dr. Hoyt is also an Associate Scientist in the Comprehensive Cancer Center and the Center for Clinical and Translational Science at UAB. He received the American Institute of Ultrasound in Medicine New Investigator Award in 2010. Dr. Hoyt received an M.B.A. degree from the UAB School of Business in 2011.
Dr. Hoyt’s research focuses on the development of novel ultrasound imaging strategies for early cancer detection in addition to using these techniques for monitoring early therapeutic response. To date, technology development has centered on tissue elasticity imaging, molecular ultrasound imaging, and volumetric contrast-enhanced ultrasound imaging methods. Additionally, he continues to explore novel uses of ultrasound contrast agents such as in drug delivery and therapeutic enhancement.
Contributor Information
Anna G. Sorace, Department of Biomedical Engineering, University of Alabama at Birmingham, Birmingham, AL.
Reshu Saini, Department of Biomedical Engineering, University of Alabama at Birmingham, Birmingham, AL.
Eben Rosenthal, Department of Surgery, University of Alabama at Birmingham, Birmingham, AL.
Jason M. Warram, Department of Radiology, University of Alabama at Birmingham, Birmingham, AL
Kurt R. Zinn, Department of Radiology, University of Alabama at Birmingham, Birmingham, AL. Comprehensive Cancer Center, University of Alabama at Birmingham, Birmingham, AL
Kenneth Hoyt, Email: hoyt@uab.edu, Department of Biomedical Engineering, University of Alabama at Birmingham, Birmingham, AL. Department of Radiology, University of Alabama at Birmingham, Birmingham, AL. Comprehensive Cancer Center, University of Alabama at Birmingham, Birmingham, AL.
References
- 1.American Cancer Society. Am Cancer Soc. Atlanta, GA: 2011. Cancer facts and figures 2011. [Google Scholar]
- 2.Orive G, Hernandex RM, Rodriguez Gascon A, Dominguex-Gil A, Pedraz JL. Drug delivery in biotechnology: Present and future. Curr Opin Biotechnol. 2003;14(6):659–664. doi: 10.1016/j.copbio.2003.10.007. [DOI] [PubMed] [Google Scholar]
- 3.Carter P. Improving the efficacy of antibody-based cancer therapies. Nat Rev Cancer. 2001;1(2):118–129. doi: 10.1038/35101072. [DOI] [PubMed] [Google Scholar]
- 4.Casadevall A, Dadachova E, Pirofski L. Passive antibody therapy for infectious diseases. Nat Rev Microbiol. 2004;2(9):695–703. doi: 10.1038/nrmicro974. [DOI] [PubMed] [Google Scholar]
- 5.Maeda H, Tominaga K, Iwanaga K, Nagao F, Habu M, Tsujisawa T, Seta Y, Toyoshima K, Fukuda J, Nishihara T. Targeted drug delivery system for oral cancer therapy using sonoporation. J Oral Pathol Med. 2009;38(7):572–579. doi: 10.1111/j.1600-0714.2009.00759.x. [DOI] [PubMed] [Google Scholar]
- 6.Rudin M, Weissleder R. Molecular imaging in drug discovery and development. Nat Rev Drug Discov. 2003;2(2):123–131. doi: 10.1038/nrd1007. [DOI] [PubMed] [Google Scholar]
- 7.Licha K, Olbrich C. Optical imaging in drug discovery and diagnostic applications. Adv Drug Deliv Rev. 2005;57(8):1087–1108. doi: 10.1016/j.addr.2005.01.021. [DOI] [PubMed] [Google Scholar]
- 8.de Jong N, Frinking PJ, Bouakaz I, ten Cate FJ. Detection of procedures of ultrasound contrast agents. Ultrasonics. 2000;38(1–8):87–92. doi: 10.1016/s0041-624x(99)00071-2. [DOI] [PubMed] [Google Scholar]
- 9.Gramiak R, Shah PM. Echocardiography of the aortic root. Invest Radiol. 1968;3(5):356–366. doi: 10.1097/00004424-196809000-00011. [DOI] [PubMed] [Google Scholar]
- 10.Ferrara K, Pollard R, Borden M. Ultrasound microbubble contrast agents: Fundamentals and application to gene and drug delivery. Annu Rev Biomed Eng. 2007;9:415–447. doi: 10.1146/annurev.bioeng.8.061505.095852. [DOI] [PubMed] [Google Scholar]
- 11.Armstrong WF, Mueller TM, Kinney EL, Tickner EG, Dillon JC, Feigenbaum H. Assessment of myocardial perfusion abnormalities with contrast-enhanced two-dimensional echocardiography. Circulation. 1982;66(1):166–173. doi: 10.1161/01.cir.66.1.166. [DOI] [PubMed] [Google Scholar]
- 12.Dalecki D. Mechanical bioeffects of ultrasound. Annu Rev Biomed Eng. 2004;6:229–248. doi: 10.1146/annurev.bioeng.6.040803.140126. [DOI] [PubMed] [Google Scholar]
- 13.Kinoshita M, McDannold N, Jolesz FA, Hynynen K. Targeted delivery of antibodies through the blood-brain barrier by MRI-guided focused ultrasound. Biochem Biophys Res Commun. 2006;340(4):1085–1090. doi: 10.1016/j.bbrc.2005.12.112. [DOI] [PubMed] [Google Scholar]
- 14.van Wamel A, Bouakaz A, de Jong N. Duration of ultrasound bubbles enhanced membrane permeability. Proc 2003 IEEE Ultrasonics Symp. :917–920. [Google Scholar]
- 15.van Wamel A, Kooiman K, Harteveld M, Emmer M, ten Cate FJ, Versluis M, de Jong N. Vibrating microbubbles poking individual cells: Drug transfer into cells via sonoporation. J Control Release. 2006;112(2):149–155. doi: 10.1016/j.jconrel.2006.02.007. [DOI] [PubMed] [Google Scholar]
- 16.Raymond SB, Treat LH, Dewey JD, McDannold NJ, Hynynen K, Bacskai BJ. Ultrasound enhanced delivery of molecular imaging and therapeutic agents in Alzheimer’s disease mouse models. PLoS ONE. 2008;3(5):art. no. e2175. doi: 10.1371/journal.pone.0002175. [DOI] [PMC free article] [PubMed] [Google Scholar]
- 17.Bekeredjian R, Kroll RD, Fein E, Tinkov S, Coester C, Winter G, Katus HA, Kulaksiz H. Ultrasound targeted microbubble destruction increases capillary permeability in hepatomas. Ultrasound Med Biol. 2007 Oct;33(10):1592–1598. doi: 10.1016/j.ultrasmedbio.2007.05.003. [DOI] [PubMed] [Google Scholar]
- 18.Sorace AG, Warram JM, Umphrey H, Hoyt K. Microubble-mediated ultrasonic techniques for improved drug delivery in cancer. J Drug Target. 2012;20(1):43–54. doi: 10.3109/1061186X.2011.622397. [DOI] [PMC free article] [PubMed] [Google Scholar]
- 19.Escoffre JM, Piron J, Novell A, Bouakaz A. Doxorubicin delivery into tumor cells with ultrasound and microbubbles. Mol Pharm. 2011;8(3):799–806. doi: 10.1021/mp100397p. [DOI] [PubMed] [Google Scholar]
- 20.Uhlemann C, Heinig B, Wollina U. Therapeutic ultrasound lower extremity wound management. Int J Low Extrem Wounds. 2003;2(3):152–157. doi: 10.1177/1534734603257988. [DOI] [PubMed] [Google Scholar]
- 21.Breuing K, Bayer L, Neuwalder J, Orgill DP. Early experience using low-frequency ultrasound in chronic wounds. Ann Plast Surg. 2005;55(2):183–187. doi: 10.1097/01.sap.0000168695.20350.07. [DOI] [PubMed] [Google Scholar]
- 22.Miller DL, Pislaru SV, Greenleaf JE. Sonoporation: Mechanical DNA delivery by ultrasonic cavitation. Somat Cell Mol Genet. 2002;27(1–6):115–134. doi: 10.1023/a:1022983907223. [DOI] [PubMed] [Google Scholar]
- 23.Wu J, Pepe J, Rincon M. Sonoporation, anti-cancer drug and antibody delivery using ultrasound. Ultrasonics. 2006;44(suppl 1):e21–35. doi: 10.1016/j.ultras.2006.06.033. [DOI] [PubMed] [Google Scholar]
- 24.Hosseinkhani H, Aoyama T, Ogawa O, Tabata Y. Ultrasound enhanced the transfection of plasmid DNA by non-viral vectors. Curr Pharm Biotechnol. 2003;4(2):109–122. doi: 10.2174/1389201033489883. [DOI] [PubMed] [Google Scholar]
- 25.Mukherjee D, Wong J, Griffin B, Ellis SG, Porter T, Sen S, Thomas JD. Ten-fold augmentation of endothelial uptake of vascular endothelial growth factor with ultrasound after systemic administration. J Am Coll Cardiol. 2000;35(6):1678–1686. doi: 10.1016/s0735-1097(00)00575-1. [DOI] [PubMed] [Google Scholar]
- 26.Heath CH, Sorace A, Knowles J, Rosenthal E, Hoyt K. Microbubble therapy enhanced anti-tumor properties of cisplatin and cetuximab in vitro and in vivo. Otolaryngol Head Neck Surg. 2012;146(6):938–945. doi: 10.1177/0194599812436648. [DOI] [PMC free article] [PubMed] [Google Scholar]
- 27.Figg WD, McLeod HL. Handbook of AntiCancer Pharmacokinetics and Pharmacodynamics. Totown, NJ: Humana Press; 2004. Engineered antibodies and immunotoxins. [Google Scholar]
- 28.Abulrob A, Brunette E, Slinn J, Baumann E, Stanimirovic D. Permeability Barrier. Totown, NJ: Humana Press; 2011. In vivo optical imaging of ischemic blood–brain barrier disruption. [DOI] [PubMed] [Google Scholar]
- 29.Stadlmann J, Pabst M, Kolarich D, Kunert R, Altmann F. Analysis of immunoglobulin glycosylation by LC-ESI-MS of glycopeptides and oligosaccharides. Proteomics. 2008;8(14):2858–2871. doi: 10.1002/pmic.200700968. [DOI] [PubMed] [Google Scholar]
- 30.Eribitux Insert, Eribitux Drug Description. Bristol-Myers Squibb Co; Princeton, NJ: 2011. [Google Scholar]
- 31.Presta LG, Chen H, O’Connor SJ, Chisholm V, Meng YG, Krummen L, Winkler M, Ferrara N. Humanization of an anti-vascular endothelial growthfactor monoclonal antibody for the therapy of solid tumors and other disorders. Cancer Res. 1997;57(20):4593–4599. [PubMed] [Google Scholar]
- 32.G. E. Healthcare. Amersham FluoroLink Cy5.5 Monofunctional Dye 5-pack. G. E. Healthcare; Waukesha, WI: 2011. Product specification sheet. [Google Scholar]
- 33.Abraxane Insert, Abraxane Drug Description. Abraxis BioScience Inc., Celgene Corp; Summit, NJ: 2011. [Google Scholar]
- 34.Buchsbaum DJ, Zhou T, Grizzle WE, Oliver PG, Hammond CJ, Zhang S, Carpenter M, LoBulio AF. Antitumor efficacy of TRA-8 anti-DR5 monoclonal antibody alone or in combination with chemotherapy and/or radiation therapy in a human breast cancer model. Clin Cancer Res. 2003;9(10 pt 1):3731–3741. [PubMed] [Google Scholar]
- 35.Zhao YH, Lu CT, Zhou ZC, Jin Z, Zhang L, Sun CZ, Xu YY, Gao HS, Tian JL, Gao FH, Tang QQ, Li W, Xiang Q, Li XK, Li WF. Enhancing chemotherapeutic drug inhibition on tumor growth by ultrasound: An in vivo experiment. J Drug Target. 2011;19(2):154–160. doi: 10.3109/10611861003801834. [DOI] [PubMed] [Google Scholar]
- 36.Gibson AP, Hebden JC, Arridge SR. Recent advances in diffuse optical imaging. Phys Med Biol. 2005;50(4):R1–R43. doi: 10.1088/0031-9155/50/4/r01. [DOI] [PubMed] [Google Scholar]
- 37.Hebden JC, Arridge SR, Delpy DT. Optical imaging in medicine. I. Experimental techniques. Phys Med Biol. 1997;42(5):825–840. doi: 10.1088/0031-9155/42/5/007. [DOI] [PubMed] [Google Scholar]
- 38.Arridge SR, Hebden JC. Optical imaging in medicine II. Modeling and reconstruction. Phys Med Biol. 1997;42(5):841–853. doi: 10.1088/0031-9155/42/5/008. [DOI] [PubMed] [Google Scholar]
- 39.Lee BI, Min JJ. Molecular imaging using bioluminescence. Open Nucl Med J. 2010;2:157–165. [Google Scholar]
- 40.Hawrysz DJ, Sevick-Muraca EM. Developments toward diagnostic breast cancer imaging using near-infrared optical measurements and fluorescent contrast agents. Neoplasia. 2000;2(5):388–417. doi: 10.1038/sj.neo.7900118. [DOI] [PMC free article] [PubMed] [Google Scholar]
- 41.Frangioni JV. In vivo near-infrared fluorescence imaging. Curr Opin Chem Biol. 2003;7(5):626–634. doi: 10.1016/j.cbpa.2003.08.007. [DOI] [PubMed] [Google Scholar]
- 42.Mahmood U, Tung CH, Bogdanov A, Weissleder R. Near-infrared optical imaging of protease activity for tumor detection. Radiology. 1999;213(3):866–870. doi: 10.1148/radiology.213.3.r99dc14866. [DOI] [PubMed] [Google Scholar]
- 43.Petrovsky A, Schellenberger E, Josephson L, Weissleder R, Bogdanov A. Near-infrared fluorescent imaging of tumor apoptosis. Cancer Res. 2003;63(8):1936–1942. [PubMed] [Google Scholar]