

Abstract
Family history and poor preliteracy skills (referred to here as familial and behavioral risk, respectively) are critical predictors of developmental dyslexia. This study systematically investigated the independent contribution of familial and behavioral risks on brain structures, which had not been explored in past studies. We also examined the differential effects of maternal versus paternal history on brain morphometry, and familial risk dimensionally versus categorically, which were also novel aspects of the study. We assessed 51 children (5 to 6 years of age) with varying degrees of familial and behavioral risks for developmental dyslexia and examined associations with brain morphometry. We found that greater maternal history of reading disability was associated with smaller bilateral prefrontal and parieto-temporal grey, but not white matter volumes. Regressing out behavioral risk, socioeconomic status, and maternal education and other confounds did not change the results. No such relationship was observed for paternal reading history and behavioral risk. Results of cortical surface area and thickness further showed that there was a significant negative relationship between cortical surface area (but not thickness) and greater severity of maternal history, in particular within the left inferior parietal lobule, suggesting prenatal influence of maternal history on children’s brain morphometry. The results suggested greater maternal, possibly prenatal, influence on language-related brain structures. These results help to guide future neuroimaging research focusing on environmental and genetic influences and provide new information that may help predict which child will develop dyslexia in the future.
Keywords: MRI, voxel-based morphometry (VBM), brain, dyslexia, reading, risk
1 INTRODUCTION
Developmental dyslexia is a condition characterized by marked yet unexpected difficulty learning to read (Shaywitz and Shaywitz, 2005) affecting approximately 5-10% (up to 17.5%) of children and accounting for 80% of all learning disabilities (Shaywitz, 1998).
A deficit in phonological representations is thought to be the proximal cognitive deficit of the reading problems seen in dyslexia (Shaywitz and Shaywitz, 2005; Swan and Goswami, 1997; Wagner and Torgensen, 1987). While the cause of the disorder is still unknown, two risk factors for dyslexia, familial (having a family history of reading disabilities) and behavioral (having poor reading-related skills prior to formal reading instruction), have been examined extensively albeit independently. Perhaps the lack of independence is because pre-readers with a family history of reading impairment often have poor reading-related ability (Specht et al., 2009), making it difficult to disentangle whether these abnormalities in the brain stem from having a familial or behavioral risk.
There is increasing evidence to suggest that the reading difficulties seen in dyslexia have neurobiological substrates. Functional MRI (fMRI) studies regularly report hypoactivation of left parieto-temporal and occipito-temporal regions (subserving phonological and orthographic processes) during reading in individuals with dyslexia (reviewed in(Gabrieli, 2009; Maisog et al., 2008; Richlan et al., 2009; Shaywitz and Shaywitz, 2008). In dyslexia, hyperactivation during reading, most typically in bilateral inferior frontal gyrus (IFG) (Brunswick et al., 1999; Georgiewa et al., 2002; Milne et al., 2002; Richards et al., 2002; Rumsey, 1992; Salmelin et al., 1996; Shaywitz et al., 2004; Shaywitz et al., 2002; Shaywitz et al., 1998) or right posterior regions homologous to the hypoactive left hemisphere regions (Shaywitz et al., 2002) may reflect compensatory processes.
To date, only a handful of neuroimaging studies have investigated how familial risk factors for developmental dyslexia influence the brain. Several studies have reported event-related potential (ERP) (Benasich et al., 2006; Guttorm et al., 2009; Leppänen et al., 1999; Lyytinen et al., 2003; Maurer et al., 2003; Torppa et al., 2006) fMRI (Specht et al., 2009) and structural (using voxel-based morphometry, VBM) (Raschle et al., 2010) abnormalities in children with a family history of dyslexia before they receive formal reading instruction compared to those without. These studies indicate that abnormalities are unlikely to be shaped by children’s reading experience. The mechanism in which family history affects children’s pre-reading brains however, remain unknown. We expand on previous studies in four important ways by (1) taking an individual difference approach by examining family history dimensionally as previous studies have taken a categorical approach and compared those with and without family history even though reading skill is along a continuum, (2) dissociating the effects of behavioral and familial risks on brain structure, which correlate highly, (3) dissociating maternal versus paternal influence within family risk, and (4) dissociating prenatal (Kapellou et al., 2006) versus postnatal influence (Landing et al., 2002; Shaw et al., 2008) of maternal history on the brain by examination of cortical surface area and thickness.
2 MATERIAL AND METHODS
2.1 Subjects
A total of 51 healthy, native English-speaking 5- and 6-year old children participated in our study. The majority of children were beginning kindergarteners (N=47) and four were beginning first-graders. Standard behavioral assessment of the participants (children) and parents, socio-economic status (SES) and home environment were assessed (Table 1 and Table 2). Children (with and without family history of reading difficulty based on parental self-report) were recruited from local newspapers, school mailings (including both schools for children with learning disabilities and conventional schools), flyers, and mother’s clubs. Family history was initially defined as parental report of reading disability in a first-degree relative (either biological parent or sibling). Once recruited, as in previous literature, family risk was assessed using the Adult Reading History Questionnaire (ARHQ [referred to as “familial risk index [FamRI]” in this study]) (Lefly and Pennington, 2000). The children (males, 29; females, 22) did not have any neurological or psychiatric disorders, were not on medication, and had no contraindications to MRI. The Stanford University Panel on Human Subjects in Medical Research approved the study and informed consent was obtained.
Table 1.
Demographics
| Measure | Mean (SD) | Range (Min, Max) |
|---|---|---|
|
CHIL
D |
||
| Age | 5.59 (0.42) | 1.96 (5.03, 6.99) |
| Gender | 22 female/29 male |
|
| Socioeconomic status (SES) | 0.00 (1.00) | 5.25 (−2.87, 2.38) |
| Woodcock Johnson III brief intellectual ability (IQ) | 118.59 (10.66) |
47 (92, 139) |
| Woodcock Johnson III verbal comprehension (VIQ) | 121.04 (12.85) |
59 (86, 145) |
| Woodcock Johnson III concept formation (PIQ) | 117.04 (11.43) |
43 (94, 137) |
| Woodcock Johnson III visual matching (Processing Speed-PS) |
105.57 (11.82) |
55 (72, 127) |
| Bx risk index (BxRI) | 0 (19.37) | 81.98 (−45.97, 36.01) |
| Woodcock reading mastery test letter ID-ss (LID) | 110.55 (11.54) |
66 (80, 146) |
| Rapid automized naming color and object-ss (RAN) | 99.35 (15.9 | 73 (56, 129) |
| CTOPP phonological awareness-cs (PA) | 112.51 (14.27) |
69 (76, 145) |
| CTOPP phonological memory-cs (PM) | 106.49 (12.37) |
57 (79, 136) |
| Total grey matter volume (TGMV) | 711.87 (61.46) |
241.93 (589.7, 831.63) |
| Total while matter volume (TWMV) | 454.51 (42.49) |
175.98 (379.9, 555.88) |
|
| ||
| MATERNAL | ||
| Age (Age-M) | 39.07 (4.22) | 18.4 (29.05, 47.45) |
| ARHQ (mFamRI) | 0.31 (0.14) | 0.61 (0.07, 0.67) |
| Percent overall time with child (OT-M) | 70.7 (14.08) | 65 (35, 100) |
| Percent educational time with child (ET-M) | 68.8 (18.39) | 73 (27, 100) |
| Education level (Ed-M) | 17.06 (2.08) | 10 (12, 22) |
| WAIS-R-ss (IQ-M) | 112.75 (5.39) | 26 (94, 120) |
| Verbal IQ-ss (VIQ-M) | 110.88 (8.28) | 31.5 (92.5, 124) |
| Performance IQ-ss (PIQ-M) | 121.06 (6.01) | 31.5 (97, 128.5) |
|
| ||
| PATERNAL | ||
| Age (Age-P) | 42.36 (5.04) | 21.96 (30.81,52.77) |
| ARHQ-paternal (pFamRI) | 0.35 (0.15) | 0.66 (0.09, 0.75) |
| Percent overall time with child (OT-P) | 29.3 (14.07) | 65 (0, 65) |
| Percent educational time with child (ET-P) | 31.2 (18.39) | 73 (0, 73) |
| Education level (Ed-P) | 16.78 (2.08) | 01 (12, 22) |
| WAIS-R-ss (IQ-P) | 112.62 (5.50) | 33 (88, 121) |
| Verbal IQ-ss (VIQ-P) | 109.32 (8.77) | 42 (79, 121) |
| Performance IQ-ss (PIQ-P) | 123.11 (6.81) | 42 (88, 130) |
Table 2.
Demographics of the two groups based on self-report of family history (FH− vs FH+)
| Measure | FH− [mean (SD)] |
FH+ [mean (SD)] |
T-Tests [t(1,49);p] |
|
|---|---|---|---|---|
| CHILD | Age | 5.52 (0.31) | 5.66 (0.52) |
1.11; 0.27 |
| Gender | 12 female/15 male |
10 female/1 4 male |
χ2 (1, N=51)= 0.19, p = 0.66 |
|
| Socioeconomic status (SES) | 0.09 (1.13) | −0.10 (0.84) |
0.65; 0.522 | |
| Woodcock Johnson III brief intellectual ability-ss (IQ) |
122.67 (10.07) |
114.0 (9.55) |
3.14; 0.003 | |
| Woodcock Johnson III verbal comprehension-ss (VIQ) |
128.26 (9.11) |
112.92 (11.62) |
5.28; 0.000 | |
| Woodcock Johnson III concept formation- ss (PIQ) |
118.70 (10.9) |
115.17 (11.96) |
1.11; 0.270 | |
| Woodcock Johnson III visual matching-ss (Processing Speed-PS) |
106.89 (13.40) |
104.08 (9.79) |
0.84; 0.400 | |
| Bx risk index (BxRI) | −7.16 (18.99) | 8.05 (16.74) |
3.02; 0.004 | |
| Woodcock reading mastery test letter ID- ss (LID) |
114.19 (12.7) |
106.46 (8.62) |
2.51; 0.015 | |
| Rapid automized naming color and object-ss (RAN) |
103.07 (14.36) |
95.17 (16.81) |
1.81; 0.076 | |
| CTOPP phonological awareness-cs (PA) | 117.63 (13.36) |
106.75 (13.25) |
2.91; 0.005 | |
| CTOPP phonological memory-cs (PM) | 110.78 (12.32) |
101.67 (10.72) |
2.80; 0.007 | |
| Total grey matter volume (TGMV) | 723.92 (63.69) |
698.32 (57.13) |
1.50; 0.139 | |
| Total while matter volume (TWMV) | 460.98 (40.74) |
447.23 (44.09) |
1.16; 0.253 | |
|
| ||||
|
MATER
NAL |
Age (Age-M) | 38.74 (4.53) | 39.45 (3.92) |
0.59; 0.556 |
| ARHQ (MFamRI) | 0.24 (0.09) | 0.38 (0.15) |
3.84; 0.000 | |
| Percent overall time with child (OT-M) | 72.15 (12.8) | 68.81 (15.73) |
0.79; 0.430 | |
| Percent educational time with child (ET- M) |
65.71 (18.22) |
72.72 (18.30) |
1.30; 0.201 | |
| Education level (Ed-M) | 17.22 (2.33) | 16.88 (1.80) |
0.59; 0.557 | |
| WAIS-R-ss (IQ-M) | 114.33 (4.40) |
110.96 (5.90) |
2.33; 0.024 | |
| Verbal IQ-ss (VIQ-M) | 113.61 (7.00) |
107.81 (8.66) |
2.64; 0.011 | |
| Performance IQ-ss (PIQ-M) | 122.23 (5.27) |
119.69 (6.60) |
1.56; 0.126 | |
|
| ||||
|
PATER
NAL |
Age (Age-P) | 41.56 (4.67) | 43.35 (5.39) |
1.25; 0.218 |
| ARHQ (PFamRI) | 0.29 (0.10) | 0.41 (0.17) |
2.96; 0.005 | |
| Percent overall time with child (OT-P) | 27.79 (12.77) |
31.17 (15.74) |
0.80; 0.430 | |
| Percent educational time with child (ET-P) | 34.26 (18.22) |
27.23 (18.30) |
1.29; 0.202 | |
| Education level (Ed-P) | 17.22 (2.26) | 16.26 (1.76) |
1.66; 0.104 | |
| WAIS-R-ss (IQ-P) | 113.96 (3.90) |
110.80 (6.82) |
2.01; 0.050 | |
| Verbal IQ-ss (VIQ-P) | 110.72 (7.96) |
107.43 (9.65) |
1.28; 0.206 | |
| Performance IQ-ss (PIQ-P) | 124.67 (3.51) |
121.00 (9.33) |
1.88; 0.067 | |
2.2 Self (parental)-report of Family History
Among the group where the parents reported of having a reading disability (self [parental]-report of family history group, selfFH+ group, N=24, age: mean, 5.66; SD, 0.52), 12 children had paternal history (four with previous formal diagnosis and one with a sibling, with formal diagnosis), 10 had maternal history (four with previous formal diagnosis), and two had both maternal and paternal history (both not formally diagnosed). In the self-reported group without family history (selfFH− group, N=27, age: mean, 5.52; SD, 0.31) there was no report of maternal, paternal or sibling reading impairment history for any family, though three families did report having a member of their extended family with such impairment.
The demographics of the two self-reported family history groups (with [selfFH+] vs. without [selfFH−]) (e.g., child age, parent age, socio-economic status [SES], maternal and paternal education level, percentage of time spent with mother and father overall and related to education) were not significantly different (Table 2).
2.3 Familial Risk Index (FamRI)
We operationally defined familial risk or “Maternal and Paternal Familial Risk Indices (mFamRI, pFamRI),” as the maternal and paternal scores from the Adult Reading History Questionnaire (ARHQ), a commonly used, valid and reliable self-rating assessment of past reading disability in adults (Lefly and Pennington, 2000). Greater scores on the ARHQ indicate more reading impairment during childhood. Paternal (mean: 0.35; SD: 0.15) and maternal (mean: 0.31; SD: 0.14) ARHQ scores were not significantly different from each other (t(49)=1.42, p=0.16). While using neuropsychological tests of reading is more ideal to assess current and past reading (dis)ability in the parents, we opted to choose ARHQ scores because reading scores (Test of Word Reading Efficiency Phonemic Decoding Efficiency [TOWRE PDE], a timed measure of decoding) were not available on all parents. In the available data (N=36), however, intraclass correlation (ICC) (used to measure the correlation of units within groups rather than traditional observations that are based on pairs) and receiver operating characteristic (ROC) (a graphical plot of the sensitivity versus the specificity for a binary classifier where the threshold is variable) analyses were performed to investigate the reliability of ARHQ scores. ICC calculation using a 2-way random effects ANOVA model and absolute agreement (ICC(2,1) showed a Cronbach’s alpha estimate of 0.67 and ICC of 0.67 (F(35,35)=3.004, p=0.001)).
We further performed ROC analysis to examine ideal cut-off ARHQ score for past reading disability. While the original research suggested a cut-off score of 0.3 (Lefly and Pennington, 2000), more recent neuroimaging research using ARHQ has used a cut-off score of 0.4 (e.g., (Maurer et al., 2007; Maurer et al., 2009; Maurer et al., 2003). When criteria of current decoding dysfunction and suspected past reading disability was defined as a TOWRE PDE score of 90 (25th percentile), and an ARHQ score of 0.385, sensitivity was 100% and specificity 77.1%. When self-report of past reading disability was used as criteria of past reading disability, at an ARHQ score of 0.375, sensitivity was 90% and specificity 88.5%. These ARHQ scores of 0.385 and 0.375 are similar to what past neuroimaging studies have used in their study as a cut-off score (= 0.40) (Maurer et al., 2007; Maurer et al., 2009; Maurer et al., 2003). They, too, validated using neuropsychological testing (Maurer et al., 2003). Together with the ICC analyses, the results show that ARHQ score is a good indicator of past and current reading ability in adults.
Using an ARHQ cut-off score >0.4, 24 (out of 51) families met the criteria for family history; 9 had only mothers, 17 had only fathers, and 2 had both mothers and fathers who met the criteria for reading difficulty. There were no significant correlations identified between ARHQ scores (maternal and paternal) and demographic information such as SES (or any of the individual factors such as education and occupation) or percentage of time spent with child generally and related to educational activities specifically (all p’s>0.05).
2.4 Behavioral Risk Index (BxRI)
Behavioral risk (or BxRI) was defined as a composite measure of phonological awareness (PA; combined score [cs] of the Elision and Blending Words subtests in Comprehensive Test of Phonological Processing [CTOPP]) (Wagner et al., 1999) rapid naming (RN; mean ss of Color and Object subtests in Rapid Automatized Naming Test [RAN]) (Wolf and Denckla, 2005) and letter identification (LID; Letter Identification [LID] subtest in Woodcock-Johnson III Tests of Achievement [WJ-III-Ach]) (Woodcock, 1998). These three measures have been identified as predictors of reading achievement in previous studies (e.g.(Lyytinen et al., 2008; Lyytinen et al., 2006; Puolakanaho et al., 2007). BxRI was defined as the first eigenvariate of PA, RN and LID scores, and explained 63.2% of the total variance. Higher BxRI scores indicate more impairment in these measures.
2.5 Intelligence and Literacy Skills
The Woodcock-Johnson III Tests of Cognitive Abilities Brief Intellectual Ability (WJIII-BIA), which was used as a measure of intelligence, is comprised of three subtests: Verbal Comprehension, Concept Formation, and Visual Matching. The three subtests in part respectively measure Comprehension-Knowledge (Gc), Fluid Reasoning (Gf), and Processing Speed (Gs), which represent the best sample of an individual’s verbal ability, thinking ability, and efficiency in performing cognitive tasks (Mather and Woodcock, 2001). Full-scale IQ showed significant negative correlation with mFamRI (i.e., the greater the maternal history of reading impairment, the lower the child’s IQ, p<0.05 uncorrected for multiple comparison, not significant when Bonferroni corrected), although all children had average to superior IQ (Figure 1). Further, selfFH− was significantly greater than selfFH+ for full-scale IQ (p=0.003) and verbal IQ (VIQ, p<0.001), though performance IQ (PIQ) was not significantly different from each other (p=0.27) (Table 2).
Figure 1. Associations among familial risk index (FamRI), behavioral risk index (BxRI) (marked in black boxes) and various demographic, behavioral and brain measures.

Upper left figure represents correlation coefficients (R) and lower right represents significance level (P). Black boxes are shown to easily identify factors that are associated the FamRI and BxRI. In the lower right, comparisons in red (p<0.001) are those that are significant even after Bonferroni correction. Age: child’s age in years, SES: socioeconomic status, IQ: Woodcock Johnson III brief intellectual ability standard score (-ss), VIQ: Woodcock Johnson III verbal comprehension-ss, PIQ: Woodcock Johnson III concept formation-ss, LID: WRMT Letter ID subtest -ss, RN: rapid automatized naming color and object subtests average –ss, PA: phonological awareness composite score of CTOPP, BxRI: composite measure of PA, RN and LID, PM: phonological memory composite score of CTOPP, TGMV: total grey matter volume, TWMV: total white matter volume, Age-M: maternal age, mFamRI: maternal ARHQ score, OT-M: percent overall maternal time with child, ET-M: percent of maternal educational time with child, Ed-M: maternal educational level, IQ-M: maternal estimated full-scale IQ from WAIS-R, VIQ-M: maternal estimated verbal IQ from WAIS-R, PIQ-M: maternal estimated performance IQ from WAIS-R, -P refers to parental scores. For example, one can see that BxRI is negatively correlated LID, RN, and PA (all p’s<0.001). mFamRI is significantly correlated with many other measures in the figure, but pFamRI is not significantly correlated with these measures except for IQ-P, VIQ-P, PIQ-P and child’s VIQ.
For results from the tests of literacy skills, the Behavioral Risk Index (BxRI), phonological awareness (PA), rapid naming (RN) and letter identification (LID) were highly correlated amongst each other. Recall BxRI was defined as the first eigenvariate of PA, RN and LID scores. In general, these measures considered as markers for precursors of reading, weakly but significantly negatively correlated with mFamRI (p<0.05 uncorrected, n.s. after Bonferroni correction) but not with pFamRI (Figure 1). On all measures (PA, LID, and only marginally for RN) self-reported FH+ underperformed FH− (Table 2), suggesting greater impairment of literacy-related skills in the selfFH+ group (Table 2).
2.6 Parental Intelligence and Literacy skills
To measure IQ in parents, all mothers and fathers (except four fathers) completed the Shipley Institute of Living Scale (SILS) (Zachary, 2006), which is a self-administered intelligence measure used in place of the Wechsler Adult Intelligence Scale-Revised (WAIS-R) (that would have required the parent to complete the test with a researcher). We then converted the scores on the SILS to the WAIS-R. Specifically, from the SILS the total raw score along with raw scores on the vocabulary (corresponding to VIQ) and the abstract thinking (corresponding to PIQ) subscales were totaled and converted to a Wechsler Adult Intelligence Scale-Revised (WAIS-R) standard score (WAIS-ss) using standard conversion tables. The SILS and WAIS are correlated ranging from 0.73 to 0.90 depending on the study (Zachary, 2006). The scores on the WAIS-R converted from SILS indicated that all IQ fell within the average to superior range (Table 1). Both maternal and paternal ARHQ scores were significantly greater (i.e. showing more impaired reading) for selfFH+ than selfFH− (Table 2).
2.7 Home environment
To determine whether the selfFH+ and selfFH− groups were similar in terms of elements within the home that are related to children’s reading achievement, we examined socioeconomic status (SES). SES was measured based on the procedure and questionnaire of Noble et al (2006). Parents completed a brief questionnaire with items related to parental education, occupation and income (income data for five families were not available and thus an SES score could not be calculated for them). Parental education was defined as the average education of any parents (and stepparents/guardians) in the home (education level for one father was not available). We used the 9-point Hollingshead Index Occupational Status Scale (Bornstein and Bradley, 2003) to score parental occupation, and used only the highest score of any parent, stepparent or guardian in the home. The income score was defined as the total family income divided by the official federal poverty threshold for a family of that size. Thus, for each family, an income-to-needs ratio was computed whereby the total family income was divided by official poverty threshold. Finally, a composite SES score was calculated for each child by factor analyzing the three scores (parental education, occupation, and income) using principal component analysis. A single principal component emerged, accounting for 57.1% of the variance. SES in our study refers to the factor loading score (mean 0; SD 1) that was computed for each child and entered into our subsequent analyses. SES was not significantly correlated with ARHQ (mFamRI: r=0.14, p=0.36; pFamRI: r=−0.19, p=0.22; Figure 1) or maternal IQ (r=0.16, p=0.29), though the correlation with paternal IQ was tending toward significance (r=0.28, p=0.07). It appears significance was due to paternal VIQ (r=.35, p=0.02) rather than paternal PIQ (r=0.15, p=0.35) (Table 2).
2.8 MRI Data Acquisition
Imaging data were acquired in the summer and fall of 2008 and 2009 at the Richard M. Lucas Center for Imaging at Stanford University. Imaging data was acquired using GE Healthcare 3.0 Tesla 750 scanner 20.x software revision and an 8-channel phased array head coil (GE Healthcare, Waukesha, WI). Images acquired included an axial-oblique 3D T1-weighted sequence (fast spoiled gradient recalled echo [FSPGR] pulse sequence, inversion recovery preparation pulse TI=400 ms; repetition time [TR]=8.5 ms; echo-time [TE]=3.4 ms; flip angle=15°; Receiver ban dwidth ±32 kHz; slice thickness=1.2 mm; 128 slice locations; number of excitations [number of signals averaged]=1; field-of-view [FOV]=22 cm; Phase FOV 0.75; acquisition matrix=256 × 192). The total time of scan was 4:34.
To prepare for the scan, families received a packet of materials, including a CD of scanner noises and a DVD of a child going into a scanner, designed to desensitize him/her to the scanner sounds and environment. Children also participated in simulated MRI sessions at the center.
2.9 Preprocessing of MR images
Preprocessing was carried out using the Statistical Parametric Mapping 8 (SPM8) statistical package (http://www.fil.ion.ucl.ac.uk/spm) including the Diffeomorphic Anatomical Registration Through Exponentiated Lie Algebra (DARTEL) toolbox (Ashburner, 2007). Images were bias-field corrected and segmented to grey matter (GM), white matter (WM) and cerebro-spinal fluid (CSF) using the New Segment feature of SPM8. The images were spatially normalized (to MNI space), modulated and smoothed (8-mm isotropic Gaussian kernel) using the DARTEL toolbox and default settings. For each participant, segmentation and normalization accuracy were manually inspected.
2.10 Analyses of Regional GM Volume (GMV) and WM Volume (WMV)
Voxel-based morphometry (VBM) analyses of regional GMV and WMV were examined using SPM8 and was corrected for non-isotropic smoothness. Statistical threshold for whole-brain analyses was set at p=0.01 for voxel height and p=0.05 family-wise error corrected for extent while also correcting for non-stationary smoothness (p=0.05 corrected). Whole-brain correlation analyses were performed between regional GMV and WMV with the following dependent measures; mFamRI, pFamRI and BxRI. Total GMV (TGMV) and total WMV (TWMV) were included as nuisance variables in all analyses. To investigate the effect of FamRI without the effect of BxRI and vice versa, these analyses were repeated by including BxRI as a nuisance variable when examining the brain correlates of FamRI, and mFamRI as a nuisance variable when examining BxRI.
Possible confounding factors (age, beginning first-graders [N=4], left-handedness [N=5] or manual dexterity index, year of study entry [Phase I: 2008, N=27, Phase II: 2009, N=24], IQ [WJ BIA], father spent more time with child [N=1 spent more total time with father, N=3 spent more education-related time with father]) were controlled by regressing these measures out as nuisance variables or by excluding children who were already in first grade, left-handed, or whose father spent more time with the child. These were performed both at the whole-brain voxel-by-voxel level and also by extracting the mean values of each region that showed a significant effect (i.e., bilateral prefrontal, left parieto-temporal and right parieto-temporal regions in which GMV was significantly negatively correlated with mFamRI). Mean values of each cluster were extracted using REX (http://web.mit.edu/swg/software.htm). The results were similar (children that are left-handed and 1st graders are marked in Figure 4).
Figure 4. Visual representation of correlations between Family Risk Index (FamRI) and mean regional grey matter volume (GMV) of all significant clusters in Figure 2b combined and adjusted for total GMV and behavioral risk index (Bx RI).

Results were similar for each cluster hence are combined here. Red filled circles and blue squares represent those children who either a. spent more education-related time with father (of these, only one spent total time more with their father), which showed similar effects as plotting those who spent more total time with father, b. are left-handed, c. first-graders at the time of testing, or d. were in Phase I (entered study in 2008 Summer) as opposed to Phase II (entered study in 2009 Summer). While the plots only show qualitatively how these factors were not driving our results, the results are consistent with the primary analyses where we regressed out these effects (a, b, c and d) or excluded these particular children from the analyses (a, b and c).
To examine the effect of scan year, we also performed whole-brain voxel-by-voxel independent t-tests between Phase I (2008, N=27) and Phase II (2009; N=24) scans. Clusters were located using XJview (http://www.alivelearn.net/xjview8/) and by visual inspection of clusters overlaid on the templates.
2.11 Free Surfer Analysis
Cortical reconstruction and volumetric segmentation were performed with the FreeSurfer image analysis suite version 5.0.0, which is documented and freely available for download online (http://surfer.nmr.mgh.harvard.edu/). The technical details of these procedures are described in prior publications (Dale et al., 1999; Dale and Sereno, 1993; Fischl and Dale, 2000; Fischl et al., 2001; Fischl et al., 2002; Fischl et al., 2004a; Fischl et al., 1999a; Fischl et al., 1999b; Fischl et al., 2004b; Han et al., 2006; Jovicich et al., 2006; Segonne et al., 2004). Briefly, this processing includes motion correction and averaging of multiple volumetric T1 weighted images (when more than one is available), removal of non-brain tissue using a hybrid watershed/surface deformation procedure (Segonne et al., 2004), automated Talairach transformation, segmentation of the subcortical white matter and deep gray matter volumetric structures (including hippocampus, amygdala, caudate, putamen, ventricles) (Fischl et al., 2002; Fischl et al., 2004a) intensity normalization (Sled et al., 1998), tessellation of the gray matter white matter boundary, automated topology correction (Fischl et al., 2001; Segonne et al., 2007), and surface deformation following intensity gradients to optimally place the gray/white (main) and gray/cerebrospinal fluid (pial) borders at the location where the greatest shift in intensity defines the transition to the other tissue class (Dale et al., 1999; Dale and Sereno, 1993; Fischl and Dale, 2000). The main and pial surfaces were visually inspected, and where needed, the appropriate manual corrections were preformed as per the FreeSurfer Tutorial (http://surfer.nmr.mgh.harvard.edu/fswiki/FsTutorial). All raters were trained to achieve inter-rater reliability of ≥0.95 (intraclass correlation coefficient) with gold-standard datasets for volumetric regions of interest.
Once the cortical models are complete, a number of deformable procedures can be performed for in further data processing and analysis including surface inflation (Fischl et al., 1999a) registration to a spherical atlas which utilized individual cortical folding patterns to match cortical geometry across subjects (Fischl et al., 1999b), parcellation of the cerebral cortex into units based on gyral and sulcal structure (Desikan et al., 2006; Fischl et al., 2004b), and creation of a variety of surface based data including maps of curvature and sulcal depth. This method uses both intensity and continuity information from the entire three dimensional MR volume in segmentation and deformation procedures to produce representations of cortical thickness, calculated as the closest distance from the gray/white boundary to the gray/CSF boundary at each vertex on the tessellated surface (Fischl and Dale, 2000). The maps are created using spatial intensity gradients across tissue classes and are therefore not simply reliant on absolute signal intensity. The maps produced are not restricted to the voxel resolution of the original data thus are capable of detecting submillimeter differences between groups. Procedures for the measurement of cortical thickness have been validated against histological analysis (Rosas et al., 2002) and manual measurements (Kuperberg et al., 2003; Salat et al., 2004). Freesurfer morphometric procedures show good test-retest reliability across scanner manufacturers and across field strengths (Han et al., 2006).
We focused on brain regions and measures that were supported both by our main VBM analyses and by the past literature on dyslexia (Frye et al.). These included cortical surface area and thickness of bilateral inferior parietal lobule (IPL) and pars opercularis of the inferior frontal gyrus (IFG).
3 RESULTS
3.1 Neuropsychological Results
First we examined relationships between mFamRI, pFamRI, BxRI and other demographic and behavioral measures such as PA, RN, LID (see Figure 1). In general, there was a negative relationship between mFamRI and cognitive and behavioral measures such as PA, LID and IQ (verbal [VIQ] and performance [PIQ]), i.e., the worse the mother’s self-reported past reading difficulties, the lower the child’s reading-related cognitive and behavioral scores. There were no significant correlations with pFamRI and these measures. BxRI was significantly negatively correlated with phonological memory, IQ (VIQ, PIQ), processing speed, maternal IQ and maternal education level. There was a trend for significant positive correlation between BxRI and mFamRI (r=0.24, p=0.088). Correlations that survived correction for multiple comparisons are indicated in red in Figure 1 (lower right panel).
3.2 Regional GM and WM Volumes
There was a significant negative association between mFamRI and voxel-by-voxel GMV, i.e., the more severe the mother’s past reading disability, the lower the child’s GMV, in bilateral prefrontal and parieto-temporal regions (p<0.05 corrected; Figure 2). There was also a trend for significant negative correlation between mFamRI and WMV in the left parieto-temporal region spatially adjacent to the GM finding (p<0.1 corrected; Figure 3a).
Figure 2. Association between regional brain volume and maternal Family Risk Index [mFamRI; FamRI is equivalent to Adult Reading History Questionnaire (ARHQ) scores].

a. Brain regions where there were significant negative association between grey matter volume (GMV) and mFamRI (p<0.05 corrected). Main region and statistical values (t-values, cluster size in voxels [k] and p values) are listed.
b. Brain regions where there were significant negative association between GMV and mFamRI. Total GMV and Behavioral Risk Index (BxRI; defined as a composite of letter identification, rapid naming and phonological awareness scores) were entered as nuisance variables (p<0.05 corrected). Main region, peak Talairach coordinates, anatomical structures the clusters extend to, and statistical values (t-values, cluster size in voxels [k] and p values) are listed.
c. Visual representation of correlations between FamRI and mean regional GMV of all significant clusters in Fig 1b combined and adjusted for total GMV and BxRI. Results were similar for each cluster hence are combined here.
d. Visual representation of correlations between BxRI and mean regional GMV of all significant clusters in Fig 1b combined and adjusted for total GMV and mFamRI. Results were similar for each cluster hence are combined here.
Figure 3. Association between regional brain volume and maternal Family Risk Index (mFamRI; FamRI is equivalent to Adult Reading History Questionnaire [ARHQ] scores).

a. Brain region where there was a trend for significant negative association between white matter volume (WMV) and mFamRI (0.05<p<0.1 corrected). This region was not significant when the Behavioral Risk Index (BxRI; defined as a composite of letter identification [LID], rapid naming [RN] and phonological awareness [PA] scores) was entered as a nuisance variable (p>0.1 corrected). Main region and statistical values (t-values, cluster size in voxels [k] and p values) are listed.
b. Brain regions where there were significantly reduced grey matter volume (GMV) in children with mFamRI compared to those without based on ARHQ scores (p<0.05 corrected). Note similarities with Figures 2a and 2b in bilateral prefrontal cortices and right parieto-temporal regions. Note also the lack of left parieto-temporal region (t=3.69, k=2425, p=0.13 corrected), and addition of the right temporal regions.
c. Brain regions where there were significantly reduced GMV in children with a maternal family history of reading disability compared to those with paternal family history based on ARHQ scores (p<0.05 corrected). Note spatial overlap with the left parieto-temporal region in Figure 2a.
Examination of the relationship between whole-brain structural MRIs and pFamRI or BxRI showed no significant positive or negative association with regional GMV or WMV. These results indicate that pFamRI and BxRI do not play a large role in morphometric variation at this young age. Since there was a non-significant but non-negligible relationship between mFamRI and BxRI (Figure 1, r=0.24, p=0.088) and because of our interest in dissociating these two measures, we repeated the analyses controlling for BxRI. The results were very similar for GMV (Figure 2) while the effect no longer showed a trend for significant correlation in WMV.
3.2.1 Controlling Possible Confounds
We also examined differences in brain morphometry based on measures of family history such as formal clinical diagnosis and ARHQ scores or parents compared to self (parental)-report. Among the children with self(parental)-reported reading disability, those with (N=17) and without (N=7) a formal diagnosis of any first degree family member showed no significant difference in regional GMV. Since independent sample t-tests are not comparable with regression analyses performed to examine relationships with brain and mFamRI, we categorized children into those with and without family history based on maternal ARHQ scores. The aforementioned results in the frontal and right parieto-temporal regions remained significant but the left parieto-temporal region was no longer significant (Figure 3b). However, the left parieto-temporal region showed significantly greater GMV in children with a self (parental)-report of maternal family history compared to those without a reported family history or a self(parental)-report of paternal family history. This region spatially overlapped with the region that showed a negative association between mFamRI and GMV (Figure 3c).
When possible confounding factors (age, beginning first-graders [N=4], left-handedness [N=5] or manual dexterity index, year of study entry [Phase I: 2008, N=27, Phase II: 2009, N=24], IQ [WJ BIA], father spent more time with child [N=1 spent more total time with father, N=3 spent more education-related time with father]) were controlled, the results were similar (children that are left-handed and 1st graders are marked in Figure 4). Specifically, for handedness, beginning first-graders and father spending more time with child, we eliminated the left-handed participants or first-graders or those that spent more time with the dad from our analysis and the effect was the same. For age and year of study entry, we entered this as a nuisance variable. To examine the effect of scan year, we also performed whole-brain voxel-by-voxel independent t-tests between Phase I (2008, N=27) and Phase II (2009; N=24) scans and found no significant differences. The most significant cluster was at the base of the cerebellum (p=0.225 corrected, cluster size [k]=1594) and was followed by much less significant clusters (p’s>0.70 corrected, k<731).
3.2.2 Effect of Environment
These results indicate the specific influence of maternal but not paternal reading history on brain morphometry, in particular GMV. To examine whether the influence of mFamRI was more likely due to general environmental effects, we performed a series of analyses. First, we regressed out SES and maternal education level (which is one measure that goes into SES calculation) but the results were still significant. Next, we examined the time the child spent with each parent. Because we were interested in further understanding the evidence of mFamRI influence but not pFamRI, we analyzed effects for mother and father separately rather than assessing the effect of total time spent with parents (as total time with parents added to 100% [% with mother + % with father] in each case). Our survey (N=46 out of 51 were available) indicated that all but one mother spent more time with their child than the father (N=5 spent equal amount of time as father), and the difference in proportion of total time children spent with mother compared to father was significant (t(45)=9.98, p<0.001; Table 1). All but three mothers spent more time on reading-related activities than the father (N=8 spent equal amount of time), and the proportion of time on reading-related education spent by mother vs. father was also significantly different (t(45)=6.93, p<0.001; Table 1). Importantly, the children who spent more time with their fathers were qualitatively not outliers in terms of the relationship between GM morphometry and mFamRI (Figure 4a). The results were also similar when we repeated analyses excluding children where fathers spent more time with them relative to mothers (N=1 for total time, N=3 for education-related time).
Further, there was a small but significant positive correlation (uncorrected for multiple comparisons) between brain morphometry and child’s time spent with mother on reading related activities relative to father (frontal region: r=0.334, p=0.023; right parieto-temporal region: r=0.25, p=0.095; left parieto-temporal regions: r=0.405, p=0.005). Nevertheless, partial correlation analyses between brain morphometry and maternal ARHQ scores regressing out proportion of time spent with mother remained significant (frontal region: r=−0.467, p=0.001; right parieto-temporal region: r=−0.551, p<0.001; left parieto-temporal regions: r=0.602, p<0.001). Collectively, these control analyses suggest that the effect of maternal reading history on brain morphometry was above and beyond the influence of the longer time spent with mother relative to father.
3.2.3 Cortical Surface Area and Thickness
Finally, results of cortical surface area and thickness indicated that the left IFG and left IPL showed significant negative correlation with maternal ARHQ and surface area (left IPL: r=-0.44, p=0.008 Bonferroni corrected, left IFG: r=−0.35, p=0.05 Bonferroni corrected), but not thickness (left IPL: r=0.088, p=1.0 Bonferroni corrected, left IFG: r=−0.25, p=0.21 Bonferroni corrected) (Figure 5). After correcting for the total surface area or weighted mean cortical thickness, the left IPL surface area remained significant (r=−0.37, p=0.032). Similar analyses of the right hemisphere were not significant (SURFACE AREA: right IPL: r=−0.22, p=0.34, right IFG: r=−0.28, p=0.16; THICKNESS: right IPL: r=0.038, p=1.0, right IFG: r=−0.17, p=0.56, all Bonferroni corrected) even after correcting for total surface area or weighted mean cortical thickness. These results suggest greater prenatal (reflected by surface area) than postnatal (reflected by cortical thickness) influence on the association between maternal reading history and brain morphometry, especially in the left IPL.
Figure 5. Association between cortical surface area and thickness of the left inferior parietal lobule and maternal reading history.
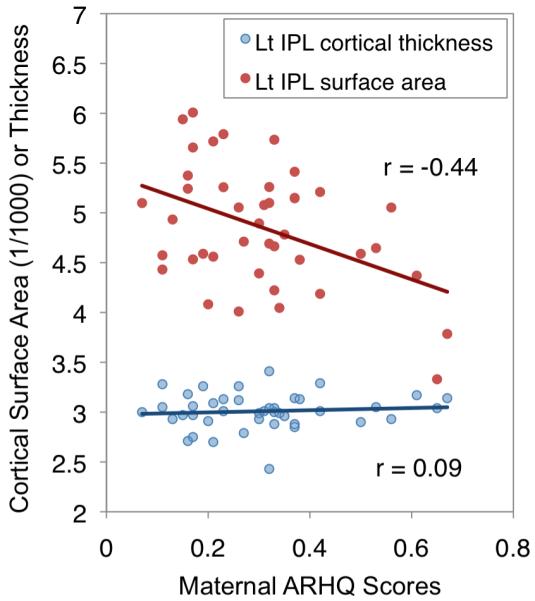
Lt IPL: left inferior parietal lobule, ARHQ: Adult Reading History Questionnaire.
4 DISCUSSION
We have presented evidence for the influence of risk factors for developing dyslexia on brain morphometry in beginning readers 5-6 years of age. We show the first evidence of interindividual variability of familial reading history on brain structure. Specifically, we examine familial and behavioral risks as dimensional rather than categorical factors, and show dissociations between maternal and paternal familial risks as well as the child’s behavioral risk. We found that the more severe the maternal history of reading disability, the more reduced the child’s bilateral prefrontal and parieto-temporal GM regions, regions that are associated with executive function, semantic and phonological processing, as well as reading. Associations with brain morphometry were not found for paternal history of reading disability or reading-related ability. The most intriguing finding was that more severe maternal reading history was associated with reduced left parieto-temporal region only for cortical surface area (thought to reflect more prenatal influences) (Kapellou et al., 2006)) and not thickness (thought to reflect more postnatal influences) (Landing et al., 2002; Shaw et al., 2008). Together with analyses controlling for SES and maternal education, results indicate that the maternal influence on brain morphometry is at least in part prenatal and not due to postnatal environmental influences.
The significant negative association between GMV and mFamRI (but not pFamRI) in bilateral prefrontal and parieto-temporal regions suggests that GM morphometry is presumably more strongly influenced by maternal rather than paternal reading history (even after controlling for child’s behavioral risk which was assessed using tests of PA, RN of colors and objects and LID). The trend for a significant negative correlation with WMV and mFamRI in the left parieto-temporal region (spatially adjacent to and statistically in the same direction as the GM finding) was no longer significant after controlling for behavioral risk, suggesting that it is the GM that is most influenced by maternal reading history.
The left parieto-temporal region is recruited during successful reading and supports the mapping of orthography onto phonology and phonological working memory (Vigneau et al., 2006), and this region has been repeatedly shown to be abnormal in dyslexia (Caylak, 2009; Habib, 2000; Maisog et al., 2008; Richlan et al., 2009).The contralateral right posterior brain system is thought to be important during development and parietal GM region is also often reduced in volume and activation level in dyslexia (Hoeft et al., 2007) with ‘normalization’ after successful intervention (Aylward et al., 2003; Eden et al., 2004; Meyler et al., 2008). We consider our findings in reference to key studies that have identified important regions for improved accuracy (compensation) in impaired readers, as we feel one potential benefit of studies with young readers is to consider possible intervention paths.
Shaywitz and colleagues (2003) found that among three groups of adolescent readers (non-impaired, persistently poor, and compensated), the compensated readers group recruited the right superior frontal and right middle temporal regions, suggesting that this group developed greater reliance on compensatory neural systems (Shaywitz et al., 2003). These regions, however, were activated more in both the persistently poor and the compensated groups relative to the non-impaired group, suggesting that these right hemisphere regions reflect trait rather than state markers. Clearly the potential to recruit from right regions homologues to left language regions seems important to overcome early neural deficits associated with language function. Using Magnetoencephalography (MEG) recently Rezaie and colleagues (2011) identified key regions of the brain predictive of response to increases in word level skills and reading comprehension one year later. Compared to Inadequate Responders, middle school students classified as Adequate Responders showed increased activation in the left parietotemporal regions (supramarginal and angular gyri, along with bilaterally in the superior and middle temporal gyri), with the amount of activation predictive of later gains in reading scores (Rezaie et al., 2011). These studies highlight key regions identified in our study as being important for compensation for impaired readers, and we feel our study is an important next step in considering some of the potential environmental factors that may mediate potential protective factors or risks for the development of reading deficits. Hence our findings suggest possible mediation by abnormal parieto-temporal neurodevelopment leading to increased risks for children of developing dyslexia with greater maternal history of reading impairments.
Another area that showed negative correlation with maternal reading history and regional GMV was the prefrontal region, associated with both naming on the left (Fiez and Petersen, 1998), and bilaterally with executive processing and working memory (Alloway et al., 2004; Bunge et al., 2000; Smith and Jonides, 1999), and impairment in executive function in readers with dyslexia has been suggested (Shaywitz and Shaywitz, 2008). Differences in activation in the inferior frontal regions by reading group (typical versus impaired), however, offer contradictory findings, with studies reporting over-activation, under-activation, or no differences between the two groups (Maisog et al., 2008; Richlan et al., 2009). In an MEG study of adult readers with and without dyslexia, Frye and colleagues (2010b) attempted to elucidate the extant inconsistent findings by examining not only the amount of activation, but also effective connectivity (inward versus outward connectivity) from the inferior frontal areas. The timing of activation may be important as one intervention study using MEG found that in typical readers activation in the inferior frontal areas was preceded by activation in the parieto-temporal areas, whereas in the group with dyslexia the timing of activation was not significantly different (Simos et al., 2007). Findings from Frye et al. (2010b) suggest that among readers with dyslexia, greater connectivity from the left IFA to other regions (such as the left and right parieto-temporal areas and the right inferior frontal areas) during the pre-stimulus period was associated with better performance on rhyme trials. Thus, it appears that for successful compensation among readers with dyslexia, the top-down inferior frontal areas connect to other important brain regions, and these cortical regions are not restricted to only the left hemisphere but also the right homologous regions (Frye et al., 2010b). While the present study did not examine pre-stimulus effective connectivity, inferior frontal areas were implicated in our findings, and future work could consider examination of effective connectivity. In sum, in our study it appears that more severe history of reading impairment in mothers is associated with atypical brain morphometry in children in regions necessary for phonological processing and phonological/verbal working memory, fluid reading and higher order cognitive processes.
We next consider the results of greater maternal influence by one of two possible avenues (though the two are likely to be associated with each other), greater maternal time spent with child and a sex-based genetic transmission of dyslexia. First, mothers did report spending significantly more time (in general and related to educational activities like reading) with their children than did fathers. A wide body of literature suggests the importance of home environmental factors on reading achievement and general cognitive skills (Bradley, 1993; Bradley and Corwyn, 2002; Espy et al., 2001; Molfese et al., 2003; Molfese and Molfese, 2002). Recall that the findings support at positive correlation between the amount of time the mother spent reading to the child and grey matter variance, suggesting that environment may be a key contributor to morphometric differences seen in our sample of pre-readers. However, the influence of maternal reading history (i.e., the ARHQ score) on grey matter variance remained significant even after controlling for this factor.
Therefore, in line with more recent work examining the biological contributors of good and poor reading, we now consider whether our results may reflect evidence of a sex-specific threshold model, suggested by (Pennington, 1990) for dyslexia (but also is true for other cognitive deficits such as Turner syndrome, (Kesler et al., 2003). The sex-specific model posits that females require more risk genes (i.e., having a greater genetic load) than males to exhibit similar reading impairments. Therefore, if the deficits derive from a female ancestor, then offspring may have increased risk of being affected. If females require more risk genes than males to express language and reading disorders, then when mothers evidence impairment their offspring may have increased risk for the disorder.
We cannot conclude from this study whether the specific association between brain morphometry and maternal reading history is due to the influence of environmental factor(s), genes, or some combination of both. The association between mFamRI and GM morphometry remaining significant even after regressing out the effect of SES or maternal education however, suggests that our results are at least not solely due to general environmental influences and raise the interesting possibility of more neurobiological and genetic influences. Further, the results from cortical surface area and thickness suggested that brain regions, in particular the left IPL, may reflect more prenatal maternal rather than postnatal environmental influence (but see, (Im et al., 2008).
Even though family history and behavioral risk for dyslexia are known to be comorbid, we did not find any significant associations between BxRI and GMV or WMV. Thus, in this young age group, current level of behavioral measures that are known to be predictors of the later diagnosis of dyslexia (such as PA, RN or LID) were not associated with brain measures. It may be that these core functions critical for reading are associated with brain measures later in life, as numerous studies have shown associations between reading-related measures and fMRI activation or brain volumes in older samples (see for example,(Eckert et al., 2003; Hoeft et al., 2006; Kronbichler et al., 2008; Rumsey et al., 1999; Silani et al., 2005). Because these reading measures predict later development of dyslexia above and beyond variance accounted for by familial risk (Puolakanaho et al., 2007), and because we have evidence that English-speaking pre-readers with versus without risk for dyslexia display differences in brain morphometry (Raschle et al., 2010), perhaps future reading achievement will be predicted with higher accuracy in our sample when neuroimaging and behavioral measures are combined with environmental and genetic measures.
While the study presented is the first of its kind to suggest a dissociation between brain morphometry and familial and behavioral risks for dyslexia in young children, there are important limitations that should be addressed in future studies. Suggestions for future studies include the following. First, while we did assess reading and cognitive skills directly in many of the parents (N=36), it is important for future studies to evaluate the full sample with perhaps a wider array of measures. Nevertheless, we do feel confident that the ARHQ scores do reflect reading skill as our results showed an association between parents’ ARHQ scores and the TOWRE PDE (a timed test of phonemic decoding) whereby more history of reading impairment was associated with lower TOWRE scores. Second, whether the influence of maternal reading history on brain anatomy is due to environment (e.g., mothers’ current reading behaviors and activities with children) and/or genes should be examined in future large-scale longitudinal studies gathering genetic information. Further, in addition to samples where mothers spend greater time with their children than fathers, it will be of interest to recruit families where both parents spend equal time with their child, and where fathers spend more time than mothers. It is also possible that mothers’ reading background was more strongly associated because of a higher accuracy in the reporting of their reading history, which may have increased the correlations enough to make them significant. Compared to fathers, mothers are spending more time with their children on educational activities that may catalyze mothers’ thinking about their own experiences with reading. Finally, given that our results could suggest maternal neurobiological influences on children’s brain development, future studies should gather neuroimaging data on mothers (and if possible fathers).
Nevertheless, our findings suggest that previously described functional and structural abnormalities in older individuals with dyslexia may not be due to experience through years of formal reading instructions, but rather are present in early childhood before school entry. Given that developmental dyslexia can so negatively affect children’s educational attainments and self-appraisals, and that deficits seen in children with dyslexia can be remediated, it is essential that we continue efforts to explore the relationship among brain, behavior, genes and environment that may lead to early identification and intervention.
ACKNOWLEDGMENT
This study was supported by grants from NICHD HD054720, Lucile Packard Foundation for Children’s Health (LPFCH), Spectrum Child Health, Clinical and Translational Science Award, and the Dyslexia Foundation to FH, the Bette and Al Moorman Young Investigator Award to ALR, and P41RR009784 to GG. Funding for JMB was provided by an NIH-sponsored institutional research training grant (T32) 5T32MH019908-17 to ALR. We thank Joshua Heitzmann, Stuart Red, Rociel Martinez and Nicolle Bugescu for support in behavioral data collection, and Booil Jo for statistical consultation.
Footnotes
Publisher's Disclaimer: This is a PDF file of an unedited manuscript that has been accepted for publication. As a service to our customers we are providing this early version of the manuscript. The manuscript will undergo copyediting, typesetting, and review of the resulting proof before it is published in its final citable form. Please note that during the production process errors may be discovered which could affect the content, and all legal disclaimers that apply to the journal pertain.
REFERENCES
- Alloway TP, Gathercole SE, Willis C, Adams AM. A structural analysis of working memory and related cognitive skills in young children. J Exp Child Psychol. 2004;87:85–106. doi: 10.1016/j.jecp.2003.10.002. [DOI] [PubMed] [Google Scholar]
- Ashburner J. A fast diffeomorphic image registration algorithm. NeuroImage. 2007;38:95–113. doi: 10.1016/j.neuroimage.2007.07.007. [DOI] [PubMed] [Google Scholar]
- Aylward EH, Richards TL, Beringer VW, Nagy WE, Field KM, Grimme AC, Richards AL, Thomson JB, Cramer SC. Instructional treatment associated with changes in brain activation in children with dyslexia. Neurology. 2003;61:212–219. doi: 10.1212/01.wnl.0000068363.05974.64. [DOI] [PubMed] [Google Scholar]
- Benasich AA, Choudhury N, Friedman JT, Realpe-Bonilla T, Chojnowska C, Gou Z. The infant as a prelinguistic model for language learning impairments: predicting from event-related potentials to behavior. Neuropsychologia. 2006;44:396–411. doi: 10.1016/j.neuropsychologia.2005.06.004. [DOI] [PMC free article] [PubMed] [Google Scholar]
- Bornstein MH, Bradley RH, editors. Socioeconomic Status, Parenting, and Child Development. Lawrence Erlbaum Associates; Mahwah: 2003. [Google Scholar]
- Bradley RH. Children’s home environments, health, behavior, and intervention efforts: a review using the HOME inventory as a marker measure. Genetic, social, and general psychology monographs. 1993;119:437. [PubMed] [Google Scholar]
- Bradley RH, Corwyn RF. Socioeconomic status and child development. Annual Review of Psychology. 2002;53:371. doi: 10.1146/annurev.psych.53.100901.135233. [DOI] [PubMed] [Google Scholar]
- Brunswick N, McCrory E, Price CJ, Frith CD, Frith U. Explicit and implicit processing of words and pseudowords by adult developmental dyslexics. Brain. 1999;122:1901–1917. doi: 10.1093/brain/122.10.1901. [DOI] [PubMed] [Google Scholar]
- Bunge SA, Klingberg T, Jacobsen RB, Gabrieli JD. A resource model of the neural basis of executive working memory. Proc Natl Acad Sci U S A. 2000;97:3573–3578. doi: 10.1073/pnas.050583797. [DOI] [PMC free article] [PubMed] [Google Scholar]
- Caylak E. Neurobiological approaches on brains of children with dyslexia: review. Acad Radiol. 2009;16:1003–1024. doi: 10.1016/j.acra.2009.02.012. [DOI] [PubMed] [Google Scholar]
- Dale AM, Fischl B, Sereno MI. Cortical surface-based analysis. I. Segmentation and surface reconstruction. NeuroImage. 1999;9:179–194. doi: 10.1006/nimg.1998.0395. [DOI] [PubMed] [Google Scholar]
- Dale AM, Sereno MI. Improved localization of cortical activity by combining EEG and MEG with MRI cortical surface reconstruction: a linear approach. Journal of Cognitive Neuroscience. 1993;5:162–176. doi: 10.1162/jocn.1993.5.2.162. [DOI] [PubMed] [Google Scholar]
- Desikan RS, Segonne F, Fischl B, Quinn BT, Dickerson BC, Blacker D, Buckner RL, Dale AM, Maguire RP, Hyman BT, Albert MS, Killiany RJ. An automated labeling system for subdividing the human cerebral cortex on MRI scans into gyral based regions of interest. NeuroImage. 2006;31:968–980. doi: 10.1016/j.neuroimage.2006.01.021. [DOI] [PubMed] [Google Scholar]
- Eckert MA, Leonard CM, Richards TL, Aylward EH, Thomson J, Berninger VW. Anatomical correlates of dyslexia: frontal and cerebellar findings. Brain. 2003;126:482–494. doi: 10.1093/brain/awg026. [DOI] [PubMed] [Google Scholar]
- Eden GF, Jones KM, Cappell K, Gareau L, Wood, Zeffiro TA, Dietz N, Agnew JA, Flowers DL. Neural changes following remediation in adult developmental dyslexia. Neuron. 2004;44:411–422. doi: 10.1016/j.neuron.2004.10.019. [DOI] [PubMed] [Google Scholar]
- Espy KA, Molfese VJ, DiLalla LF. Effects of environmental measures on intelligence in young children: Growth curve modeling of longitudinal data. Merrill-Palmer Quarterly. 2001;47:42–73. [Google Scholar]
- Fiez JA, Petersen SE. Neuroimaging studies of word reading. Proc Natl Acad Sci U S A. 1998;95:914–921. doi: 10.1073/pnas.95.3.914. [DOI] [PMC free article] [PubMed] [Google Scholar]
- Fischl B, Dale AM. Measuring the thickness of the human cerebral cortex from magnetic resonance images. Proc Natl Acad Sci U S A. 2000;97:11050–11055. doi: 10.1073/pnas.200033797. [DOI] [PMC free article] [PubMed] [Google Scholar]
- Fischl B, Liu A, Dale AM. Automated manifold surgery: constructing geometrically accurate and topologically correct models of the human cerebral cortex. IEEE Trans Med Imaging. 2001;20:70–80. doi: 10.1109/42.906426. [DOI] [PubMed] [Google Scholar]
- Fischl B, Salat DH, Busa E, Albert M, Dieterich M, Haselgrove C, van der Kouwe A, Killiany R, Kennedy D, Klaveness S, Montillo A, Makris N, Rosen B, Dale AM. Whole brain segmentation: automated labeling of neuroanatomical structures in the human brain. Neuron. 2002;33:341–355. doi: 10.1016/s0896-6273(02)00569-x. [DOI] [PubMed] [Google Scholar]
- Fischl B, Salat DH, van der Kouwe AJ, Makris N, Segonne F, Quinn BT, Dale AM. Sequence-independent segmentation of magnetic resonance images. NeuroImage. 2004a;23(Suppl 1):S69–84. doi: 10.1016/j.neuroimage.2004.07.016. [DOI] [PubMed] [Google Scholar]
- Fischl B, Sereno MI, Dale AM. Cortical surface-based analysis. II: Inflation, flattening, and a surface-based coordinate system. NeuroImage. 1999a;9:195–207. doi: 10.1006/nimg.1998.0396. [DOI] [PubMed] [Google Scholar]
- Fischl B, Sereno MI, Tootell RB, Dale AM. High-resolution intersubject averaging and a coordinate system for the cortical surface. Hum Brain Mapp. 1999b;8:272–284. doi: 10.1002/(SICI)1097-0193(1999)8:4<272::AID-HBM10>3.0.CO;2-4. [DOI] [PMC free article] [PubMed] [Google Scholar]
- Fischl B, van der Kouwe A, Destrieux C, Halgren E, Segonne F, Salat DH, Busa E, Seidman LJ, Goldstein J, Kennedy D, Caviness V, Makris N, Rosen B, Dale AM. Automatically parcellating the human cerebral cortex. Cereb Cortex. 2004b;14:11–22. doi: 10.1093/cercor/bhg087. [DOI] [PubMed] [Google Scholar]
- Frye RE, Liederman J, Malmberg B, McLean J, Strickland D, Beauchamp MS. Surface area accounts for the relation of gray matter volume to reading-related skills and history of dyslexia. Cereb Cortex. 2010a;20:2625–2635. doi: 10.1093/cercor/bhq010. [DOI] [PMC free article] [PubMed] [Google Scholar]
- Frye RE, Wu MH, Liederman J, Fisher JM. Greater Pre-Stimulus Effective Connectivity from the Left Inferior Frontal Area to other Areas is Associated with Better Phonological Decoding in Dyslexic Readers. Frontiers in systems neuroscience. 2010b;4:156. doi: 10.3389/fnsys.2010.00156. [DOI] [PMC free article] [PubMed] [Google Scholar]
- Gabrieli JD. Dyslexia: a new synergy between education and cognitive neuroscience. Science. 2009;325:280–283. doi: 10.1126/science.1171999. [DOI] [PubMed] [Google Scholar]
- Georgiewa P, Rzanny R, Gaser C, Gerhard UJ, Vieweg U, Freesmeyer D, Mentzel HJ, Kaiser WA, Blanz B. Phonological processing in dyslexic children: a study combining functional imaging and event related potentials. Neurosci Lett. 2002;318:5–8. doi: 10.1016/s0304-3940(01)02236-4. [DOI] [PubMed] [Google Scholar]
- Guttorm TK, Leppänen PH, Hämäläinen JA, Eklund KM, Lyytinen HJ. Newborn event-related potentials predict poorer pre-reading skills in children at risk for dyslexia. J Learn Disabil. 2009;1:10. doi: 10.1177/0022219409345005. [DOI] [PubMed] [Google Scholar]
- Habib M. The neurobiological basis of developmental dyslexia: an overview and working hypothesis. Brain. 2000;123:2373–2399. doi: 10.1093/brain/123.12.2373. [DOI] [PubMed] [Google Scholar]
- Han X, Jovicich J, Salat D, van der Kouwe A, Quinn B, Czanner S, Busa E, Pacheco J, Albert M, Killiany R, Maguire P, Rosas D, Makris N, Dale A, Dickerson B, Fischl B. Reliability of MRI-derived measurements of human cerebral cortical thickness: the effects of field strength, scanner upgrade and manufacturer. NeuroImage. 2006;32:180–194. doi: 10.1016/j.neuroimage.2006.02.051. [DOI] [PubMed] [Google Scholar]
- Hoeft F, Hernandez A, McMillon G, Taylor-Hill H, Martindale JL, Meyler A, Keller TA, Siok WT, Deutsch GK, Just MA, Whitfield-Gabrieli S, Gabrieli JD. Neural basis of dyslexia: a comparison between dyslexic and nondyslexic children equated for reading ability. J Neurosci. 2006;26:10700–10708. doi: 10.1523/JNEUROSCI.4931-05.2006. [DOI] [PMC free article] [PubMed] [Google Scholar]
- Hoeft F, Meyler A, Hernandez A, Juel C, Taylor-Hill H, Martindale JL, McMillon G, Kolchugina G, Black JM, Faizi A, Deutsch GK, Siok WT, Reiss AL, Whitfield-Gabrieli S, Gabrieli JD. Functional and morphometric brain dissociation between dyslexia and reading ability. Proc Natl Acad Sci U S A. 2007;104:4234–4239. doi: 10.1073/pnas.0609399104. [DOI] [PMC free article] [PubMed] [Google Scholar]
- Im K, Lee JM, Lyttelton O, Kim SH, Evans AC, Kim SI. Brain size and cortical structure in the adult human brain. Cereb Cortex. 2008;18:2181–2191. doi: 10.1093/cercor/bhm244. [DOI] [PubMed] [Google Scholar]
- Jovicich J, Czanner S, Greve D, Haley E, van der Kouwe A, Gollub R, Kennedy D, Schmitt F, Brown G, Macfall J, Fischl B, Dale A. Reliability in multi-site structural MRI studies: effects of gradient non-linearity correction on phantom and human data. NeuroImage. 2006;30:436–443. doi: 10.1016/j.neuroimage.2005.09.046. [DOI] [PubMed] [Google Scholar]
- Kapellou O, Counsell SJ, Kennea N, Dyet L, Saeed N, Stark J, Maalouf E, Duggan P, Ajayi-Obe M, Hajnal J, Allsop JM, Boardman J, Rutherford MA, Cowan F, Edwards AD. Abnormal cortical development after premature birth shown by altered allometric scaling of brain growth. PLoS Med. 2006;3:e265. doi: 10.1371/journal.pmed.0030265. [DOI] [PMC free article] [PubMed] [Google Scholar]
- Kesler SR, Blasey CM, Brown WE, Yankowitz J, Zeng SM, Bender BG, Reiss AL. Effects of X-monosomy and X-linked imprinting on superior temporal gyrus morphology in Turner syndrome. Biol Psychiatry. 2003;54:636–646. doi: 10.1016/s0006-3223(03)00289-0. [DOI] [PMC free article] [PubMed] [Google Scholar]
- Kronbichler M, Wimmer H, Staffen W, Hutzler F, Mair A, Ladurner G. Developmental dyslexia: gray matter abnormalities in the occipitotemporal cortex. Hum Brain Mapp. 2008;29:613–625. doi: 10.1002/hbm.20425. [DOI] [PMC free article] [PubMed] [Google Scholar]
- Kuperberg GR, Broome MR, McGuire PK, David AS, Eddy M, Ozawa F, Goff D, West WC, Williams SC, van der Kouwe AJ, Salat DH, Dale AM, Fischl B. Regionally localized thinning of the cerebral cortex in schizophrenia. Arch Gen Psychiatry. 2003;60:878–888. doi: 10.1001/archpsyc.60.9.878. [DOI] [PubMed] [Google Scholar]
- Landing BH, Shankle WR, Hara J, Brannock J, Fallon JH. The development of structure and function in the postnatal human cerebral cortex from birth to 72 months: changes in thickness of layers II and III co-relate to the onset of new age-specific behaviors. Pediatr Pathol Mol Med. 2002;21:321–342. doi: 10.1080/02770930290056541. [DOI] [PubMed] [Google Scholar]
- Lefly DL, Pennington BF. Reliability and validity of the Adult Reading History Questionnaire. J Learn Disabil. 2000;33:286–296. doi: 10.1177/002221940003300306. [DOI] [PubMed] [Google Scholar]
- Leppänen PH, Pihko E, Eklund KM, Lyytinen H. Cortical responses of infants with and without a genetic risk for dyslexia: II. Group effects. Neuroreport. 1999;10:969–973. doi: 10.1097/00001756-199904060-00014. [DOI] [PubMed] [Google Scholar]
- Lyytinen H, Erskine J, Ahonen T, Aro M, Eklund K, Guttorm T, Hintikka S, Hämäläinen J, Ketonen R, Laakso ML, Leppänen PHT, Lyytinen P, Poikkeus AM, Puolakanaho A, Richardson U, Salmi P, Tolvanen A, Torppa M, Viholainen H. Early identification and prevention of dyslexia: Results from a prospective follow-up study of children at familial risk for dyslexia. In: Reid G, Fawcett A, Siegel L, Manis FR, editors. The SAGE Handbook of Dyslexia. SAGE Publications Ltd.; Thousand Oaks: 2008. pp. 121–146. [Google Scholar]
- Lyytinen H, Erskine J, Tolvanen A, Torppa M, Poikkeus A, Lyytinen P. Trajectories of reading development: A follow-up from birth to school age of children with and without risk for dyslexia. Merrill-Palmer Quarterly. 2006;52:514–546. [Google Scholar]
- Lyytinen H, Leppänen PH, Richardson U, Guttorm TK. Brain functions and speech perception in infants at risk for dyslexia. In: Csepe V, editor. Dyslexia: Different Brain, Different Behaviour. Kluwer; Dorthrecht: 2003. pp. 113–152. [Google Scholar]
- Maisog JM, Einbinder ER, Flowers DL, Turkeltaub PE, Eden GF. A meta-analysis of functional neuroimaging studies of dyslexia. Ann N Y Acad Sci. 2008;1145:237–259. doi: 10.1196/annals.1416.024. [DOI] [PubMed] [Google Scholar]
- Mather N, Woodcock RW. Woodcock-Johnson III Tests of Cognitive Abilities. Riverside Publishing; Rolling Meadows, IL: 2001. [Google Scholar]
- Maurer U, Brem S, Bucher K, Kranz F, Benz R, Steinhausen HC, Brandeis D. Impaired tuning of a fast occipito-temporal response for print in dyslexic children learning to read. Brain. 2007;130:3200–3210. doi: 10.1093/brain/awm193. [DOI] [PubMed] [Google Scholar]
- Maurer U, Bucher K, Brem S, Benz R, Kranz F, Schulz E, van der Mark S, Steinhausen HC, Brandeis D. Neurophysiology in preschool improves behavioral prediction of reading ability throughout primary school. Biol Psychiatry. 2009;66:341–348. doi: 10.1016/j.biopsych.2009.02.031. [DOI] [PubMed] [Google Scholar]
- Maurer U, Bucher K, Brem S, Brandeis D. Altered responses to tone and phoneme mismatch in kindergartners at familial dyslexia risk. Neuroreport. 2003;14:2245–2250. doi: 10.1097/00001756-200312020-00022. [DOI] [PubMed] [Google Scholar]
- Meyler A, Keller TA, Cherkassky VL, Gabrieli JD, Just MA. Modifying the brain activation of poor readers during sentence comprehension with extended remedial instruction: a longitudinal study of neuroplasticity. Neuropsychologia. 2008;46:2580–2592. doi: 10.1016/j.neuropsychologia.2008.03.012. [DOI] [PMC free article] [PubMed] [Google Scholar]
- Milne RD, Syngeniotis A, Jackson G, Corballis MC. Mixed lateralization of phonological assembly in developmental dyslexia. Neurocase. 2002;8:205–209. doi: 10.1093/neucas/8.3.205. [DOI] [PubMed] [Google Scholar]
- Molfese VJ, Modglin A, Molfese DL. The role of environment in the development of reading skills: A longitudinal study of preschool and school-age measures. J Learn Disabil. 2003;36:59–67. doi: 10.1177/00222194030360010701. [DOI] [PubMed] [Google Scholar]
- Molfese VJ, Molfese DL. Environmental and social influences on reading skills as indexed by brain and behavioral responses. Annals of Dyslexia. 2002;52:121–137. [Google Scholar]
- Pennington BF. The genetics of dyslexia. Journal of Child Psychology and Psychiatry. 1990;31:193–201. doi: 10.1111/j.1469-7610.1990.tb01561.x. [DOI] [PubMed] [Google Scholar]
- Puolakanaho A, Ahonen T, Aro M, Eklund K, Leppänen PH, Poikkeus AM, Tolvanen A, Torppa M, Lyytinen H. Very early phonological and language skills: estimating individual risk of reading disability. J Child Psychol Psychiatry. 2007;48:923–931. doi: 10.1111/j.1469-7610.2007.01763.x. [DOI] [PubMed] [Google Scholar]
- Raschle NM, Chang M, Gaab N. Structural brain alterations associated with dyslexia predate reading onset. NeuroImage. 2010 doi: 10.1016/j.neuroimage.2010.09.055. [DOI] [PMC free article] [PubMed] [Google Scholar]
- Rezaie R, Simos PG, Fletcher JM, Cirino PT, Vaughn S, Papanicolaou AC. Temporo-parietal Brain Activity as a Longitudinal Predictor of Response to Educational Interventions among Middle School Struggling Readers. Journal of the International Neuropsychological Society : JINS. 2011;17:875–885. doi: 10.1017/S1355617711000890. [DOI] [PMC free article] [PubMed] [Google Scholar]
- Richards TL, Berninger VW, Aylward EH, Richards AL, Thomson JB, Nagy WE, Carlisle JF, Dager SR, Abbott RD. Reproducibility of proton MR spectroscopic imaging (PEPSI): comparison of dyslexic and normal-reading children and effects of treatment on brain lactate levels during language tasks. AJNR Am J Neuroradiol. 2002;23:1678–1685. [PMC free article] [PubMed] [Google Scholar]
- Richlan F, Kronbichler M, Wimmer H. Functional abnormalities in the dyslexic brain: a quantitative meta-analysis of neuroimaging studies. Hum Brain Mapp. 2009;30:3299–3308. doi: 10.1002/hbm.20752. [DOI] [PMC free article] [PubMed] [Google Scholar]
- Rosas HD, Liu AK, Hersch S, Glessner M, Ferrante RJ, Salat DH, van der Kouwe A, Jenkins BG, Dale AM, Fischl B. Regional and progressive thinning of the cortical ribbon in Huntington’s disease. Neurology. 2002;58:695–701. doi: 10.1212/wnl.58.5.695. [DOI] [PubMed] [Google Scholar]
- Rumsey JM. The biology of developmental dyslexia. JAMA. 1992;268:912–915. [PubMed] [Google Scholar]
- Rumsey JM, Horwitz B, Donohue BC, Nace KL, Maisog JM, Andreason P. A functional lesion in developmental dyslexia: left angular gyral blood flow predicts severity. Brain Lang. 1999;70:187–204. doi: 10.1006/brln.1999.2158. [DOI] [PubMed] [Google Scholar]
- Salat DH, Buckner RL, Snyder AZ, Greve DN, Desikan RS, Busa E, Morris JC, Dale AM, Fischl B. Thinning of the cerebral cortex in aging. Cereb Cortex. 2004;14:721–730. doi: 10.1093/cercor/bhh032. [DOI] [PubMed] [Google Scholar]
- Salmelin R, Service E, Kiesila P, Uutela K, Salonen O. Impaired visual word processing in dyslexia revealed with magnetoencephalography. Ann Neurol. 1996;40:157–162. doi: 10.1002/ana.410400206. [DOI] [PubMed] [Google Scholar]
- Segonne F, Dale AM, Busa E, Glessner M, Salat D, Hahn HK, Fischl B. A hybrid approach to the skull stripping problem in MRI. NeuroImage. 2004;22:1060–1075. doi: 10.1016/j.neuroimage.2004.03.032. [DOI] [PubMed] [Google Scholar]
- Segonne F, Pacheco J, Fischl B. Geometrically accurate topology-correction of cortical surfaces using nonseparating loops. IEEE Trans Med Imaging. 2007;26:518–529. doi: 10.1109/TMI.2006.887364. [DOI] [PubMed] [Google Scholar]
- Shaw P, Kabani NJ, Lerch JP, Eckstrand K, Lenroot R, Gogtay N, Greenstein D, Clasen L, Evans A, Rapoport JL, Giedd JN, Wise SP. Neurodevelopmental trajectories of the human cerebral cortex. J Neurosci. 2008;28:3586–3594. doi: 10.1523/JNEUROSCI.5309-07.2008. [DOI] [PMC free article] [PubMed] [Google Scholar]
- Shaywitz BA, Shaywitz SE, Blachman BA, Pugh KR, Fulbright RK, Skudlarski P, Mencl WE, Constable RT, Holahan JM, Marchione KE, Fletcher JM, Lyon GR, Gore JC. Development of left occipitotemporal systems for skilled reading in children after a phonologically- based intervention. Biol Psychiatry. 2004;55:926–933. doi: 10.1016/j.biopsych.2003.12.019. [DOI] [PubMed] [Google Scholar]
- Shaywitz BA, Shaywitz SE, Pugh KR, Mencl WE, Fulbright RK, Skudlarski P, Constable RT, Marchione KE, Fletcher JM, Lyon GR, Gore JC. Disruption of posterior brain systems for reading in children with developmental dyslexia. Biol Psychiatry. 2002;52:101–110. doi: 10.1016/s0006-3223(02)01365-3. [DOI] [PubMed] [Google Scholar]
- Shaywitz SE. Dyslexia. N Engl J Med. 1998;338:307–312. doi: 10.1056/NEJM199801293380507. [DOI] [PubMed] [Google Scholar]
- Shaywitz SE, Shaywitz BA. Dyslexia (specific reading disability) Biological Psychiatry. 2005;57:1301–1309. doi: 10.1016/j.biopsych.2005.01.043. [DOI] [PubMed] [Google Scholar]
- Shaywitz SE, Shaywitz BA. Paying attention to reading: the neurobiology of reading and dyslexia. Dev Psychopathol. 2008;20:1329–1349. doi: 10.1017/S0954579408000631. [DOI] [PubMed] [Google Scholar]
- Shaywitz SE, Shaywitz BA, Fulbright RK, Skudlarski P, Mencl WE, Constable RT, Pugh KR, Holahan JM, Marchione KE, Fletcher JM, Lyon GR, Gore JC. Neural systems for compensation and persistence: young adult outcome of childhood reading disability. Biol Psychiatry. 2003;54:25–33. doi: 10.1016/s0006-3223(02)01836-x. [DOI] [PubMed] [Google Scholar]
- Shaywitz SE, Shaywitz BA, Pugh KR, Fulbright RK, Constable RT, Mencl WE, Shankweiler DP, Liberman AM, Skudlarski P, Fletcher JM, Katz L, Marchione KE, Lacadie C, Gatenby C, Gore JC. Functional disruption in the organization of the brain for reading in dyslexia. Proc Natl Acad Sci U S A. 1998;95:2636–2641. doi: 10.1073/pnas.95.5.2636. [DOI] [PMC free article] [PubMed] [Google Scholar]
- Silani G, Frith U, Demonet JF, Fazio F, Perani D, Price C, Frith CD, Paulesu E. Brain abnormalities underlying altered activation in dyslexia: a voxel based morphometry study. Brain. 2005;128:2453–2461. doi: 10.1093/brain/awh579. [DOI] [PubMed] [Google Scholar]
- Simos PG, Fletcher JM, Sarkari S, Billingsley RL, Denton C, Papanicolaou AC. Altering the brain circuits for reading through intervention: a magnetic source imaging study. Neuropsychology. 2007;21:485–496. doi: 10.1037/0894-4105.21.4.485. [DOI] [PubMed] [Google Scholar]
- Sled JG, Zijdenbos AP, Evans AC. A nonparametric method for automatic correction of intensity nonuniformity in MRI data. IEEE Trans Med Imaging. 1998;17:87–97. doi: 10.1109/42.668698. [DOI] [PubMed] [Google Scholar]
- Smith EE, Jonides J. Storage and executive processes in the frontal lobes. Science. 1999;283:1657–1661. doi: 10.1126/science.283.5408.1657. [DOI] [PubMed] [Google Scholar]
- Specht K, Hugdahl K, Ofte S, Nygård M, Bjørnerud A, Plante E, Helland T. Brain activation on pre-reading tasks reveals at-risk status for dyslexia in 6-year-old children. Scand J Psychol. 2009;50:79–91. doi: 10.1111/j.1467-9450.2008.00688.x. [DOI] [PubMed] [Google Scholar]
- Swan D, Goswami U. Phonological awareness deficits in developmental dyslexia and the phonological representations hypothesis. Journal of Experimental Child Psychology. 1997;66:18–41. doi: 10.1006/jecp.1997.2375. [DOI] [PubMed] [Google Scholar]
- Torppa M, Poikkeus AM, Laakso ML, Eklund K, Lyytinen H. Predicting delayed letter knowledge development and its relation to grade 1 reading achievement among children with and without familial risk for dyslexia. Dev Psychol. 2006;42:1128–1142. doi: 10.1037/0012-1649.42.6.1128. [DOI] [PubMed] [Google Scholar]
- Vigneau M, Beaucousin V, Herve PY, Duffau H, Crivello F, Houde O, Mazoyer B, Tzourio-Mazoyer N. Meta-analyzing left hemisphere language areas: phonology, semantics, and sentence processing. NeuroImage. 2006;30:1414–1432. doi: 10.1016/j.neuroimage.2005.11.002. [DOI] [PubMed] [Google Scholar]
- Wagner RK, Torgensen JK. The nature of phonological processing and its role in the acqusition of reading skills. Psychological Bulletin. 1987;101:192–212. [Google Scholar]
- Wagner RK, Torgesen JK, Rashotte CA. Comprehensive Test of Phonological Processing. Pro-Ed; Austin, TX: 1999. [Google Scholar]
- Wolf M, Denckla MB. Rapid Automized Naming and Rapid Alternating Stimulus Tests. Pro-Ed; Austin, TX: 2005. [Google Scholar]
- Woodcock RW. Woodcock Reading Mastery Tests - Revised/NU. American Guidance Service, Inc.; Circle Pines, MN: 1998. [Google Scholar]
- Zachary RA. Shipley Institute of Living Scale, Revised Manual. Western Psychological Services; Los Angeles: 2006. [Google Scholar]