

Abstract
Plusbacin-A3 (pb-A3) is a cyclic lipodepsipeptide which exhibits antibacterial activity against multidrug-resistant Gram-positive pathogens. Plusbacin-A3 is thought not to enter the cell cytoplasm and its lipophilic isotridecanyl side chain is presumed to insert into the membrane bilayer thereby facilitating either lipid II binding or some form of membrane disruption. Analogues of pb-A3, [2H]pb-A3 and deslipo-pb-A3, were synthesized to test membrane insertion as key to the mode of action. [2H]pb-A3 has a 2H-isotopically labeled isopropyl subunit of the lipid side chain, and deslipo-pb-A3 is missing the isotridecanyl side chain. Both analogues have the pb-A3 core structure. The loss of antimicrobial activity in deslipo-pb-A3 showed that the isotridecanyl side chain is crucial for the drug mode of action. However, rotational-echo double resonance NMR characterization of [2H]pb-A3 bound to [1-13C]glycine labeled whole-cells of Staphylococcus aureus showed that the isotridecanyl side chain does not insert into the lipid membrane, but instead is found in the staphylococcal cell wall, positioned near the pentaglycyl cross-bridge of the cell-wall peptidoglycan. Addition of [2H]pb-A3 during S. aureus growth resulted in an accumulation of Park’s nucleotide, consistent with the inhibition of the transglycosylation step of peptidoglycan biosynthesis.
Keywords: antibiotics, cell walls, cyclic peptides, REDOR, solid-state NMR
Plusbacin-A3 (pb-A3) is a cyclic lipodepsipeptide (Figure 1, left) produced by Pseudomonas sp. PB-6250 (1) which exhibits antibacterial activity with a minimum inhibitory concentration (MIC) range of 0.78–3.13 μg/ml (2) against multidrug-resistant Gram-positive pathogens: vancomycin-resistant enterococci (VRE), vancomycin-intermediate resistant Staphylococcus aureus, and methicillin-resistant S. aureus (MRSA). The activity of pb-A3 is antagonized by the addition of cell-wall membrane particulates, and its inhibition of nascent peptidoglycan biosynthesis in a cell membrane extract suggests that pb-A3, like vancomycin, may target the peptidoglycan precursor lipid II (2, 3). Unlike vancomycin however, pb-A3 is active against VRE and its activity is not affected by the addition of the tripeptide acetyl-L-Lys-D-Ala-D-Ala (2). Thus, it appears that the binding site utilized by pb-A3 is distinct from that of vancomycin.
Figure 1.
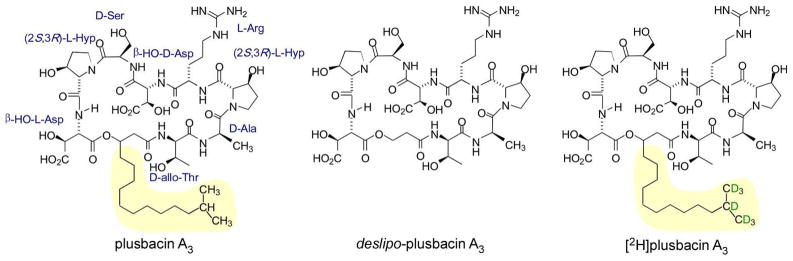
Chemical structure of pb-A3, deslipo-pb-A3, and [2H]pb-A3.
The lipophilic isotridecanyl side chain of pb-A3 is presumed to insert into the membrane bilayer, co-localizing the lipodepsipeptide at the site of peptidoglycan biosynthesis and possibly facilitating some form of drug aggregation and membrane disruption (4). The pb-A3, analogues deslipo-pb-A3 and [2H]pb-A3, were synthesized in order to test membrane insertion as key to the mode of action. The analogues share an identical depsipeptide core structure with pb-A3, however deslipo-pb-A3 (Figure 1, center) lacks the lipid side chain. [2H]Pb-A3 (Figure 1, right) is identical to the parent compound except for the 2H-labels incorporated into the isopropyl subunit of the lipid side chain. Table S1 of the Supporting Information lists the mimimun inhibitory concentrations (MICs) for these analogues.
To investigate in situ pb-A3 binding, we complexed [2H]pb-A3 with intact whole-cells of S. aureus grown in defined media containing [1-13C]glycine. The localization of [2H]pb-A3 in the cell wall was determined by 13C{2H} rotational-echo double resonance (REDOR) NMR (5). The proposed isotridecanyl side chain insertion into the phospholipid membrane was investigated by 31P{2H} REDOR NMR. These experiments measure the dipolar coupling between pairs of nuclei and therefore their internuclear separation.
Information about the in vivo pb-A3 mode of action was determined by adding a subinhibitory concentration of [2H]pb-A3 to S. aureus during mid-exponential growth phase in media containing either [1-13C]glycine and [ε-15N]lysine (to label cell-wall peptidoglycan bridge-links) or D-[1-13C]alanine and [15N]glycine (to label cross-links) (Figure 2, left). The drug-treated S. aureus whole cells were harvested after one hour of growth and the effects of the drug on cell-wall compositions analyzed by 13C{15N} and 15N{13C} REDOR NMR.
Figure 2.
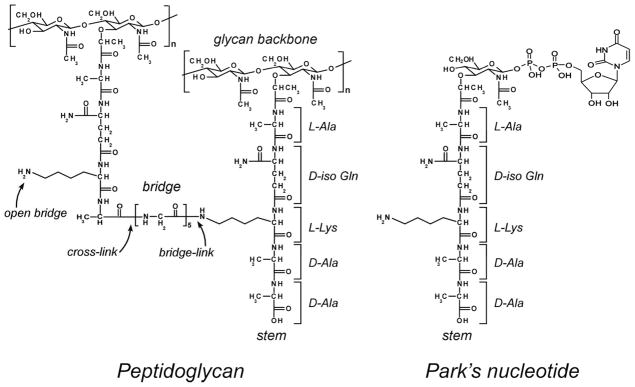
Left) Chemical structure of S. aureus peptidoglycan. The repeat unit on the right is an uncross-linked stem having the sequence L-Ala-D-iso-Gln-L-Lys-D-Ala-D-Ala. The pentaglycyl bridge attached to the ε-nitrogen of L-lysine is cross-linked to the peptide stem on the left. Right) Chemical structure of the cytoplasmic peptidoglycan precursor Park’s nucleotide.
Materials and Methods
Synthesis of plusbacin-A3
The detailed chemical synthesis of [2H]Pb-A3 is presented in the Supporting Information.
Susceptibility Testing
Minimum inhibition concentrations (MICs) for pb-A3, deslipo-pb-A3, and [2H]pb-A3, against Streptococcus pyogenes M49 strain NZ131, Streptococcus agalactiae strain A909, MRSA (ATCC 33591), VRE (ATCC 51299), Escherichia coli (ATCC 25922), and Pseudomonas aeruginosa (ATCC 27853) were determined by the microdilution method recommended by the National Committee for Clinical Laboratory Standards procedure (Table S1).
Growth and labeling of whole cells and formation of the drug complex
Starter culture of S. aureus (ATCC 6538P) was grown overnight in 5 ml of trypticase soy broth at 37 °C with 250 rpm shaking and added (1% final volume) to a one-liter flask containing 335 ml of defined media (6) with the naturally abundant amino acid glycine replaced by isotope-labeled [1-13C]glycine to incorporate 13C-specific label at the pentaglycyl cross bridge of the peptidoglycan (Figure 2, left). S. aureus was harvested under stationary-phase growth (OD660nm at 1.0) as described (6) and then resuspended in 7 ml of 40 mM triethanolamine buffer. To 2 ml of water, 3.9 mg of [2H]pb-A3 (MW 1165.32) was dissolved and added dropwise to the cell suspension with gentle stirring. The bacteria-pb-A3 mixture was equilibrated for six minutes prior to freezing and lyophilization.
[2H]pb-A3 addition during growth of S. aureus
S. aureus was grown in four one-liter flasks each containing 330 ml of defined media (6) containing isotope-labeled [1-13C]glycine and L-[ε-15 N]lysine for the 13C-15N pair labeling of the bridge-link, or D-[1-13C]alanine and [15N]glycine in the presence of alanine-racemase inhibitor alaphosphin (5 μg/ml) for 13C-15N pair labeling of the cross-link of peptidoglycan (Figure 2, left). [2H]Pb-A3 was added to S. aureus during the mid-exponential growth phase (OD660nm at 0.5) to final concentration of 11.8 μg/ml. The cells were harvested by centrifugation after 1 hr of growth. The harvested cells were resuspended in 7 ml of 40 mM triethanolamine buffer and lyophilized.
Internuclear proximities
REDOR was used to determine dipolar couplings and hence internuclear distances (5). REDOR is a difference experiment in which two spectra are collected, S0 (full echo) and S (dephased echo). Dipolar evolution over the rotor period in the S spectrum results in reduced (dephased) peak intensity for spin pairs that are dipolar coupled. From the difference in signal intensity (REDOR difference, ΔS = S0 − S) and the experimental dephasing time (the dipolar evolution time), the heteronuclear dipolar coupling and corresponding internuclear distance can be directly calculated (5).
Solid-state NMR
The 31P{2H} and 13C{2H} REDOR spectra of Figure 3 were acquired using an 89-mm bore, 12-T static field (1H at 500 MHz, Magnex, Agilent, Santa Clara, CA, USA), with a Tecmag (Houston, TX, USA) Apollo spectrometer, and four-channel transmission-line probes equipped with either 4-mm (Figure 3, left) or 5-mm (Figure 3, right) Chemagnetics/Varian stators and zirconium rotors. Radio frequency pulses for 1H were amplified first by a 50-W American Microwave Technology (AMT, Anaheim, CA, USA) power amplifier and then by a 2-kW Creative Electronics tube amplifier. One-kW AMT amplifiers were used for 31P and 13C pulses. For 2H, a 2-kW AMT amplifier was used. The π-pulse lengths were 6 μs for 31P, 13C, and 2H. The 1H decoupling field was 100 kHz throughout dipolar evolution and data acquisition with TPPM of the 1H radio frequency (8).
Figure 3.
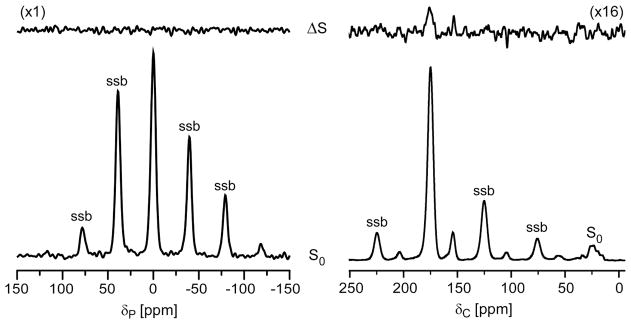
Left) 202.4-MHz 31P{2H} REDOR spectra of [2H]pb-A3 complexes of whole-cells of S. aureus after dipolar evolution of 20.0 ms. The full-echo spectrum (S0) is at the bottom of the figure, and the REDOR difference (ΔS) at the top. The spectra were the result of the accumulation of 378,664 scans. Magic-angle spinning was at 8000 Hz. The absence of dephasing indicates that [2H]pb-A3 did not embed in the membrane. Right) 125-MHz 13C{2H} REDOR spectra of [2H]pb-A3 complexes of whole-cells of S. aureus grown in defined media containing [1-13C]glycine after dipolar evolution of 31.4 ms. The spectra were the result of the accumulation of 249,660 scans. Magic-angle spinning was at 6250 Hz. The dephasing indicates that the isotridecanonyl side chain of [2H]pb-A3 is found near the pentaglycyl bridge segment of S. aureus peptidoglycan. Spinning side bands are marked as “ssb.”
The 13C{15N} and 15N{13C} REDOR spectra of Figures 4, 5, 6, 7, and S3 were acquired at a spinning speed of 5 kHz in a 4.7-T, 89-mm Oxford magnet (200 MHz, Cambridge, England), using a Tecmag Libra pulse generator and a four-channel transmission-line probe with a Chemagnetics 7.5-mm stator. One-kW amplifiers were used for all frequencies. The π-pulse lengths were 10 μs for 13C and 15N. Cross-polarization transfers were made at 50 kHz for 2 ms and 1H decoupling was at 98 kHz throughout dipolar evolution and data acquisition.
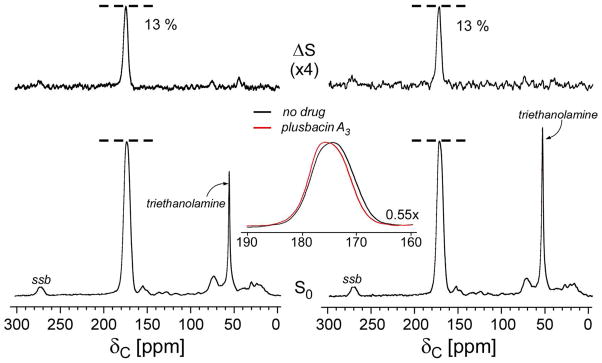
Figure 4.

50.3-MHz 13C{15N} REDOR spectra after dipolar evolution of 1.6 ms of whole-cells of S. aureus grown on defined media containing [1-13C]glycine and L-[ε-15N]lysine in the absence (left), and in the presence (right) of [2H]pb-A3 (11.8 μg/ml). The full-echo spectra (S0) are at the bottom of the figure, and the REDOR differences (ΔS) at the top. Magic-angle spinning was at 5000 Hz. Identical 172-ppm dephasing of 13% in the ΔS spectra for S. aureus grown in the absence and in the presence of lipodepsipeptide indicates that [2H]pb-A3 did not target the fem factors associated with pentaglycyl bridge formation. The reduced 149-ppm peak intensity in the S0 spectrum of S. aureus grown in the presence of [2H]pb-A3 (highlighted in the inset) was consistent with the inhibition of [1-13C]glycine metabolism in purine biosynthesis. The spectra were the result of the accumulation of 10,000 scans. Spinning side bands are marked as “ssb.”
Figure 5.

20.3-MHz 15N{13C} REDOR full-echo spectra after dipolar evolution of 1.6 ms of whole-cells of S. aureus grown on defined media containing [1-13C]glycine and L-[ε-15N]lysine in the absence (left), and in the presence (right) of [2H]pb-A3 (11.8 μg/ml). The drug-treated S. aureus shows reduced lysyl-amide peak intensity at 93 ppm (cell-wall thinning) and increased lysyl-amine peak intensity at 9 ppm (accumulation of Park’s nucleotide). The spectra were normalized with respect to equal sample weight and scans and were each the result of the accumulation of 20,000 scans. Magic-angle spinning was at 5000 Hz.
Figure 6.
50.3-MHz 13C{15N} REDOR spectra after dipolar evolution of 1.6 ms of whole-cells of S. aureus grown on defined media containing D-[1-13C]alanine and [15N]glycine in the absence (left), and in the presence (right) of [2H]pb-A3. The full-echo spectra (S0) are at the bottom of the figure, and the REDOR differences (ΔS) at the top. The 175-ppm peak in the ΔS spectra is from the cross-link of the peptidoglycan in the cell wall of S. aureus. The addition of [2H]pb-A3 during the growth of S. aureus did not inhibit the transpeptidase activity of peptidoglycan biosynthesis in S. aureus and therefore the dephasing of 175-ppm peak intensity was not affected. The inset is an expansion of the superimposed carbonyl-carbon S0 spectra for S. aureus grown in the presence (red) and in the absence (black) of [2H]pb-A3. The addition of [2H]pb-A3 affected the line shape of 13C-carbonyl spectrum centered at 175 ppm. The spectra were the result of the accumulation of 10,000 scans. Spinning side bands are marked as “ssb.”
Figure 7.

Enlargements of the carbonyl-carbon region of the S0 spectra shown in Figure 6. The full-echo spectrum for S. aureus grown in the presence of [2H]pb-A3 (top) is subtracted from the corresponding spectrum without drug addition (middle). The difference spectrum (bottom) shows a positive peak at 178 ppm due to the penultimate D-Ala carbonyl carbon of increased Park’s nucleotide, and a negative peak at 170 ppm due to ester-linked D-Ala incorporated into teichoic acid.
All spinning rates were actively controlled to ±2 Hz. Similarly, all RF field amplitudes were under active control to eliminate long term drifts due to component aging or changes in temperature (9). Additionally, alternating scans of S0 and S were acquired to compensate for short-term drift. XY-8 phase cycling (10) was used for all refocusing and dephasing pulses (11).
Calculations
REDOR dephasing for spin-1/2 pairs was calculated using the analytical expressions of Mueller et al. (12). REDOR dephasing for the rapidly rotating CD3 dephaser was approximated as a single super spin centered in the triangle defined by the three 2H nuclei (13–15). The abbreviation 2H3 is used to denote the super spin. For both these calculations, fits of ΔS/S0 as a function of dephasing time yields the dipolar coupling constant and hence the internuclear distance.
Results
Antimicrobial activities of pb-A3, deslipo-pb-A3, and [2H]pb-A3
The MICs of pb-A3, deslipo-pb-A3, and [2H]pb-A3 against Gram-positive and Gram-negative bacteria are shown in Table S1. Pb-A3 exhibits a MIC range of 0.2 to 6.25 μg/ml against the Gram-positive bacteria: S. pyogenes M49 strain NZ131, S. agalactiae strain A909, MRSA (ATCC 33591), and VRE (ATCC 51299). However, it is inactive against Gram-negative organisms, Escherichia coli (ATCC 25922) and Pseudomonas aeruginosa (ATCC 27853). Deslipo-pb-A3 has no activity in the strains examined. The 2H incorporation in [2H]pb-A3 did not alter any pb-A3 antimicrobial properties.
[2H]pb-A3 membrane anchor
202.4-MHz 31P{2H} REDOR spectra of [2H]pb-A3 complexed with [1-13C]glycine-labeled whole-cells of S. aureus after 20 ms of dipolar evolution are shown in Figure 3 (left). The P{D} detection range was 10 Å for these experiments. This estimate is based on ΔS/S0 < 2%, or two times the noise level for the sum of the centerband and first two spinning sidebands (Figure 3, left), where about 20% of S0 is due to 31P in the bilayer and the remainder is mostly wall- and lipoteichoic acids (see Figure 8 in reference 7). A fully extended 11-carbon side chain has a length of 8–10 Å (16). Thus, the absence of dipolar contact between 2H3 and the natural abundance 31P of the lipid head groups in the REDOR difference spectrum (Figure 3, top left) rules out insertion of the isotridecanyl tail of [2H]pb-A3 into the lipid bilayer.
[2H]pb-A3 binding to [1-13C]glycine-labeled whole cells
Figure 3 (right) shows 125-MHz 13C{2H} REDOR spectra after 31.4 ms of dipolar evolution. In the ΔS spectrum, the glycyl carbonyl-carbon positioned at 172-ppm is dephased by 1% indicating that [2H]pb-A3 is localized within the cell wall. The estimated asymptotical REDOR dephasing limit is a product of (i) drug binding-site occupancy, (ii) the fraction of peptidoglycan stems with a glycyl bridge attached, and (iii) the fraction of glycine found in the cell wall.
To determine the first factor, the [2H]pb-A3-binding site occupancy, we estimated the total number of peptidoglycan stems found in whole-cells of S. aureus. Based on a vancomycin binding assay (7), we estimated that 14.3 μmol of peptidoglycan stems are present in whole cells of S. aureus grown in 335 ml of defined media harvested at OD660 1.0. This is a sum of uncross-linked peptidoglycan stems terminating in D-Ala-D-Ala (6.6 μmol) and cross-linked stems (7.7 μmol). Therefore, for 3.9 mg of [2H]pb-A3 (3.4 μmol) complexed to whole cells the estimated binding site occupancy is 24% (3.4 μmol/14.3 μmol).
The second factor, the fraction of stems with a pentaglycyl bridge attached, is approximately 85% for cells harvested under stationary-phase conditions (7). The third factor, the fraction of glycine found in the cell wall of S. aureus was determined from 13C{15N} REDOR spectra of whole-cells of S. aureus labeled with [1-13C]glycine and L-[ε-15N]lysine (Figure 4, left). During a dipolar evolution of 1.6 ms, only the peptide bonded 13C-15N spin pairs from the peptidoglycan bridge link, [1-13C]glycine-L-[ε-15N]lysine, appear at 172 ppm in the ΔS spectrum. (This ignores the minor natural-abundance 13C contribution to S0.) The dephased 172-ppm intensity (13%) multiplied by 5 to account for the total number of glycines found in a pentaglycyl bridge, means that 65% of the [1-13C]glycine label in whole cells of S. aureus is found in the cell wall. Thus, the estimated maximum 13C{2H} REDOR dephasing limit is (.24)(.85)(.65)=13%. Depending on the position of the 2H, multiple glycyl carbonyl carbons in the pentaglycyl bridge can dephase. If we assume only one carbonyl carbon dephases, the dephasing limit is 2.6% (13%/5), and the corresponding 13C-2H3 distance for the measured 13C{2H} REDOR dephasing of 1% after 31.4 ms of dipolar evolution is 7 Å.
The addition of [2H]pb-A3 did not affect [1-13C]glycine incorporation into cell wall as evident by the equal 172 ppm dephasing of 13% measured for both drug-treated and untreated S. aureus (Figure 4). Instead, [2H]pb-A3-treated S. aureus shows a reduced purine peak at 149 ppm in the S0 spectrum (Figure 4, inset).
[2H]pb-A3 addition to growing S. aureus labeled by [1-13C]glycine and L-[ε-15N]lysine
Figure 5 shows 20.3-MHz 15N{13C} REDOR S0 spectra of whole-cells of S. aureus grown in defined media containing [1-13C]glycine and L-[ε-15N]lysine without (left) and with (right) the addition of [2H]pb-A3 during growth. The S0 spectra were scaled by a factor determined from 13C spectra shown in Figure 4 to normalize the natural-abundance lipid-peak intensities found at 10–30 ppm.
The addition of [2H]pb-A3 during S. aureus growth diminished the 95-ppm lysyl amide peak consistent with [2H]pb-A3 inhibition of cell-wall biosynthesis, and increased the 9-ppm lysyl amine peak intensity, which indicates an accumulation of the cytoplasmic peptidoglycan precursor, Park’s nucleotide (Figure 2, right). The inhibition of purine biosynthesis by [2H]pb-A3 (Figure 4) is also consistent with transglycosylase inhibition where all available glycine is routed to peptidoglycan biosynthesis thereby indirectly preventing [1-13C]glycine incorporation in the purine biosynthetic pathway (17, 18). These results are identical to those obtained with vancomycin, a known transglycosylase inhibitor (17, 18). Thus, pb-A3 also appears to be a transglycosylase inhibitor.
[2H]pb-A3 addition to growing S. aureus labeled by D-[1-13C]alanine and [15N]glycine
The D-[1-13C]alanine incorporated into cell wall appears at 175 ppm in the S0 spectra of the 50.3-MHz 13C{15N} REDOR spectra shown in Figure 6 (bottom). The alanine racemase inhibitor, alaphosphin (5 μg/ml), prevents the racemic scrambling of D-[1-13C]alanine to its enantiomeric L-form (6). During the short dipolar evolution period of 1.6 ms, only the peptide bonded 13C-15N spin pairs from amino acids having the sequence D-[1-13C]Ala-[15N]Gly (peptidoglycan cross-link) appear in the ΔS spectrum. The addition of [2H]pb-A3 (11.8 μg/ml) did not change the ΔS 175-ppm peak intensity (Figure 6, top) and therefore transpeptidase activity was not inhibited.
Figure S3 shows 15N{13C} REDOR spectra after dipolar evolution of 1.6 ms where dephasing of the 15N glycyl-amide peak, which is also directly proportional to the extent of cross-linking in whole-cells, was not affected by the [2H]pb-A3 addition, consistent with the 13C{15N} results of Figure 6 for the same sample.
The superimposed enlarged carbonyl-carbon region of the full echo (S0) spectra of S. aureus cells grown with (red line) and without (black lines) [2H]pb-A3 are shown in Figure 6 (inset). The differing line shapes in the 175-ppm region indicate differences in the cell-wall composition. Figure 7 (bottom) shows the spectral subtraction of the 175-ppm full-echo spectrum of S. aureus cells grown in the presence of [2H]pb-A3 (Figure 7, top) from the full-echo spectrum of untreated S. aureus cells (Figure 7, middle). The difference spectrum shows two distinct components: a positive peak at 178 ppm, and a negative peak at 170 ppm. The positive 178-ppm peak is assigned to the carboxyl terminus of the penultimate D-Ala, associated with an accumulation of Park’s nucleotide in the cytoplasm due to transglycosylase inhibition (18). The negative 170-ppm peak corresponds to decreased ester-linked D-[1-13C]alanine found in cell-wall teichoic acid (19).
Discussion
The chemical structure of plusbacin consists of a cyclic depsipeptide core with a lipophilic side chain. This is a common structural motif found in numerous natural products of cyclic antimicrobial (depsi)peptides including the calcium-dependent antibiotic complex A54145, friulimicin/amphomycin, laspartomycin, ramoplanin, fusaricidin, empedopeptin, and daptomycin (20). The mode of action for most of these natural products is not well known, but for daptomycin (Cubicin®) the lipophilic side chain is thought to mediate the formation of drug oligomers that form a pore structure in the bacterial membrane (4, 21). The ensuing bacterial membrane depolarization is generally accepted as the killing mechanism for daptomycin, and daptomycin-related natural products. The isotridecanyl side chain of pb-A3 was presumed to play a similar role in targeting the bacterial membrane.
For [2H]pb-A3 complexed to intact whole-cells of S. aureus, P{D} REDOR showed that [2H]pb-A3 was not embedded in the membrane (Figure 3, left). This result is consistent with the absence of lipid natural-abundance 13C aliphatic-carbon C{D} dephasing by[2H]pb-A3 (Figure 3, right), which would have been expected from an embedded 2H-labeled side chain (22). Therefore, at therapeutic dosage levels for intact whole cells, the isotridecanyl side chain of [2H]pb-A3 does not mediate drug binding to the membrane or the formation of a drug-aggregated membrane pore structure. Instead, we find [2H]pb-A3 localized within the cell wall. The dipolar contact between the deuterium labels of [2H]pb-A3 and the carbonyl-carbon labels of [1-13C]glycine in the peptidoglycan cross bridge (Figure 3, right), shows unambiguously that the isotridecanyl side chain is involved in cell-wall binding.
The addition of [2H]pb-A3 (11.8 μg/ml) to whole-cells of S. aureus during the mid-exponential growth (OD660 at 0.5) showed no inhibition of the transpeptidation step of peptidoglycan biosynthesis (Figures 4 and S3). Although transpeptidase inhibition may occur at higher drug concentrations, the accumulation of a cytoplasmic peptidoglycan precursor (Park’s nucleotide), and inhibition of purine biosynthesis (Figures 4 and 5), are consistent with [2H]Pb-A3 acting primarily as a transglycosylase inhibitor in S. aureus.
We also found that [2H]pb-A3 inhibited D-[1-13C]alanine incorporation into cell-wall teichoic acids (Figure 7). Similar inhibition of peptidoglycan and teichoic acid biosynthesis has been observed for S. aureus cells treated with vancomycin and oritavancin (19). Such dual inhibition may be due to drug targeting of lipid II (or the membrane-associated nascent peptidoglycan) and the resulting unavailability of lipid transporter bactoprenol phosphate (23). Because [2H]pb-A3 is fully active only in the presence of the intact cell wall, a conventional inhibition assay based on isolated, purified enzymes and substrates could miss the dual inhibition.
The molecular role of the isotridecanyl side chain in [2H]pb-A3 for transglycosylase inhibition remains unknown. However, the drug side chain is essential for antimicrobial activity. The MICs of pb-A3 and deslipo-pb-A3 (pb-A3 without the isotridecanyl side chain) show deslipo-pb-A3 has no antimicrobial activity (Table S1). The isotridecanyl side chain may simply act as a steric blocker, preventing substrates from reaching the transglycosylase active site (24). A similar role has been suggested (17) for the hydrophobic sidechain of oritavancin, which inserts in cell-wall-free bilayers but not in the bilayers of whole cells (22).
Supplementary Material
Table S1. Minimum inhibitory concentrations (μg/mL) of pb-A3, deslipo-pb-A3, and [2H]pb-A3.
Figure S1. Retrosynthetic analysis for [2H]pb-A3.
Figure S2. Preparation of isotopically labeled depsipeptide fragment 5.
Figure S3. 20.3-MHz 15N{13C} REDOR spectra after dipolar evolution of 1.6 ms of whole-cells of S. aureus grown in defined media containing D-[1-13C]alanine and [15N]glycine in the absence (left), and in the presence of [2H]pb-A3 (right).
Abbreviations
- 13C{2H} or C{D}
carbon-channel observation with deuterium dephasing
- 13C{15N} or C{N}
carbon-channel observation with nitrogen dephasing
- 15N{13C} or N{C}
nitrogen-channel observation with carbon dephasing
- 31P{2H} or P{D}
phosphorus-channel observation with deuterium dephasing
- REDOR
rotational-echo double resonance
Footnotes
This paper is based on work supported by the National Institutes of Health grant numbers AI059327 (MV) and EB002058 (JS).
A description of the synthesis of [2H]pb-A3 can be found in the supporting information along with the following table and figures
This material is available free of charge via the Internet at http://pubs.acs.org.
References
- 1.Shoji J, Hinoo H, Katayama T, Matsumoto K, Tanimoto T, Hattori T, Higashiyama I, Miwa H, Motokawa K, Yoshida T. Isolation and characterization of new peptide antibiotics, plusbacins A1–A4 and B1–B4. J Antibiot. 1992;45:817–823. doi: 10.7164/antibiotics.45.817. [DOI] [PubMed] [Google Scholar]
- 2.Maki H, Miura K, Yamano Y. Katanosin B and plusbacin A3, inhibitors of peptidoglycan synthesis in methicillin-resistant Staphylococcus aureus. Antimicrob Agents Chemother. 2001;45:1823–1827. doi: 10.1128/AAC.45.6.1823-1827.2001. [DOI] [PMC free article] [PubMed] [Google Scholar]
- 3.Wohlrab A, Lamer R, VanNieuwenhze MS. Total synthesis of plusbacin A3: a depsipeptide antibiotic active against vancomycin-resistant bacteria. J Am Chem Soc. 2007;129:4175–4177. doi: 10.1021/ja068455x. [DOI] [PMC free article] [PubMed] [Google Scholar]
- 4.Straus SK, Hancock RE. Mode of action of the new antibiotic for Gram-positive pathogens daptomycin: comparison with cationic antimicrobial peptides and lipopeptides. Biochim Biophys Acta. 2006;1758:1215–1223. doi: 10.1016/j.bbamem.2006.02.009. [DOI] [PubMed] [Google Scholar]
- 5.Gullion T, Schaefer J. Rotational-echo double-resonance NMR. J Magn Reson. 1989;81:196–200. doi: 10.1016/j.jmr.2011.09.003. [DOI] [PubMed] [Google Scholar]
- 6.Tong G, Pan Y, Dong H, Pryor R, Wilson GE, Schaefer J. Structure and dynamics of pentaglycyl bridges in the cell walls of Staphylococcus aureus by 13C- 15 N REDOR NMR. Biochemistry. 1997;36:9859–9866. doi: 10.1021/bi970495d. [DOI] [PubMed] [Google Scholar]
- 7.Kim SJ, Cegelski L, Studelska DR, O’Connor RD, Mehta AK, Schaefer J. Rotational-echo double resonance characterization of vancomycin binding sites in Staphylococcus aureus. Biochemistry. 2002;41:6967–6977. doi: 10.1021/bi0121407. [DOI] [PubMed] [Google Scholar]
- 8.Bennett AE, Reienstra CM, Auger M, Lakshmi KV, Griffin RG. Heteronuclear decoupling in rotating solids. J Chem Phys. 1995;103:6951–6958. [Google Scholar]
- 9.Stueber D, Mehta AK, Chen Z, Wooley KL, Schaefer J. Local order in polycarbonate glasses by 13C{19F} Rotational-Echo Double-Resonance NMR. J Polym Sci, Part B: Polym Phys. 2006;44:2760–2775. [Google Scholar]
- 10.Gullion T, Baker DB, Conradi MS. New, compensated Carr-Purcell sequences. J Magn Reson. 1990;89:479–484. [Google Scholar]
- 11.Weldeghiorghis TK, Schaefer J. Compensating for pulse imperfections in REDOR. J Magn Reson. 2003;165:230–236. doi: 10.1016/j.jmr.2003.08.005. [DOI] [PubMed] [Google Scholar]
- 12.Mueller KT, Jarvie TP, Aurentz DJ, Roberts BW. The REDOR transform: direct calculation of internuclear couplings from dipolar-dephasing NMR data. Chem Phys Lett. 1995;242:535–542. [Google Scholar]
- 13.Goetz JM, Schaefer J. REDOR dephasing by multiple spins in the presence of molecular motion. J Magn Reson. 1997;127:147–154. doi: 10.1006/jmre.1997.1198. [DOI] [PubMed] [Google Scholar]
- 14.Kim SJ, Cegelski L, Preobrazhenskaya M, Schaefer J. Structures of Staphylococcus aureus cell-wall complexes with vancomycin, eremomycin, and chloroeremomycin derivatives by 13C{19F} and 15N{19F} rotational-echo double resonance. Biochemistry. 2006;45:5235–5250. doi: 10.1021/bi052660s. [DOI] [PMC free article] [PubMed] [Google Scholar]
- 15.Paik Y, Yang C, Metaferia B, Tang S, Bane S, Ravindra R, Shanker N, Alcaraz AA, Johnson SA, Schaefer J, O’Connor RD, Cegelski L, Snyder JP, Kingston DG. Rotational-echo double-resonance NMR distance measurements for the tubulin-bound Paclitaxel conformation. J Am Chem Soc. 2007;129:361–370. doi: 10.1021/ja0656604. [DOI] [PMC free article] [PubMed] [Google Scholar]
- 16.Lewis BA, Engelman DM. Lipid bilayer thickness varies linearly with acyl chain length in fluid phosphatidylcholine vesicles. J Mol Biol. 1983;166:211–217. doi: 10.1016/s0022-2836(83)80007-2. [DOI] [PubMed] [Google Scholar]
- 17.Kim SJ, Cegelski L, Stueber D, Singh M, Dietrich E, Tanaka KS, Parr TR, Far AR, Schaefer J. Oritavancin exhibits dual mode of action to inhibit cell-wall biosynthesis in Staphylococcus aureus. J Mol Biol. 2008;377:281–293. doi: 10.1016/j.jmb.2008.01.031. [DOI] [PMC free article] [PubMed] [Google Scholar]
- 18.Cegelski L, Kim SJ, Hing AW, Studelska DR, O’Connor RD, Mehta AK, Schaefer J. Rotational-echo double resonance characterization of the effects of vancomycin on cell wall synthesis in Staphylococcus aureus. Biochemistry. 2002;41:13053–13058. doi: 10.1021/bi0202326. [DOI] [PubMed] [Google Scholar]
- 19.Cegelski L, Steuber D, Mehta AK, Kulp DW, Axelsen PH, Schaefer J. Conformational and quantitative characterization of oritavancin-peptidoglycan complexes in whole cells of Staphylococcus aureus by in vivo 13C and 15N labeling. J Mol Biol. 2006;357:1253–1262. doi: 10.1016/j.jmb.2006.01.040. [DOI] [PubMed] [Google Scholar]
- 20.Baltz RH, Miao V, Wrigley SK. Natural products to drugs: daptomycin and related lipopeptide antibiotics. Nat Prod Rep. 2005;22:717–741. doi: 10.1039/b416648p. [DOI] [PubMed] [Google Scholar]
- 21.Silverman JA, Perlmutter NG, Shapiro HM. Correlation of Daptomycin Bacterial Activity and Membrane Depolarization in Staphylococcus aureus. Antimicrob Agents Chemother. 2003;47:2538–2544. doi: 10.1128/AAC.47.8.2538-2544.2003. [DOI] [PMC free article] [PubMed] [Google Scholar]
- 22.Kim SJ, Singh M, Schaefer J. Oritavancin binds to isolated protoplast membranes but not intact protoplasts of Staphylococcus aureus. J Mol Biol. 2009;391:414–425. doi: 10.1016/j.jmb.2009.06.033. [DOI] [PMC free article] [PubMed] [Google Scholar]
- 23.Schneider T, Sahl HG. Lipid II and other bactoprenol-bound cell wall precursors as drug targets. Curr Opin Investig Drugs. 2010;11:157–164. [PubMed] [Google Scholar]
- 24.Kim SJ, Matsuoka S, Patti GJ, Schaefer J. Vancomycin derivitive with damaged D-Ala-D-Ala binding cleft binds to cross-linked peptidoglycan in the cell wall of Staphylococcus aureus. Biochemistry. 2008;47:3822–3831. doi: 10.1021/bi702232a. [DOI] [PMC free article] [PubMed] [Google Scholar]
Associated Data
This section collects any data citations, data availability statements, or supplementary materials included in this article.
Supplementary Materials
Table S1. Minimum inhibitory concentrations (μg/mL) of pb-A3, deslipo-pb-A3, and [2H]pb-A3.
Figure S1. Retrosynthetic analysis for [2H]pb-A3.
Figure S2. Preparation of isotopically labeled depsipeptide fragment 5.
Figure S3. 20.3-MHz 15N{13C} REDOR spectra after dipolar evolution of 1.6 ms of whole-cells of S. aureus grown in defined media containing D-[1-13C]alanine and [15N]glycine in the absence (left), and in the presence of [2H]pb-A3 (right).