

Abstract
Background
Personalized cancer therapy remains a challenge. In this context, we attempted to identify correlations between tumour angiogenesis, tumour metabolism and tumour cell type. To this aim, we used single=phase multidetector computed tomography (MDCT) and hybrid positron emission tomography-computed tomography (PET/CT) to determine whether net enhancement and standardized uptake value (SUVmax) were correlated with tumour size and cytology in patients affected by non-small cell lung cancer (NSCLC).
Material/Methods
Our study included 38 patients (30 men, 8 women, mean age 70) with a NSCLC measuring between 3 cm and 7 cm, using a 16-slice multidetector CT (Brilliance Philips) and with PET-CT (Biograph 16 Siemens Medical Solutions). The following lesion parameters were evaluated: maximum diameter, medium density before contrast injection (CTpre), medium density after contrast injection (CTpost average), density in the most enhanced part of the lesion after contrast (CTpost max), net enhancement, SUVmax, age, and cytology. Correlation coefficient and p-value were computed for each pair of variables. In addition, correlations were computed for each pair of variables, and for all combinations of tumour types. We focused on subsets of data with more than 10 observations, and with correlation r>0.500 and p<0.05.
Results
A weak correlation (r=0.32; p=0.048) was found between SUVmax and tumour size; the correlation was stronger for masses larger than 31 mm (r=0.4515; p=0.0268). No other correlations were found among the variables examined.
Conclusions
Our data may have prognostic significance, and could lead to more appropriate surgical treatment and better treatment outcome.
Keywords: non-small cell lung carcinoma, multidetector computed tomography, positron emission tomography - computed tomography, fine needle aspiration biopsy, lung cancer
Background
Lung cancer is the most frequent cause of cancer mortality [1] in both men and women [2,3]. There are 2 main types of primary lung cancer, which are classified according to cellular population involved: non-small cell lung cancer (NSCLC) and small cell lung cancer. Clinical risk factors for malignancy are age, a history of smoking, hemoptysis, and previous malignancy [4]. Computerized tomography and positron emission tomography-computed tomography (PET/CT) are crucial for the diagnosis and follow-up of patients affected by lung cancer [4–6]. The aim of this study was to use MDCT and hybrid PET/CT systems to determine whether net enhancement and SUVmax were correlated with tumour size and cytology in patients affected by NSCLC. This disease is an important health problem. Our study could thus be of prognostic significance, and could lead to a more appropriate use of surgical adjuvant treatment and better treatment outcomes.
Material and Methods
Patients
We retrospectively reviewed patients with NSCLC who underwent staging with total body 16-slice multi-detector CT scanning (Brilliance Philips) and with PET/CT (Biograph 16 Siemens Medical Solutions) over a period of 2 years. We studied a selected group of patients affected by N0–N1 and M0 disease and with lesions larger than 3 cm. The final study group consisted of 38 patients (30 men, 8 women, mean age 70 years) with a pulmonary lesion measuring between 3 and 7 cm. These patients were not pre-treated with radio- or chemotherapy. Informed consent was obtained from all 38 patients. The patients’ characteristics are reported in Table 1.
Table 1.
Cytology, dimension of tumour, CTpre average, CTpost average, CTpost max, net enhancement and SUVmax.
| Cytology | Dimension mm | CT pre-average | CT post-average | NE | CT post-max | SUVmax |
|---|---|---|---|---|---|---|
| Squamous cell carcinoma | 50 | 30 | 91 | 61 | 129 | 30 |
| Squamous cell carcinoma | 40 | 39 | 47 | 8 | 86 | 2.3 |
| NSCLC | 49 | 35 | 76 | 41 | 140 | 14 |
| NSCLC | 48 | 56 | 71 | 15 | 100 | 7.2 |
| Adenocarcinoma | 54 | 58 | 98 | 40 | 141 | 9.8 |
| Squamous cell carcinoma | 40 | 40 | 70 | 30 | 84 | 11 |
| NSCLC | 38 | 35 | 60 | 25 | 128 | 13 |
| NSCLC | 30 | 28 | 89 | 61 | 141 | 15 |
| NSCLC | 50 | 33 | 59 | 26 | 115 | 15 |
| Adenocarcinoma | 30 | 24 | 70 | 46 | 98 | 11 |
| Large cell | 52 | 13 | 34 | 21 | 74 | 13 |
| Adenocarcinoma | 30 | 40 | 67 | 27 | 72 | 8.8 |
| Large cell | 41 | 28 | 55 | 27 | 110 | 13 |
| Large cell | 41 | 21 | 41 | 20 | 139 | 19 |
| Squamous cell carcinoma | 64 | 37 | 48 | 11 | 67 | 20 |
| Adenocarcinoma | 30 | 43 | 69 | 26 | 107 | 8.1 |
| Adenocarcinoma | 30 | 39 | 77 | 38 | 120 | 12 |
| Adenocarcinoma | 40 | 57 | 102 | 45 | 128 | 11.2 |
| Adenocarcinoma | 50 | 20 | 103 | 83 | 181 | 40 |
| Adenocarcinoma | 32 | 39 | 56 | 17 | 90 | 10 |
| Adenocarcinoma | 41 | 36 | 91 | 55 | 117 | 4 |
| Adenocarcinoma | 41 | 38 | 58 | 20 | 90 | 9.2 |
| Adenocarcinoma | 35 | 38 | 101 | 63 | 152 | 6.1 |
| Adenocarcinoma | 56 | 32 | 65 | 33 | 114 | 34 |
| Adenocarcinoma | 30 | 65 | 83 | 18 | 116 | 11 |
| Adenocarcinoma | 30 | 23 | 29 | 6 | 46 | 15.4 |
| Adenocarcinoma | 30 | 22 | 69 | 47 | 106 | 3.6 |
| Adenocarcinoma | 30 | 32 | 87 | 55 | 142 | 2.5 |
| Adenocarcinoma | 54 | 42 | 61 | 19 | 87 | 12 |
| Squamous cell carcinoma | 41 | 20 | 87 | 67 | 118 | 3.4 |
| Squamous cell carcinoma | 30 | 35 | 115 | 80 | 151 | 8 |
| Squamous cell carcinoma | 30 | 28 | 33 | 5 | 84 | 4.6 |
| Squamous cell carcinoma | 30 | 34 | 86 | 52 | 116 | 38 |
| Squamous cell carcinoma | 60 | 26 | 65 | 39 | 95 | 13 |
| Squamous cell carcinoma | 45 | 31 | 38 | 7 | 68 | 9.7 |
| Squamous cell carcinoma | 47 | 42 | 66 | 24 | 125 | 12 |
| Squamous cell carcinoma | 30 | 45 | 110 | 65 | 155 | 13 |
| Squamous cell carcinoma | 31 | 21 | 34 | 13 | 114 | 12 |
Multidetector computed tomography
All patients underwent multidetector computed tomography (MDCT) (Brilliance 16, Philips Medical Systems, Best, The Netherlands) scanning before and after contrast injection using the following technical parameters: 1.5 mm collimation, 120 Kvp, 250 mA, pitch 0.9, rotation time 0.5 sec, 2 mm reconstruction thickness, 1 mm interval, and standard reconstruction algorithm. Using a biphasic protocol, 120 mL of contrast medium (350 mg of iodine per milliliter) were automatically injected in an antecubital vein: 80 ml at a flow rate of 2 mL/sec, followed by 40 ml at a flow rate of 1.5 mL/sec. A saline bolus of 40 ml at a flow rate of 1.5 ml/sec was injected after contrast media. Scanning was performed from the thoracic inlet to the pelvis 70 seconds after injection.
Net enhancement was calculated by drawing a region of interest (ROI) that covered about half the diameter of the lesion at the equator, but avoided calcified, cavitary and necrotic areas. All measurements in Hounsfield Units (HU) were obtained from the mediastinal window images to minimize partial volume averaging. Density was calculated before (CT pre) and after contrast medium injection, considering average density of the lesion (CT post average). Maximum density (CT-post max) and net enhancement were calculated by subtracting CT-pre values from CT-post average values.
Fine needle aspiration biopsy
All patients underwent fine needle aspiration biopsy (FNAB), which is a well-established, safe technique for the diagnostic work-up of lung lesions [7]. The sensitivity of FNAB for the diagnosis of lung cancer ranges from 56% to over 90% and specificity is close to 100% [7]. In almost all these studies, the overall positive predictive value was nearly 99%. While the false positive rate was generally less than 1%, a negative result is less reliable, with most studies reporting a false negative rate of around 10% [8].
Computerized tomography and positron emission tomography-computed tomography (PET/CT)
The injected dose of 18F-FDG varied between 350 and 450 MBq, depending on the patient’s weight. In patients with BMI <25, 350–400 MBq was administered, while patients with those with BMI >25 received 400–450 MBq. After patients had fasted overnight, we verified that their blood glucose level was below 140 mg before injecting the tracer. During the 60-min uptake phase, the patients were hydrated and instructed to rest comfortably. We used an integrated PET/CT scanner (Biograph 16 Siemens Medical Solutions) consisting of an ultrafast CT scanner with a 16-row multislice detector system, and a PET scanner equipped with a full-ring lutetium oxyorthosilicate system (LSO) with a crystal size of 4×4 mm2. Emission data were acquired for 6 to 8 bed positions, typically from the base apex of the skull to the upper thigh, and acquisition time was usually 3 min/bed position, resulting in a total PET scan time of approximately 20–25 min (7 or 8 bed positions), with axial image planes at a 16.2 cm axial field of view per position. The protocol included a low dose (120 KV; 95 mA) non-enhanced CT scan first for attenuation correction, and the 3D-whole-body PET from the base of the skull to the upper thigh. The CT data were used for attenuation correction of PET emission images. PET images were reconstructed by using an iterative algorithm (ordered-subset expectation maximization: 2 iterations, 8 subsets on a 128×128 matrix and with Gaussian post-filtering of 5 mm). The reconstructed PET, CT and fused images were displayed by commercially available software (e-soft/, Siemens Medical Solutions) in axial, coronal and sagittal planes by using a matrix of 128×128 pixels for the PET and 512×512 pixels for the CT and were analyzed by 3 experts in PET. The SUV was also calculated (Figure 1).
Figure 1.
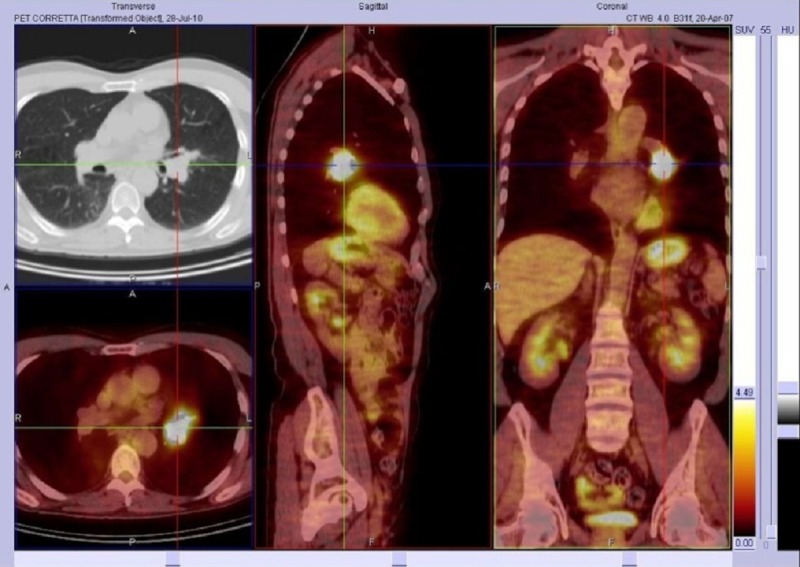
Adenocarcinoma in a 59-year-old man. PET/CT fusion images on axial, sagittal and coronal planes, abnormal 18F-FDG uptake at left lung pulmonary hilum, Max SUV=15.62.
Data description
The data obtained were examined in relation to the size and cytology of the pulmonary lesion. The data reported (tumour size, CTpre average, CTpost average, CTpost max, net enhancement SUVmax, age, cytological results) refer to the 38 patients.
Statistical analysis
Correlation coefficients and p-values were computed for each pair of variables. The p-value was computed by transforming the correlation to create a t-statistic with 36 degrees of freedom. The confidence bounds are based on an asymptotic normal distribution of 0.5*log((1+r)/(1−r)), with an approximate variance equal to 1/(n–3), with n=38. Moreover, to gain more insight, we computed the correlation for each pair of variables, and for all combinations of tumour types. The results were subsequently analyzed for subsets of data with more than 10 samples, and with correlation r>0.500 and p<0.05.
Results
As shown in Table 2, there were more male than female patients (n. 30 vs. n. 8), which reflects the prevalence of lung carcinoma in the population. Adenocarcinoma (Figure 2) accounted for approximately one-third of all lung cancers in our study, and is recognized as the most common histotype of lung cancer in many countries [9,10].
Table 2.
Number of patients, gender, mean age and cytology.
| Patients | Mean age (std. dev.) | Tumour | Number | |
|---|---|---|---|---|
| Male | 30 | 69 (7.88) | NSCLC | 3 |
| Adenocarcinoma | 12 | |||
| Large cell carcinoma | 2 | |||
| Squamous cell carcinoma | 13 | |||
|
| ||||
| Female | 8 | 63.625 (9.68) | NSCLC | 2 |
| Adenocarcinoma | 5 | |||
| Large cell carcinoma | 1 | |||
|
| ||||
| Total | 38 | 67.87 (8.32) | NSCLC | 5 |
| Adenocarcinoma | 17 | |||
| Large cell carcinoma | 3 | |||
| Squamous cell carcinoma | 13 | |||
Figure 2.
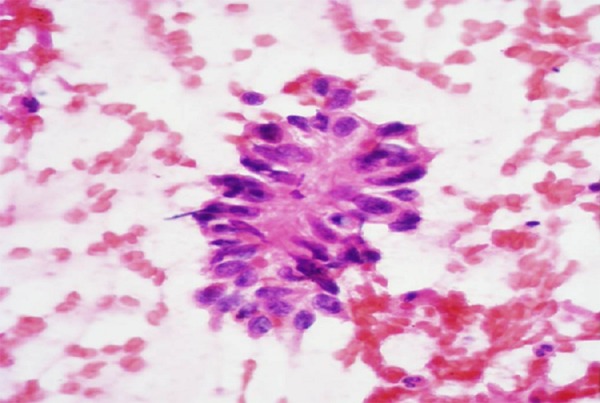
Cytologic evaluation of lung mass: Adenocarcinoma.
Overall, we identified a weak, albeit significant, correlation between SUVmax and tumour size (r=0.323, p=0.048). There was no correlation among the pre-contrastographic density of the lesions, net enhancement, average post-contrast density, maximum density and size of lesions (Table 3). The scatter plot of dimension versus SUVmax with the linear regression is depicted in Figure 3. In particular, we found that the correlation between SUVmax and size was stronger for lesions larger than 31 mm (r=0.4515, p=0.0268). The scatter plot with the regression fit is shown in Figure 4. Regarding the cytological classification, the correlation between tumour size and SUVmax was slightly stronger in the case of adenocarcinomas (Figure 5).
Table 3.
Correlation among pre-contrastographic density of the lesions, net enhancement, average post-contrast density, maximum density and dimension of lesions.
| Correlation | Dimension | CT pre average | CT post average | Net enhancement | CT post max | SUVmax |
|---|---|---|---|---|---|---|
| Dimension | 1.000 | −0.007 | −0.121 | −0.126 | −0.084 | 0.323 |
| CT pre average | −0.007 | 1.000 | 0.384 | −0.123 | 0.093 | −0.204 |
| CT post average | −0.121 | 0.384 | 1.000 | 0.869 | 0.751 | 0.107 |
| Net enhancement | −0.126 | −0.123 | 0.869 | 1.000 | 0.757 | 0.225 |
| CT post max | −0.084 | 0.093 | 0.751 | 0.757 | 1.000 | 0.238 |
| SUVmax | 0.323 | −0.204 | 0.107 | 0.225 | 0.238 | 1.000 |
| p-value | Dimension | CT pre average | CT post average | Net enhancement | CT post max | SUVmax |
| Dimension | 1.000 | 0.968 | 0.471 | 0.451 | 0.615 | 0.048 |
| CT pre average | 0.968 | 1.000 | 0.018 | 0.461 | 0.577 | 0.219 |
| CT post average | 0.471 | 0.018 | 1.000 | 0.000 | 0.000 | 0.522 |
| Net enhancement | 0.451 | 0.461 | 0.000 | 1.000 | 0.000 | 0.175 |
| CT post max | 0.615 | 0.577 | 0.000 | 0.000 | 1.000 | 0.151 |
| SUVmax | 0.048 | 0.219 | 0.522 | 0.175 | 0.151 | 1.000 |
Figure 3.

Correlation between SUVmax and size of the various types of lung lesions.
Figure 4.

Correlation between SUVmax and size in lesions larger than 31 mm.
Figure 5.

Correlation between SUVmax and tumour size in the group of adenocarcinomas.
Discussion
This study was designed to evaluate whether SUVmax and net enhancement can be correlated with NSCLC in terms of size and histotype in order to assess how these parameters change with tumour size and cytology. We evaluated tumour mass dimension, CTpre-average, CTpost-average, CTpost-max, net enhancement, SUVmax, age, and cytological data of 38 patients. Recent studies have focused on the relationship between the SUV and biological and molecular factors that influence cancer progression or glucose metabolism [11,12]. Malignant cells exhibit increased glucose metabolism and uncontrolled growth: elevated glucose metabolism and high levels of angiogenesis are both associated with increased metastatic potential and poor patient survival [13]. However, as the tumour increases in size, the cells outgrow their blood supply. The subsequent reduction in the delivery of oxygen renders the tumour hypoxic. Tumours can adapt to hypoxia by increasing the expression of glucose transporters and by utilizing anaerobic glycolysis – a process mediated by hypoxia-inducible factors [14,15]. This mechanism could determine a higher SUVmax in larger malignant lesions.
The relationship between SUV and malignant tumour size has yet to be established. Some authors have identified a correlation between size and SUV [16–18], whereas others did not [19,20]. We found a significant correlation between SUVmax and size (r=0.32; p=0.048): this correlation was stronger for lesions larger than 31 mm (r=0.4515; p=0.0268). We also found a correlation between SUVmax and size (r=0.562; p=0.019) in adenocarcinomas. The differences between our results and those of others are probably due to our entry criteria. In fact, we evaluated patients with lesions measuring between 3 and 7 cm and with FDG PET-negative metastasis.
With respect to the correlation between SUVmax and histological type, adenocarcinomas had a slightly lower SUVmax than the other histotypes, but the difference was not significant. The lower SUVmax of adenocarcinomas is consistent with the results of other studies [1,2]. Tumour subtype is known to reflect the differential avidity of 18FDG uptake by cancer cells [21]. Glucose transporters mediate FDG uptake, and the expression of these proteins has been found to correlate with FDG uptake [22]. Moreover, the expression of glucose transporter type 1 (Glut-1) differed substantially between NSCLC of different histologies [23]. Adenocarcinomas were reported to express low levels of Glut-1 [24]. These tumours have a lower 18FDG uptake and a lower SUVmax than squamous cell tumours [21]. However, although Glut-1 is the major glucose transporter expressed in NSCLC, it is neither the sole nor the rate-limiting determinant of FDG uptake [25]. FDG uptake is known to be related to hexokinase and glucose-6-phosphatase activities in cancer [24,25]. Moreover, at the whole tumour level, FDG depends on such factors as tumour blood flow, intratumoral microvessel density and viable tumour cell number [2]. Uptake of FDG in the primary site of NSCLC has been correlated with tumour doubling time and proliferation rates [2,18]. In fact, the doubling time of squamous cell carcinoma is 92 days versus 168 in the case of adenocarcinoma [18]. Consequently, there is a link between tumour growth rate and glucose metabolism. This would explain why FDG uptake varies depending on lesion size and histotype, and it would also explain why the correlation between SUVmax and size is stronger for adenocarcinomas than for other histotypes.
We found no correlation between net enhancement and histotype in our 38 patients. According to some studies, the malignant form of pulmonary lesions tends to expand substantially more than the benign form [26,27], and perfusion increases proportionally with size [28,29]. However, our technique of CT examination, performed to stage the lung masses, does not allow a specific evaluation of net enhancement. In fact, lung masses are usually evaluated with a perfusion or dynamic protocol, which could allow the clinician to correlate net enhancement and histotype [29–31]. However, our subcategories may have been too small to infer any conclusion about this type of parameter.
The results we obtained partially reflect the composition of our group of patients, in which there were fewer women (8/38) and the prevalence of adenocarcinoma was higher than in other studies [17,18]. Another problem is the relatively small number of lesions in each group when patients are divided according to histology, particularly in the case of tumours that have a low incidence.
Conclusions
This study shows that tumour size and histological subtype influenced FDG uptake in NSCLC. We found a significant correlation between tumour size and SUV (r=0.32; p=0.048) in patients with lesions measuring between 3 and 7 cm, while we did not find any correlation among lesion size and pre-contrastographic density, net enhancement, average post-contrast density and maximum density. We also demonstrate a significant correlation between clinical stage and SUVmax for adenocarcinomas, but not for squamous cell carcinomas. Our findings should be verified in a larger population, more representative of all histological types and their variants, and taking their different growth patterns and tissue architecture into account.
Acknowledgement
We are grateful to Jean Ann Gilder (Scientific Communication srl) for revising and editing the text.
Footnotes
Source of support: Departmental sources
References:
- 1.Youlden DR, Cramb SM, Baade PD. The International Epidemiology of Lung Cancer: geographical distribution and secular trends. J Thorac Oncol. 2008;3:819–31. doi: 10.1097/JTO.0b013e31818020eb. [DOI] [PubMed] [Google Scholar]
- 2.de Geus-Oei LF, van Krieken JH, Aliredjo RP, et al. Biological correlates of FDG uptake in non-small cell lung cancer. Lung Cancer. 2007;55:79–87. doi: 10.1016/j.lungcan.2006.08.018. [DOI] [PubMed] [Google Scholar]
- 3.Takenaka T, Yano T, Ito K, et al. Biological significance of the maximum standardized uptake values on positron emission tomography in non-small cell lung cancer. J Surg Oncol. 2009;100:688–92. doi: 10.1002/jso.21386. [DOI] [PubMed] [Google Scholar]
- 4.Duczkowski M, Duczkowska A, Bekiesinska-Figatowska M, et al. The imaging features of selected congenital tumors – own material and literature review. Med Sci Monit. 2010;16(Suppl 1):52–59. [Google Scholar]
- 5.Sharma M, Aronow W, O’Brien M, et al. T cell lymphoma presenting as esophageal obstruction and bronchoesophageal fistula. Med Sci Monit. 2011;17(6):CS66–69. doi: 10.12659/MSM.881797. [DOI] [PMC free article] [PubMed] [Google Scholar]
- 6.Shin V, Bhargava P, Brown J, et al. Multimodality imaging features in a case of bronchial carcinoid including. FDG PET Med Sci Monit. 2007;13(1):CS4–8. [PubMed] [Google Scholar]
- 7.Arslan S, Yilmaz A, Bayramgürler B, et al. CT- Guided Transthoracic fine needle aspiration of pulmonary lesions: accuracy and complications in 294 patients. Med Sci Monit. 2002;8:CR493–97. [PubMed] [Google Scholar]
- 8.Hasanovic A, Rekhtman N, Sigel CS, Moreira AL. Advances in fine needle aspiration cytology for the diagnosis of pulmonary carcinoma. Patholog Res Int. 2011;2011:897292. doi: 10.4061/2011/897292. [DOI] [PMC free article] [PubMed] [Google Scholar]
- 9.Alberg AJ, Ford JG, Samet JM. Epidemiology of Lung Cancer. Chest. 2007;132:29S–55S. doi: 10.1378/chest.07-1347. [DOI] [PubMed] [Google Scholar]
- 10.Jemal A, Siegel R, Xu J, Ward E. Cancer statistics, 2010. CA Cancer J Clin. 2010;60:277–300. doi: 10.3322/caac.20073. [published erratum appears in CA. Cancer J Clin, 2011;61: 133–34] [DOI] [PubMed] [Google Scholar]
- 11.de Geus-Oei LF, van Krieken JH, Aliredjo RP, et al. Biological correlates of FDG uptake in non-small cell lung cancer. Lung Cancer. 2007;55:79–87. doi: 10.1016/j.lungcan.2006.08.018. [DOI] [PubMed] [Google Scholar]
- 12.Vesselle H, Salskov A, Turcotte E, et al. Relationship between non-small cell lung cancer FDG uptake at PET, tumor histology, and Ki-67 proliferation index. J Thorac Oncol. 2008;3:971–78. doi: 10.1097/JTO.0b013e31818307a7. [DOI] [PubMed] [Google Scholar]
- 13.Ahuja V, Coleman RE, Herndon J, Patz EF., Jr The prognostic significance of fluorodeoxyglucose positron emission tomography imaging for patients with nonsmall cell lung carcinoma. Cancer. 1998;83:918–24. [PubMed] [Google Scholar]
- 14.Semenza GL. HIF-1 and tumor progression: pathophysiology and therapeutics. Trends Mol Med. 2002;8(4 Suppl):S62–67. doi: 10.1016/s1471-4914(02)02317-1. [DOI] [PubMed] [Google Scholar]
- 15.Miles KA, Griffiths MR, Keith CJ. Blood flow-metabolic relationships are dependent on tumour size in non-small cell lung cancer: a study using quantitative contrast-enhanced computer tomography and positron emission tomography. Eur J Nucl Med Mol Imaging. 2006;33:22–28. doi: 10.1007/s00259-005-1932-7. [DOI] [PubMed] [Google Scholar]
- 16.Brown RS, Leung JY, Kison PV, et al. Glucose transporters and FGD uptake in untreated primary human non small cell lung cancer. J Nuclear Med. 1999;40:556–65. [PubMed] [Google Scholar]
- 17.Khalaf M, Abdel-Nabi H, Baker J, et al. Relation between nodule size and 18F-FDG-PET SUV for malignant and benign pulmonary nodules. J Hematol Oncol. 2008;1:13. doi: 10.1186/1756-8722-1-13. [DOI] [PMC free article] [PubMed] [Google Scholar]
- 18.Li M, Sun Y, Liu Y, et al. Relationship between primary lesion FDG uptake and clinical stage at PET–CT for non-small cell lung cancer patients: An observation. Lung Cancer. 2010;68:394–97. doi: 10.1016/j.lungcan.2009.07.009. [DOI] [PubMed] [Google Scholar]
- 19.Duhaylongsod FG, Lowe VJ, Patz EF, et al. Lung tumour growth correlate with glucose metabolism measured by fluoride-18 fluorodeoxiglucose positron emission tomography. Ann Thorac Surg. 1995;60:1348–52. doi: 10.1016/0003-4975(95)00754-9. [DOI] [PubMed] [Google Scholar]
- 20.Veronesi G, Landoni C, Pelosi G, et al. Pastorino U. Fluoro-deoxy-glucose uptake and angiogenesis are independent biological features in lung metastases. Br J Cancer. 2002;86:1391–95. doi: 10.1038/sj.bjc.6600262. [DOI] [PMC free article] [PubMed] [Google Scholar]
- 21.Al-Sarraf N, Gately K, Lucey J, et al. Clinical implication and prognostic significance of standardized uptake value of primary non-small cell lung cancer on positron emission tomography: analysis of 176 cases. Eur J Cardiothorac Surg. 2008;34:892–97. doi: 10.1016/j.ejcts.2008.07.023. [DOI] [PubMed] [Google Scholar]
- 22.van Baardwijk A, Dooms C, van Suylen RJ, et al. The maximum uptake of (18)F-deoxyglucose on positron emission tomography scan correlates with survival, hypoxia inducible factor-1alpha and GLUT-1 in non-small cell lung cancer. Eur J Cancer. 2007;43:1392–98. doi: 10.1016/j.ejca.2007.03.027. [DOI] [PubMed] [Google Scholar]
- 23.Brown RS, Leung JY, Kison PV, et al. Glucose transporters and FDG uptake in untreated primary human non-small cell lung cancer. J Nucl Med. 1999;40:556–65. [PubMed] [Google Scholar]
- 24.Mamede M, Higashi T, Kitaichi M, et al. [18F]FDG uptake and PCNA, Glut-1, and Hexokinase-II expressions in cancers and inflammatory lesions of the lung. Neoplasia. 2005;7:369–79. doi: 10.1593/neo.04577. [DOI] [PMC free article] [PubMed] [Google Scholar]
- 25.Nguyen XC, Lee WW, Chung JH, et al. FDG uptake, glucose transporter type 1, and Ki-67 expressions in nonsmall-cell lung cancer: correlations and prognostic values. Eur J Radiol. 2007;62:214–19. doi: 10.1016/j.ejrad.2006.12.008. [DOI] [PubMed] [Google Scholar]
- 26.Swensen SJ, Brown LR, Colby TV, Weaver AL. Pulmonary nodules: CT evaluation of enhancement with iodated contrast material. Radiology. 1995;194:393–98. doi: 10.1148/radiology.194.2.7824716. [DOI] [PubMed] [Google Scholar]
- 27.Littleton JT, Durizch ML, et al. Pulmonary masses: contrast enhancement. Radiology. 1990;177:861–71. doi: 10.1148/radiology.177.3.2244002. [DOI] [PubMed] [Google Scholar]
- 28.Li Y, Yang ZG, Chen TW, et al. Whole tumour perfusion of peripheral lung carcinoma: evaluation with first-pass CT perfusion imaging at 64-detector row CT. Clin Radiol. 2008;63:629–53. doi: 10.1016/j.crad.2007.12.012. [DOI] [PubMed] [Google Scholar]
- 29.Yi CA, Lee KS, Kim EA, et al. Solitary pulmonary nodules: dynamic enhanced multi–detector row CT study and comparison with vascular endothelial growth factor and microvessel density. Radiology. 233:191–99. doi: 10.1148/radiol.2331031535. [DOI] [PubMed] [Google Scholar]
- 30.Miles KA. Perfusion CT for the assessment of tumour vascularity: which protocol? Br J Radiol. 2003;76(Spec. 1):S36–42. doi: 10.1259/bjr/18486642. [DOI] [PubMed] [Google Scholar]
- 31.Cappabianca S, Porto A, Petrillo M, et al. Preliminary study on the correlation between grading and histology of solitary pulmonary nodules and contrast enhancement and [18F] fluorodeoxyglucose standardised uptake value after evaluation by dynamic multiphase CT and PET/CT. J Clin Pathol. 2011;64(2):114–19. doi: 10.1136/jcp.2010.076562. [DOI] [PMC free article] [PubMed] [Google Scholar]