Abstract
Human embryonic stem cells (hESCs) hold potential in the field of tissue engineering given their capacity for both limitless self-renewal and differentiation to any adult cell type. However, several limitations, including the ability to expand undifferentiated cells and efficiently direct differentiation at scales needed for commercial cell production, prevent realizing the potential of hESCs in tissue engineering. Numerous studies have illustrated that 3-D culture systems provide microenvironmental cues that affect hESC pluripotency and differentiation fates, but little is known about how 3-D culture affects cell expansion. Here we have used a 3-D microwell array to model the differences in hESC growth kinetics and metabolism in 2-D vs. 3-D cultures. Our results demonstrated that 3-D microwell culture reduced hESC size and proliferative capacity, and impacted cell cycle dynamics, lengthening the G1 phase and shortening the G2/M phase of the cell cycle. However, glucose and lactate metabolism were similar in 2-D and 3-D cultures. Elucidating the effects of 3-D culture on growth and metabolism of hESCs may facilitate efforts for developing integrated, scalable cell expansion and differentiation processes with these cells.
1. Introduction
Human embryonic stem cells (hESCs) are a promising source of cells for many cell-based therapeutic or tissue engineering applications given their ability to undergo large-scale expansion in the undifferentiated state as well as differentiation into any somatic cell type [1, 2]. In order to address the challenge of developing systems to better control hESC behavior, various 3-D culture systems have been utilized to enhance growth or differentiation of these cells by better mimicking the 3-D nature of in vivo tissue development than standard 2-D systems. For example, long-term maintenance of pluripotency has been achieved in porous scaffolds consisting of alginate and chitosan [3], while encapsulation of hESCs in calcium alginate microcapsules has been shown to promote both pluripotency and differentiation to definitive endoderm [4]. Additionally, a porous alginate scaffold enhanced proliferation, differentiation, and vasculogenesis during embryoid body (EB) formation from hESCs [5]. Another encapsulation strategy utilizing hyaluronic acid hydrogels was also able to maintain pluripotency as well as differentiation capacity [6], and encapsulation of hESCs in poly-L-lysine-layered liquid core alginate beads promoted cardiogenesis [7]. Finally, osteogenic differentiation of hESCs has been promoted with 3-D nanofibrous scaffolds comprised of poly(l-lactic acid) [8], while hepatic differentiation and functionality has been enhanced using hollow fiber perfusion bioreactors [9] as well as collagen scaffolds [10].
While these 3-D systems are excellent platforms for identifying factors that regulate hESC fates, cell-based therapies or tissue engineering applications will require moving these processes to much larger scales. For example, transplantation of β-islet cells for treatment of diabetes will require on the order of 108 functional cells per transplant, and patients will likely require multiple transplants [11]. Growth and metabolism of mouse and human ESCs have been studied in various traditional bioreactor systems [12–15], but a thorough understanding of the growth kinetics and metabolism of hESCs in these 3-D systems is necessary in order to appropriately design such scalable processes. We have previously developed a 3-D microwell confinement culture system that can promote long-term hESC self-renewal [16] or subsequent EB-mediated differentiation to cardiomyocytes [17]. The cuboidal microwells, with lateral dimensions of 50–500 μm/side and depths of 50–120 μm, are patterned in polyurethane, and cell attachment outside of the wells is prevented by formation of a protein-resistant self-assembled monolayer onto a thin layer of gold in areas between the wells. In this study we have used this microwell system as a platform to model differences in growth and metabolism in hESCs cultured in 2-D vs. 3-D systems. We found significant differences in cell size, proliferative capacity, and cell cycle dynamics in the 3-D microwells as compared to the 2-D substrates. These results provide potential targets for studying pathways that promote self-renewal or prime hESCs for differentiation, and will have implications on developing scalable 3-D hESC expansion and differentiation processes.
2. Materials and Methods
2.1 Microwell fabrication
Microwells were prepared as previously described [16]. Briefly, soft lithography was used to pattern the wells in polyurethane using PDMS stamps. E-beam evaporation was then used to coat the areas outside of the wells with a thin layer of gold. Finally, a tri(ethylene glycol)-terminated alkanethiol self-assembled monolayer (EG3) was assembled on the gold surface.
2.2 hESC culture
H9 hESCs (passages 25–50) were cultured on tissue culture polystyrene (TCPS) 6-well plates or in microwells. Both substrates were coated with growth factor reduced Matrigel (BD Bioscience, Medford, MA) for 1 hour at 37°C. Unconditioned medium (UM/F-) composed of DMEM/F12 (Invitrogen) containing 20% Knockout Serum Replacer (Invitrogen), 1x MEM nonessential amino acids (Invitrogen), 1 mL L-glutamine (Sigma), and 0.1 mM β-mercaptoethanol (Sigma) was conditioned on irradiated mouse embryonic fibroblasts for 24 hours and supplemented with 4 ng/mL bFGF, resulting in the culture medium CM/F+. Microwells were seeded with cells as previously described [16].
2.3 Growth kinetics
Beginning 14 hours after cells were seeded in microwells or on matrigel-coated TCPS plates, triplicate samples were singularized using 0.25% trypsin-EDTA (Invitrogen) every 24 hours for 6 days. Cells were counted using a hemocytometer.
2.4 BrdU Incorporation Assay and Oct4 Analysis
Cells in microwells or on Matrigel-coated TCPS plates were pulsed with CM/F+ containing 20 μM bromodeoxuridine (BrdU, Invitrogen) for 20 min at 37°C. Following the pulse, cells were singularized with 0.25% trypsin-EDTA and fixed and permeabilized in ice-cold 90% methanol for 30 min. Cells were treated with PBS containing 2N HCl (Sigma) and 1% Triton X-100 (Sigma) for 20 min at room temperature to denature DNA. After removal of the acid solution, samples were neutralized with 0.1M sodium tetraborate and rinsed twice with FACS buffer (PBS with 2% FBS and 0.1% Triton X-100). Mouse anti-bromodeoxiuridine (Invitrogen, 1:100) and rabbit anti-Oct4 (Santa Cruz 1:100) primary antibodies were incubated overnight in FACS buffer. Following 2 washes, cells were incubated with goat anti-mouse Alexa Fluor 633 and goat anti-rabbit Alexa Fluor 488 for 30 min at room temperature. After 2 washes, samples were analyzed on a FACSCaliber flow cytometer (Becton Dickinson Immunocytometry Systems, BDIS) using CellQuest software.
2.5 Immunocytochemistry and Imaging
hESCs cultured in microwells or on Matrigel-coated glass coverslips were fixed in 4% paraformaldehyde (EMS) for 20 min at room temperature. Samples were blocked and permeabilized for 1 hour in blocking buffer, PBS (Invitrogen) containing 5% chick serum (Invitrogen) and 0.2% Triton X-100 (Sigma). Goat anti-E-cadherin (1:100, R&D Systems) primary antibody was incubated overnight at 4°C in blocking buffer, and after subsequent washes in PBS cells were incubated in blocking buffer containing donkey anti-goat Alexa Fluor 555 (1:500, Invitrogen) for 1 hour at room temperature. Following PBS washes, samples were mounted on coverslips using ProLong Gold anti-fade reagent (Invitrogen) and imaged using a Bio-Rad Radiance 2100 Multiphoton Rainbow microscope (Bio-Rad).
2.6 Cell Size Measurement
Cells growing in microwells or on Matrigel-coated TCPS plates were singularized using 0.25% trypsin-EDTA and treated with a 1:1 ratio of trypan blue (Invitrogen). Average cell diameter of live cells was then measured using a Countess automated cell counter (Invitrogen). Triplicate samples were analyzed for each condition.
2.7 Cell synchronization and propidium iodide assay
Cells cultured in microwells or on Matrigel-coated 6-well TCPS plates were synchronized by treatment with 200 ng/mL nocodozole (Sigma) in CM/F+ for 18 hours at 37°C. Following removal of nocodozole, cells were rinsed twice with PBS and once with CM/F+ before fresh CM/F+ was added and cells were returned to 37°C. At 0, 2, 4, 6, 8, 11, 14, 19, and 24 hours following removal of nocodozole, triplicate samples were harvested using 0.25% trypsin-EDTA and fixed/permeabilized in 90% methanol. Cells were incubated overnight in FACS buffer containing 1 mg/mL propidium iodide (PI, Invitrogen) at 4°C. Samples were analyzed on a FACSCaliber flow cytometer (Becton Dickinson Immunocytometry Systems, BDIS), and cell cycle distribution was determined using ModFit LT software (Verity Software House, Inc.). PI analysis was also performed on asynchronous cells that were harvested from microwells or matrigel-coated TCPS plates every 24 hours for a 6 day culture period.
2.8 Glucose and Lactate Metabolism
Spent medium was collected from cells growing in microwells or on Matrigel-coated 6-well TCPS plates every 24 hours for 6 days. Fresh medium samples were also collected at each timepoint to determine the baseline glucose and lactate levels. Samples were centrifuged for 5 min at 1000 RPM to remove debris and stored at −80°C prior to analysis. Glucose and lactate concentrations were measured using a YSI 2700 SELECT Biochemistry Analyzer (YSI Life Sciences). The specific rate of glucose consumption (qGlucose) and lactate production (qLactose) per cell were calculated using the following equation:
| (1) |
Where qi is the specific molar consumption or production rate of metabolite i, ni is the number of moles of metabolite i, X is cell number, and t is time.
2.9 Statistics
Data are presented as mean ± standard deviation (SD) of three biological replicates from one of three representative experiments. P-values were determined using an unpaired Student’s t-test.
3. Results
3.1 Effect of 3-D microwell culture on hESC growth kinetics and proliferative capacity
hESCs were cultured for 6 days in 2-D on Matrigel-coated 6-well tissue culture polystyrene (TCPS) plates or in 3-D in arrays containing square microwells of three lateral sizes, 100, 300, and 500 μm, and a microwell depth of 120 μm. These three microwell arrays contained 5000, 600 and 225 wells for a total volume of 6, 6.5 and 6.75 mm3, respectively (Table 1). Every 24 hours, cells were harvested for cell counts and bromodeoxiuridine (BrdU) uptake assays to quantify proliferative capacity. After seeding we observed that the cells expanded to fill the wells by day 2–3 in the 100 μm/side microwells and day 3–4 in the larger microwells, though they remained proliferative beyond this point. Figure 1 shows total cell number at each time point normalized to the initial cell number. Cell growth profiles were similar for the first two days of culture, but at later timepoints all microwell sizes exhibited less cell growth than the 2-D control, with the smallest microwell size, 100 μm/side, showing the greatest reduction in expansion. While the 2-D controls achieved a 14.4-fold increase in cell number by day 6, the fold changes in 100, 300, and 500 μm/side microwells were 3.8, 8.3, and 7.9-fold, respectively.
Table 1.
Microwell Properties
| Microwell Size | Number of Wells | Total Volume (mm^3) |
|---|---|---|
| 100×100×120 | 5000 | 6.00 |
| 300×300×120 | 600 | 6.50 |
| 500×500×120 | 225 | 6.75 |
Figure 1. 3-D confinement affects growth kinetics of hESCs.
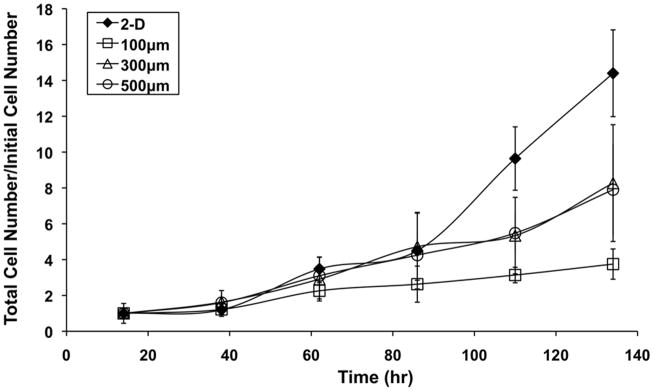
hESCs were cultured in 3-D in 120 μm deep microwells or on 2-D substrates for 6 days. Starting at 14 hours, cells were harvested and counted every 24 hours. Total cell number was normalized to initial cell number and plotted at each timepoint. hESCs cultured in larger microwells (300 and 500 μm/side) exhibited a reduction in cell growth after 82 hours in culture, while this effect occurred earlier in the smallest microwell size (100 μm/side).
To further evaluate proliferative capacity in 2-D and in 3-D microwell cultures, cells were pulsed with the thymidine analog BrdU for 20 minutes prior to harvest, and flow cytometry was used to determine the fraction of cells that had incorporated BrdU into their DNA in that time period. This assay quantifies the fraction of cells in the S-phase of the cell cycle during the BrdU pulse. As shown in Figure 2, all microwell sizes contained a lower percentage of BrdU-positive cells than the 2-D control at each timepoint. To ensure that these differences in proliferation were not the result of differences in pluripotency, the BrdU flow samples were also labeled with an antibody against Oct4. All samples contained >97% Oct4-positive cells at each time point in the culture (data not shown), indicating that differences in proliferative capacity did not result from differential Oct4 expression.
Figure 2. hESCs cultured in microwells exhibit reduced proliferative capacity.
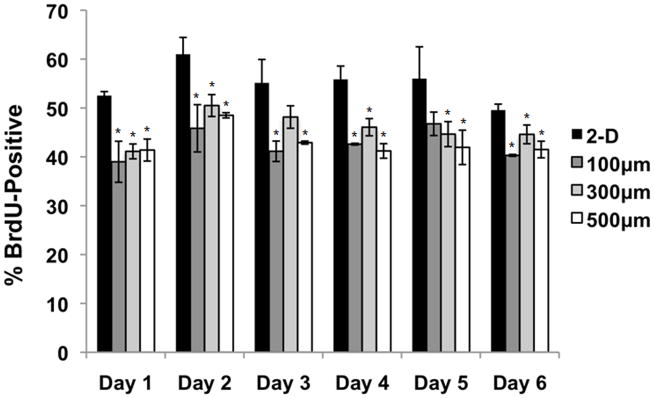
Every 24 hours, cells on 2-D controls (Matrigel-coated TCPS) and in 100, 300, and 500 μm/side microwells were pulsed with bromodeoxiuridine (BrdU) for 20 minutes. After BrdU treatment, the cells were harvested and the percentage of BrdU-positive cells was determined using flow cytometry. Microwell-cultured cells contained a lower percentage of BrdU-positive cells than 2-D controls, indicating a reduction in proliferative capacity (* indicates P<0.05 compared to same-day 2-D control).
3.2 Confinement of hESCs in 3-D microwells results in reduction of cell size
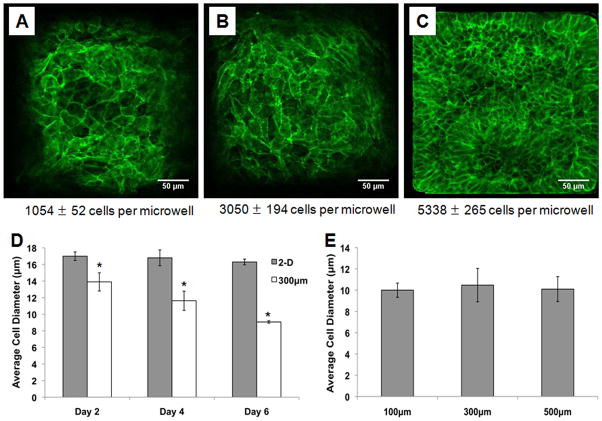
In addition to assessing growth kinetics, we evaluated cell size in the 2-D controls (Matrigel-coated TCPS) and 3-D microwells. Immunolabeling of hESCs grown in 300 μm/side microwells with an antibody against membrane protein E-cadherin showed qualitatively that cell size in microwells decreased with increasing culture time and microwell occupancy, as the number of cells per microwell increased (Figure 3A–C). To quantify differences in cell size, cells were harvested from 2-D controls and 300 μm/side microwells at days 2, 4, and 6, and average cell diameter was measured. Figure 3D shows that after just 2 days in culture, cells grown in microwells already possessed a significantly smaller diameter than cells on 2-D substrates, 13.9 ± 1.0 μm compared to 17.0 ± 0.5 μm. While the average cell diameter on 2-D substrates remained relatively constant over the 6 day culture period, the average cell diameter in microwells continued to decrease, reaching 9.1 ± 0.15 μm at day 6. This decrease in cell size in 3-D microwells as culture time increases explains how cells in microwells can remain proliferative beyond the point at which they initially appear filled. At day 6, average cell diameter in 100, 300, and 500 μm/side microwells was compared to see if microwell volume affected cell size, but statistically significant differences were not observed (Figure 3E).
Figure 3. Confinement of hESCs in 3-D microwells leads to a reduction in cell size.
Cells in 300 μm/side microwells were fixed and immunolabeled with an antibody against membrane protein E-cadherin on day 2 (A), day 4 (B) and day 6 (C) of culture. The images show qualitatively that cell size decreased with increasing culture time as the microwells filled. At the same timepoints, cell diameter was measured in cells harvested from Matrigel-coated TCPS 2-D controls and 300 μm/side microwells (D). While cell diameter remained unchanged in the 2-D controls, hESCs cultured in microwells were smaller than those in 2-D controls by day 2, and cell diameter continued to decrease over time. Cell diameter was also compared in three microwell sizes (100, 300, and 500 μm/side) and there were no statistically significant differences in cell diameter between microwell sizes (E) (* indicates P<0.05 compared to same-day 2-D control).
3.3 Evaluation of cell cycle dynamics
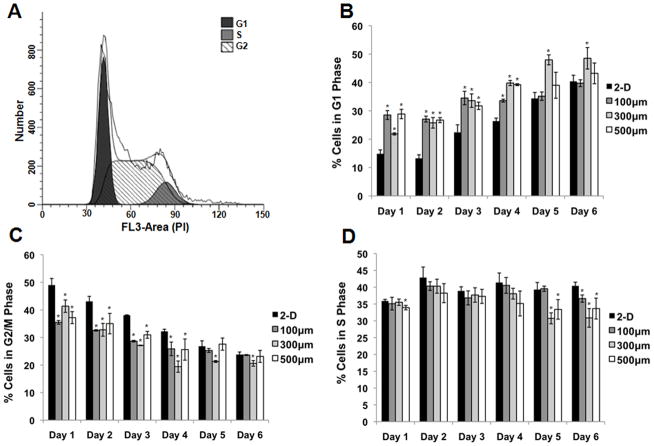
Given the differences we observed in growth kinetics and cell size in 2-D vs. 3-D systems, we further evaluated cell cycle dynamics in these systems. First, we quantified the distribution of cells in each phase of the cell cycle as a function of culture time in asynchronous cell populations. Cells were cultured in 2-D (Matrigel-coated TCPS) or 3-D microwells (100, 300 and 500 μm/side) for 6 days, and every 24 hours cells were harvested, fixed, and incubated with propidium iodide (PI). Flow cytometry was then performed, and ModFit LT software was used to determine the percentage of cells in G1, S, and G2/M phases of the cell cycle (Figure 4). Both 2-D and 3-D cultures exhibited similar temporal dynamics in cell cycle distribution. The fraction of cells in G1 increased with time in culture and cell density (Figure 4B), and correspondingly the fraction of cells in G2/M decreased (Figure 4C). While cells in all microwell sizes contained higher percentages of cells in G1 and lower percentages of cells in G2/M than cells in 2-D controls at early culture times, these differences were not significant in most microwell sizes by day 5 and 6. The fraction of cells in S phase determined by PI analysis (Figure 4D) confirmed the results obtained in the BrdU incorporation assay (Figure 2), with cells cultured in microwells containing a lower percentage of cells in S phase compared to 2-D controls.
Figure 4. Cell cycle distribution varies with culture time.
hESCs were cultured on 2-D controls (Matrigel-coated TCPS) and in 100, 300, or 500 μm/side microwells for 6 days. Every 24 hours cells were harvested, fixed, and staining with propidium iodide (PI). Flow cytometry was used to evaluate PI intensity, and the data was entered into ModFit software to analyze the fraction of cells in each phase of the cell cycle. A sample histogram of fitted data is shown in panel (A). The percentage of cells in the G1 (B), G2/M (C), and S (D) phases of the cell cycle was plotted at each timepoint. As culture time increased, the relative percentage of cells in G1 increased while the relative percentage of cells in G2/M decreased. Differences in G1 and G2/M percentages between cells in 2-D and microwells were more pronounced at earlier culture times (* indicates P<0.05 compared to same-day 2-D control).
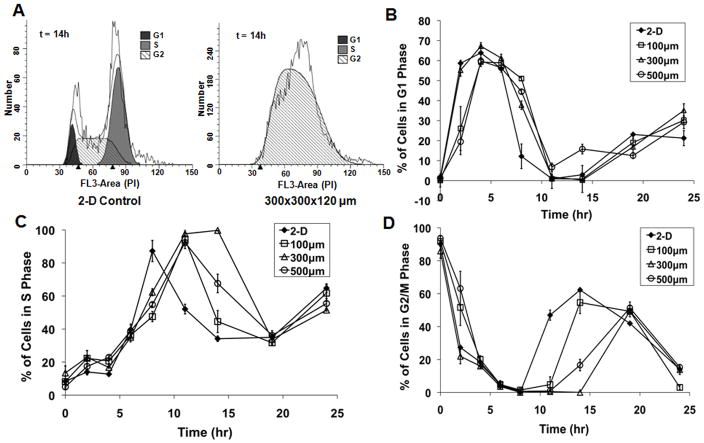
In order to evaluate whether there were differences in the length of each stage of the cell cycle in 2-D vs. 3-D, we arrested the cells at the G2/M transition using nocodozole and used PI assays to analyze the movement of the synchronized cells through the cell cycle during the 24 hour period following removal of nocodozole. As shown in Figure 5, hESCs in microwells of all sizes spent more time in G1 and less time in G2 than hESCs cultured in 2-D on matrigel-coated TCPS. The lag in cell division represented by the longer G2/M phase in 2-D cultures could explain why cells in microwells exhibit similar growth kinetics to cells growing on 2-D controls at early culture times (Figure 1) despite the lower percentage of BrdU-positive cells in microwells (Figure 2). Taken together, these results demonstrate that while general trends in the dynamics are similar, there are differences in lengths of specific phases of the cell cycle in 2-D and 3-D.
Figure 5. Cells cultured in microwells exhibit lengthened G1 and shortened G2/M phases of the cell cycle.
Cells cultured on 2-D Matrigel-coated TCPS controls and in 100, 300, and 500 μm/side microwells were synchronized with nocodozole. Following removal of the nocodozole, PI labeling and ModFit analysis were used to determine the distribution of cells in each phase of the cell cycle. Sample histograms from the 2-D and 300 μm/side microwell conditions at 14 hours following removal of nocodozole showed qualitative differences in cell cycle distribution (A). Percent of cells in G1 (B), S (C) and G2/M (D) were plotted at various timepoints over 24 hours. Cells in microwells spent longer in G1 than 2-D controls, but they also remained in G2/M for less time, so by 24 hours the cell cycle distribution was similar in all populations.
3.4 Analysis of glucose and lactate metabolism
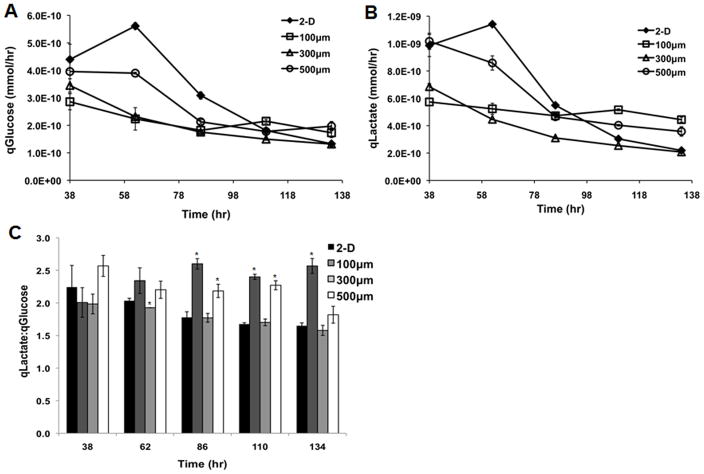
To determine whether changes in cell proliferation and cell cycle dynamics in 2-D and 3-D cultures were linked to differences in metabolism, we performed metabolite analysis on 2-D and 3-D cultures during cell expansion. Spent medium was removed from the cultures every 24 hours for 6 days, and the concentrations of glucose and lactate were quantified. These measurements were then used to calculate the specific rate of glucose consumed (qGlucose) and lactate produced (qLactate) per cell. Figure 6 shows that 2-D controls and all microwell sizes exhibited the same qualitative trends, with qGlucose and qLactate both decreasing over time. These results are consistent with the observed reduction in cell growth as time in culture increased (Figure 1). The qLactate:qGlucose ratio remained in the range of 1.5 to 2.5 throughout the culture period in all conditions, though the 100 μm/side microwells exhibited the highest qLactate:qGlucose ratio at later timepoints. These results demonstrate that glucose and lactate metabolism follow similar patterns in 2-D and 3-D systems.
Figure 6. Analysis of glucose and lactate metabolism in hESCs cultured in 2-D vs. 3-D.
Cells were cultured on 2-D Matrigel-coated TCPS or in 100, 300, and 500 μm/side microwells for 6 days. Every 24 hours, the culture media was removed and the levels of glucose and lactate were measured. The rate of glucose consumption per cell (A) and the rate of lactate production per cell (B) both decreased with increasing culture time in all systems. The ratio of lactate production to glucose consumption remained in the range of 1.5 to 2.5 throughout the culture, with the 100 μm/side microwells exhibiting the highest qLactate:qGlucose ratios as culture time increased (C) (* indicates P<0.05 compared to same-day 2-D control).
Discussion
In this study, we used a microwell array system to study the differences in hESC growth and metabolism in 2-D and 3-D systems. Many 3-D systems have been reported to enhance hESC expansion and/or differentiation to desired cell types [3–10]. However, significant scale-up of these processes will be necessary for any cell-based therapeutic application of these cells. A better understanding of the effects of 3-D culture on growth kinetics of hESCs is critical for effective design of these large-scale processes. Our results demonstrated that hESCs cultured in 3-D microwells exhibit similar metabolic activity and lower proliferative rates, which will need to be accounted for in 3-D cell culture process design. Given that these experiments were all performed with the H9 hESC line, further validation will be necessary to generalize these findings to additional hESC lines.
The 100 μm/side microwells become full by day 2–3 of culture while the 300 and 500 μm/side microwells become full around day 3–4. As shown in Figure 1, all microwell sizes exhibit similar growth kinetics to the 2-D control during the time period in which the microwells are less dense, indicating that the differences observed in growth kinetics could be due to cell-cell contact limitations once the cells reach a critical density. Despite the similar growth kinetics prior to day 3–4, cells cultured in 2-D have a higher proliferative capacity (Figure 2) as well as higher specific glucose and lactate production rates (Figure 6A,B) at these timepoints. As cell density increases in the 2-D cultures, the specific glucose and lactate metabolism approaches the same values as in the 3-D microwell cultures. Similarly, Figure 4B and C demonstrate that differences in relative distribution of cells in the G1 vs. G2/M phases of the cell cycle in 2-D vs. 3D also decrease as culture time increases. Taken together, these results suggest that the initial differences observed in growth, metabolism and cell cycle distribution may result from varying levels of cell-cell contact in the 2-D cultures as compared to the 3-D system at early timepoints. Previous work using this microwell system has shown that the increase in cell-cell contacts in hESCs cultured in 3-D vs. on 2-D substrates led to higher E-cadherin expression and subsequent downregulation of canonical Wnt/β-catenin signaling in undifferentiated hESCs [18]. It is likely that other juxtacrine pathways such as Notch, TGF-α. EGF, and connexin-mediated gap junction signaling or paracrine pathways such as TGFβ/Activin/Nodal or retinoic acid signaling also play a role in the effects of early differences in the relative amount intercellular interactions on growth and metabolism of hESCs. 3-D culture in this microwell system also affects cell size (Figure 3), and the mTOR pathway is linked to metabolism and regulation of mammalian cell size and cell cycle progression [19, 20]. Recently this pathway has also been implicated in regulating self-renewal and differentiation of hESCs [21], and the effects of 3-D culture on mTOR signaling should be studied further in the future.
Recent studies have demonstrated that 3-D culture systems can promote differentiation and patterning of complex epithelial tissues from ESCs [22, 23]. Embryoid bodies (EBs) generated from hESCs cultured in our microwell system have previously been shown to exhibit enhanced cardiogenesis as compared to EBs generated from cells cultured in 2-D on Matrigel-coated TCPS [17]. Several other studies have also established a link between EB size and differentiation trajectory in mouse and human ESCs [24–26]. However, while there is an optimal microwell size for EB-based cardiogenesis in our system, EBs from all microwell sizes outperform the control EBs, indicating that culturing the undifferentiated hESCs in the microwell environment is somehow priming them for differentiation. Given that cell cycle dynamics and metabolism play a role in determining cell fate, it is possible that the differences between hESCs cultured in 2-D vs. 3-D microwells reported in this study are linked to the differences in cell fate observed upon removing the cells from this environment and initiating differentiation.
hESCs cultured in microwells remain Oct4-positive but decrease dramatically in size by day 6 of culture compared to cells on 2-D substrates (Figure 3). Cell size and cell cycle progression are coordinated; cell size affects the G1/S transition since cells must reach a certain size prior to initiation of DNA replication in mammalian cells [27, 28], while the G2/M transition serves as a cell size checkpoint in yeast [29, 30], though this checkpoint has not been definitively shown to function in mammalian cells [31]. Cell cycle progression has been shown to be regulated by cell size and shape via changes cytoskeletal tension [32]. Thus, smaller cell size may be linked to changes in the length of the G1 and G2 phases of the cell cycle, and our results confirmed that hESCs cultured in microwells exhibit longer G1 and shorter G2 phases than hESCs cultured in 2-D controls. Additionally, cyclin D1 is a key regulator of the G1 to S transition in hESCs [33], and we have previously reported that CCND1 gene expression is downregulated in hESCs grown in this microwell system as compared to Matrigel-coated TCPS controls [18]. It is possible that the reduction in the percentage of cells in S-phase in microwell-cultured hESCs is linked to CCND1 expression, and this connection warrants further study. hESCs have an abbreviated G1 phase compared to somatic cells [34], and differentiation of hESCs has been associated with lengthening of the G1 phase [35, 36]. While the difference in G1 length in 2-D and 3-D microwells is relatively small, it is possible that the slight lengthening in G1 is linked to the increased differentiation capacity of these cells to certain lineages once the factors that promote self-renewal are removed from the culture.
The use of physical confinement to control cell size and shape has previously been shown to affect a variety of cell phenotypes, including proliferation, differentiation, and apoptosis [37–39]. The effect of cell shape of lineage commitment of human mesenchymal stem cells has been linked to modulation of cytoskeletal tension via the RhoA pathway [40]. Another recent study utilized micropatterning techniques to regulate substrate geometry and the resulting forces acting on cells to demonstrate that changes in geometry affect human adult stem cell differentiation through differences in cytoskeletal tension [41]. Given the large reduction in cell size in hESCs grown in 3-D microwells, it is likely that there are differences in cytoskeletal arrangement in hESCs grown in 2-D vs. 3-D microwells. Thus, further studies should be performed to evaluate the biophysical forces acting on hESCs via microwell confinement the resulting effects on cytoskeletal tension and related pathways, such as RhoA signaling.
Numerous cell phenotypes are also affected by metabolism. hESCs mostly utilize glycolysis for energy production, but as the cells differentiate the primary mechanism of metabolism switches from glycolysis to oxidative phosphorylation [42, 43]. During glycolysis, one molecule of glucose is converted to two molecules of lactate. Thus, the ratio of the specific molar production rate of lactate to the specific molar consumption rate of glucose can be used to determine if cells are undergoing glycolysis. Our results showed that hESCs in both 2-D and 3-D had lactate:glucose ratios in the range of 1.5 to 2.5 throughout the 6 day culture period, which is indicative of glycolysis. Interestingly, the highest lactate:glucose ratio was observed in the 100 μm/side microwell size, which has previously been shown to promote long-term self-renewal of hESCs [16]. Given that glycolysis is the dominant metabolic pathway during hESC self-renewal, it is possible that engineering processes to control the lactate:glucose ratio could have an impact on hESC self-renewal.
Conclusion
In this study, we compared hESC growth kinetics and metabolism in standard 2-D cultures and a 3-D microwell culture platform. Our results demonstrated that 3-D confinement of hESCs led to a reduction in cell size and proliferative capacity compared to 2-D culture. Cell cycle dynamics were also affected, with microwell-cultured cells exhibiting longer G1 and shorter G2 phases than cells in 2-D controls. However, glucose consumption and lactate production were similar in the two systems. Many 3-D systems have been developed to guide differentiation of hESCs to therapeutically relevant lineages. Understanding growth and metabolism in 3-D will be informative in designing scalable processes to control hESC fate.
Acknowledgments
This study was supported by NIH/NIBIB R01 EB007534 (SPP), NSF EFRI-0735903 (SPP), the UW-Madison Materials Research Science and Engineering Center (MRSEC), and a NSF graduate research fellowship (SMA). The authors would like to thank the WiCell Research Institute for providing cells and reagents, Kyle R. Ripple and Derek J. Hei at the Waisman Clinical Biomanufacturing Facility for use of the YSI Analyzer, the staff at the University of Wisconsin Comprehensive Cancer Center Flow Cytometry Facility for assistance with flow cytometry and cell sorting, and the W.M. Keck Laboratory for Biological Imaging for support with confocal microscopy.
References
- 1.Odorico JS, Kaufman DS, Thomson JA. Stem Cells. 2001;19:193–204. doi: 10.1634/stemcells.19-3-193. [DOI] [PubMed] [Google Scholar]
- 2.Thomson JA, Itskovitz-Eldor J, Shapiro SS, Waknitz MA, Swiergiel JJ, Marshall VS, Jones JM. Science. 1998;282:1145–1147. doi: 10.1126/science.282.5391.1145. [DOI] [PubMed] [Google Scholar]
- 3.Li Z, Leung M, Hopper R, Ellenbogen R, Zhang M. Biomaterials. 2010;31:404–412. doi: 10.1016/j.biomaterials.2009.09.070. [DOI] [PubMed] [Google Scholar]
- 4.Chayosumrit M, Tuch B, Sidhu K. Biomaterials. 2010;31:505–514. doi: 10.1016/j.biomaterials.2009.09.071. [DOI] [PubMed] [Google Scholar]
- 5.Gerecht S, Burdick JA, Ferreira LS, Townsend SA, Langer R, Vunjak-Novakovic G. Proc Natl Acad Sci U S A. 2007;104:11298–11303. doi: 10.1073/pnas.0703723104. [DOI] [PMC free article] [PubMed] [Google Scholar]
- 6.Gerecht-Nir S, Cohen S, Ziskind A, Itskovitz-Eldor J. Biotechnol Bioeng. 2004;88:313–320. doi: 10.1002/bit.20248. [DOI] [PubMed] [Google Scholar]
- 7.Jing D, Parikh A, Tzanakakis ES. Cell Transplant. 2010;19:1397–1412. doi: 10.3727/096368910X513955. [DOI] [PMC free article] [PubMed] [Google Scholar]
- 8.Smith LA, Liu X, Hu J, Ma PX. Biomaterials. 2010;31:5526–5535. doi: 10.1016/j.biomaterials.2010.03.065. [DOI] [PMC free article] [PubMed] [Google Scholar]
- 9.Miki T, Ring A, Gerlach J. Tissue Eng Part C Methods. 2011;17:557–568. doi: 10.1089/ten.TEC.2010.0437. [DOI] [PubMed] [Google Scholar]
- 10.Baharvand H, Hashemi SM, Kazemi Ashtiani S, Farrokhi A. Int J Dev Biol. 2006;50:645–652. doi: 10.1387/ijdb.052072hb. [DOI] [PubMed] [Google Scholar]
- 11.Shapiro AM, Lakey JR, Ryan EA, Korbutt GS, Toth E, Warnock GL, Kneteman NM, Rajotte RV. N Engl J Med. 2000;343:230–238. doi: 10.1056/NEJM200007273430401. [DOI] [PubMed] [Google Scholar]
- 12.Chaudhry MA, Bowen BD, Piret JM. Biochemical Engineering Journal. 2009;45:126–135. [Google Scholar]
- 13.Chen X, Chen A, Woo TL, Choo AB, Reuveny S, Oh SK. Stem Cells Dev. 2010;19:1781–1792. doi: 10.1089/scd.2010.0077. [DOI] [PubMed] [Google Scholar]
- 14.Fernandes TG, Fernandes-Platzgummer AM, da Silva CL, Diogo MM, Cabral JM. Biotechnol Lett. 2010;32:171–179. doi: 10.1007/s10529-009-0108-0. [DOI] [PubMed] [Google Scholar]
- 15.Lock LT, Tzanakakis ES. Tissue Eng Part A. 2009;15:2051–2063. doi: 10.1089/ten.tea.2008.0455. [DOI] [PMC free article] [PubMed] [Google Scholar]
- 16.Mohr JC, de Pablo JJ, Palecek SP. Biomaterials. 2006;27:6032–6042. doi: 10.1016/j.biomaterials.2006.07.012. [DOI] [PubMed] [Google Scholar]
- 17.Mohr JC, Zhang J, Azarin SM, Soerens AG, de Pablo JJ, Thomson JA, Lyons GE, Palecek SP, Kamp TJ. Biomaterials. 2010;31:1885–1893. doi: 10.1016/j.biomaterials.2009.11.033. [DOI] [PMC free article] [PubMed] [Google Scholar]
- 18.Azarin SM, Lian X, Larson EA, Popelka HM, de Pablo JJ, Palecek SP. Biomaterials. 2011 doi: 10.1016/j.biomaterials.2011.11.070. [DOI] [PMC free article] [PubMed] [Google Scholar]
- 19.Fingar DC, Salama S, Tsou C, Harlow E, Blenis J. Genes Dev. 2002;16:1472–1487. doi: 10.1101/gad.995802. [DOI] [PMC free article] [PubMed] [Google Scholar]
- 20.Rosner M, Fuchs C, Siegel N, Valli A, Hengstschlager M. Hum Mol Genet. 2009;18:3298–3310. doi: 10.1093/hmg/ddp271. [DOI] [PMC free article] [PubMed] [Google Scholar]
- 21.Zhou J, Su P, Wang L, Chen J, Zimmermann M, Genbacev O, Afonja O, Horne MC, Tanaka T, Duan E, Fisher SJ, Liao J, Chen J, Wang F. Proc Natl Acad Sci U S A. 2009;106:7840–7845. doi: 10.1073/pnas.0901854106. [DOI] [PMC free article] [PubMed] [Google Scholar]
- 22.Eiraku M, Takata N, Ishibashi H, Kawada M, Sakakura E, Okuda S, Sekiguchi K, Adachi T, Sasai Y. Nature. 2011;472:51–56. doi: 10.1038/nature09941. [DOI] [PubMed] [Google Scholar]
- 23.Suga H, Kadoshima T, Minaguchi M, Ohgushi M, Soen M, Nakano T, Takata N, Wataya T, Muguruma K, Miyoshi H, Yonemura S, Oiso Y, Sasai Y. Nature. 2011;480:57–62. doi: 10.1038/nature10637. [DOI] [PubMed] [Google Scholar]
- 24.Bauwens CL, Peerani R, Niebruegge S, Woodhouse KA, Kumacheva E, Husain M, Zandstra PW. Stem Cells. 2008;26:2300–2310. doi: 10.1634/stemcells.2008-0183. [DOI] [PubMed] [Google Scholar]
- 25.Hwang YS, Chung BG, Ortmann D, Hattori N, Moeller HC, Khademhosseini A. Proc Natl Acad Sci U S A. 2009;106:16978–16983. doi: 10.1073/pnas.0905550106. [DOI] [PMC free article] [PubMed] [Google Scholar]
- 26.Sargent CY, Berguig GY, Kinney MA, Hiatt LA, Carpenedo RL, Berson RE, McDevitt TC. Biotechnol Bioeng. 2010;105:611–626. doi: 10.1002/bit.22578. [DOI] [PubMed] [Google Scholar]
- 27.Dolznig H, Grebien F, Sauer T, Beug H, Mullner EW. Nat Cell Biol. 2004;6:899–905. doi: 10.1038/ncb1166. [DOI] [PubMed] [Google Scholar]
- 28.Pusch O, Bernaschek G, Eilers M, Hengstschlager M. Oncogene. 1997;15:649–656. doi: 10.1038/sj.onc.1201236. [DOI] [PubMed] [Google Scholar]
- 29.Fantes PA, Nurse P. Exp Cell Res. 1978;115:317–329. doi: 10.1016/0014-4827(78)90286-0. [DOI] [PubMed] [Google Scholar]
- 30.Rupes I, Webb BA, Mak A, Young PG. Mol Biol Cell. 2001;12:3892–3903. doi: 10.1091/mbc.12.12.3892. [DOI] [PMC free article] [PubMed] [Google Scholar]
- 31.Umen JG. Curr Opin Cell Biol. 2005;17:435–441. doi: 10.1016/j.ceb.2005.06.001. [DOI] [PubMed] [Google Scholar]
- 32.Huang S, Chen CS, Ingber DE. Mol Biol Cell. 1998;9:3179–3193. doi: 10.1091/mbc.9.11.3179. [DOI] [PMC free article] [PubMed] [Google Scholar]
- 33.Card DA, Hebbar PB, Li L, Trotter KW, Komatsu Y, Mishina Y, Archer TK. Mol Cell Biol. 2008;28:6426–6438. doi: 10.1128/MCB.00359-08. [DOI] [PMC free article] [PubMed] [Google Scholar]
- 34.Becker KA, Ghule PN, Therrien JA, Lian JB, Stein JL, van Wijnen AJ, Stein GS. J Cell Physiol. 2006;209:883–893. doi: 10.1002/jcp.20776. [DOI] [PubMed] [Google Scholar]
- 35.Becker KA, Stein JL, Lian JB, Van Wijnen AJ, Stein GS. Journal of Cellular Physiology. 2010;222:103–110. doi: 10.1002/jcp.21925. [DOI] [PMC free article] [PubMed] [Google Scholar]
- 36.Filipczyk AA, Laslett AL, Mummery C, Pera MF. Stem Cell Res. 2007;1:45–60. doi: 10.1016/j.scr.2007.09.002. [DOI] [PubMed] [Google Scholar]
- 37.Singhvi R, Kumar A, Lopez GP, Stephanopoulos GN, Wang DI, Whitesides GM, Ingber DE. Science. 1994;264:696–698. doi: 10.1126/science.8171320. [DOI] [PubMed] [Google Scholar]
- 38.Chen CS, Mrksich M, Huang S, Whitesides GM, Ingber DE. Science. 1997;276:1425–1428. doi: 10.1126/science.276.5317.1425. [DOI] [PubMed] [Google Scholar]
- 39.Watt FM, Jordan PW, O’Neill CH. Proc Natl Acad Sci U S A. 1988;85:5576–5580. doi: 10.1073/pnas.85.15.5576. [DOI] [PMC free article] [PubMed] [Google Scholar]
- 40.McBeath R, Pirone DM, Nelson CM, Bhadriraju K, Chen CS. Dev Cell. 2004;6:483–495. doi: 10.1016/s1534-5807(04)00075-9. [DOI] [PubMed] [Google Scholar]
- 41.Wan LQ, Kang SM, Eng G, Grayson WL, Lu XL, Huo B, Gimble J, Guo XE, Mow VC, Vunjak-Novakovic G. Integr Biol (Camb) 2010;2:346–353. doi: 10.1039/c0ib00016g. [DOI] [PMC free article] [PubMed] [Google Scholar]
- 42.Cho YM, Kwon S, Pak YK, Seol HW, Choi YM, Park do J, Park KS, Lee HK. Biochem Biophys Res Commun. 2006;348:1472–1478. doi: 10.1016/j.bbrc.2006.08.020. [DOI] [PubMed] [Google Scholar]
- 43.St John JC, Ramalho-Santos J, Gray HL, Petrosko P, Rawe VY, Navara CS, Simerly CR, Schatten GP. Cloning Stem Cells. 2005;7:141–153. doi: 10.1089/clo.2005.7.141. [DOI] [PubMed] [Google Scholar]


