

Abstract
In diabetic disease, blood glucose, HbA1c and insulin levels qualify as biomarkers reflecting endocrine pancreas function, but their shortfall in being truly useful predictors or surrogate endpoints of “abnormal processes or disease” lies in that alteration in their levels are dependent on a variety comorbidities and occur too late in the disease process to be useful sentinels. Non invasive imaging of molecular targets within the beta cell carry the promise of revealing quantitative information about β-cell mass that can, at least theoretically, be used to monitor, in real-time, the natural history of T1DM progression, assess novel therapies designed to drive the proliferation and differentiation of endogenous beta cell progenitors, appraise methods of preserving mature beta cell mass as well as to track the function and viability of transplanted cells and tissues. In this article, we review and deconstruct available information regarding the methodology of making non invasive measurements of VMAT2 in the pancreas and the validity of these measurements to estimate beta cell mass in vivo.
Keywords: VMAT2, PET, diabetes, beta cell mass, DTBZ
INTRODUCTION
The National Cancer Institute defines a biomarker as “A biological molecule found in blood, other body fluids, or tissues that is a sign of a normal or abnormal process, or of a condition or disease. A biomarker may be used to see how well the body responds to a treatment for a disease or condition.” [1, 2]. In the context of diabetes, blood glucose, HbA1c and insulin levels all qualify as biomarkers reflecting endocrine pancreas function, but their shortfall in being truly useful predictors or surrogate endpoints of “abnormal processes or disease” lies in that alteration in their levels are dependent on a variety comorbidities and occur too late in the disease process to be useful sentinels [3–5]. Because diabetic disease is projected to represent a significant world health care burden there is currently a significant international research effort directed at finding better biomarkers of diabetic disease (see http://nihroadmap.nih.gov, Imaging Probe Development Center: a National Institutes of Health core synthesis resource for imaging probes and reviewed in [6].
Over the past few years our laboratory has taken on the challenge of identifying and validating novel biomarkers of diabetic disease suitable for non invasive imaging of beta cell mass (BCM) [7]. Several approaches to the identification of beta cell mass biomarkers have been identified, including proteomic (reviewed in [8]), immunologic [9, 10], combinatorial peptide chemistry [11] and gene expression profiling [12–14] (see also the Beta Cell Genomics resource (http://genomics.betacell.org).
Using a functional genomics approach to study tissue-restricted transcripts in human islets, we identified a series of “neurofunctional” gene products in beta cells [15]. An examination of the tissue distribution of expression of one of these transcripts vesicular monoamine transporter type 2 (VMAT2), expressed by β-cells and monoaminergic neurons of the CNS, but absent from the exocrine pancreas, liver, kidney and other abdominal organs suggested that it might be suitable as a biomarker of BCM. Another advantage in the selection of VMAT2 as a candidate biomarker was that a specific VMAT2 ligand, dihydrotetrabenazine (DTBZ), was already in clinical use for positron emission tomography (PET) imaging of dopaminergic neurons within the central nervous system. Since that time we and others have been evaluating the fidelity with which this molecule reflects beta cell mass and developing different methods to quantitate VMAT2 in the pancreas [7, 16–20]. In this review we will summarize what has been learned in these studies, outline current research and discuss possible futures of quantitation of BCM by way of VMAT2.
VMAT2, AN IMPERFECT BIOMARKER OF BETA CELL MASS
It makes biochemical sense that the closer the biomarker is to the disease process in question, the more faithful alterations in the biomarker will reflect the course of disease. Thus a good understanding of relationship between VMAT2 expression and function and beta cell biology are needed to interpret measurements of VMAT2 in the context of the pathogenesis of diabetes.
Despite originating from different lineages, pancreatic endocrine cells, enterochromaffin cells, cells of the oxyntic stomach, and neurons share a broad range of expressed genes, including VMAT2 [15, 21–23]. These shared gene products represent the means whereby gastro-enteropancreatic motility and secretion are, at least partly, regulated by neurotransmitters, neurons and neuroendocrine cells (reviewed in [23]). The neuroendocrine cells synthesize and/or take-up biogenic monamines and peptide hormones, which are then secreted and used in signalling and coordination of gastro-enteropancreatic function [23]. The uptake of the monoamines, such as epinephrine, norepinephrine, dopamine, serotonin and histamine is assisted by VMATs [23]. Such transporters move monoamines from the cytoplasm into secretory vesicles. VMATs are categorized into two types (i.e. type 1 & 2) on the basis of structure, substrate specificity and pattern of tissue expression [24, 25](28; 29). Since previous studies had shown that parasympathetic, sympathetic and sensory nerve fibres innervate pancreatic islets [26] running in parallel with vessels carrying blood to be monitored by the endocrine pancreas, one of the first goals in evaluating VMAT2 as a possible biomarker of BCM was to evaluate the relative contribution of neuronal VMAT2 to beta cell expressed VMAT2.
Anlauf et al. [27] where the first to evaluated VMAT2 distribution in the pancreas of humans and monkeys. Using double label immunofluorescent histochemistry (IHC) and in situ hybridization (ISH), they reported VMAT 2 staining co-localized with islet beta cell insulin staining and VMAT 2 staining was absent from exocrine tissue. Further experimentation using immunogold decoration and transmission electron microscopy show that VMAT2 is present on the membranes of the same vesicles containing insulin. Double label immunofluorescent histochemistry also showed that VMAT2 staining did not co-localize with islet cells expressing glucagon (a-cells), somatostatin (d-cells) and pancreatic polypeptide. From our unpublished studies and those of Saisho et al. [28] of human pancreas sections, filamentous VMAT2 staining can be found in structures presumable representing the autonomic innervation, but the total area of these structures was insignificant (less than 0.1 %) in comparison to the area of VMAT2 staining associated with beta cells.
Saisho et al. [28]also examined the correlation between VMAT2 and islet peptide hormone immunoreactivity in pancreata obtained from healthy controls as well as from individuals with T2DM and long term T1DM. Pancreata were stained for insulin and VMAT2, and fractional β-cell and VMAT2 areas were determined. Sections were also examined for other neuronal markers. Overall, there was a strong relationship between the fractional pancreas area positive for insulin and VMAT2 (r2 = 0.98, p<0.01) in all groups examined. In cases with the lowest β-cell numbers (long standing T1DM) the VMAT2 fractional area was slightly (~0.1%) greater than β cell area (p < 0.01)(29). Also discovered was that there exists a small population of cells (0.3–0.6%) positive for pancreatic polypeptide (PPY) and VMAT2. In the tail and body of the pancreas approximately 4 in 10 of PPY cells also expressed VMAT2. As previously noted, PPY cells are infrequent in the body and tail of the pancreas, yet found to be enriched in the head of the pancreas, a region of pancreas that could not be studied by the authors due to sampling limitations.
About 30 years ago a series of papers described the distribution and frequency of PPY cells within the entire human pancreas of both T1DM patients and controls [29–32]. Together these paper reported the following information related to the validity of VMAT2 as biomarker of BCM; 1) the pancreas has a heterogeneous distribution of PP+ cells, 2) PP + cells are enriched in the posterior portion of the head of the pancreas, 3) in this posterior lobe, which may account for as much as 10%–15% of the total weight of the pancreas, PP+ cells may be as frequent as 6 to 8 out every 10 endocrine cell, 4) in long term diabetes, because of β-Cell loss and atrophy of the body and tail of pancreas, the volume density is relatively increased, and 5) in longstanding diabetes, there is an increase frequency of PPY+ cells in association with ducts and periductal islet-like structures. The total PPY cell burden in the pancreas has been estimated to represent 10 to 20% of the BCM (JC Henquin, personal communication). If four in every ten PPY cells are VMAT2 positive and the PPY cell mass is up to one fifth of BCM, we might expect that the non β-cell associated VMAT2 content (e.g. in long term type one diabetic patients) could represent as much as 8–10% of the total β-cell associated VMAT2 content in healthy controls. It is important to note that the older studies may have suffered in accuracy because of problems in the specificity of the anti PPY antisera used and that at least some of these PP+/VMAT2 + cells may represent committed progenitors of β-cells [33].
Judging by the studies of Saisho et al. [28], it appears that VMAT2 expression faithfully represents β-cell mass under non homeostatic conditions found in T2DM, such as chronic hyperglycemia and hyperlipdidemia, although certainly more data is still needed. In the ZDF rodent model of T2DM, VMAT2 measurements also correlate well with insulin/β-cell area measurements (Freeby et al. in preparation) under well documented circumstances of hyperlipidemia [34]. At the other end of the experimental spectrum, we have examined transcript abundance of VMAT2 and insulin in rodent β-cells lines. Our preliminary data suggest that under culture conditions where changing glucose concentrations (from 0 mM to 10 mM) are shown to drive insulin (INS 1 & 2) transcription up [35] VMAT2 transcript abundance remains stable. Likewise, under culture conditions where changing glucose concentrations (from 11.2 mM to 30 mM for 48 hours) are known to drive insulin transcription down [36], VMAT2 transcript abundance remained unchanged (unpublished results). These data are consonant with the known differences between regulation of insulin and VMAT2 gene expression (reviewed in [37, 38]).
Thus VMAT2 has an intimate relationship with β-cell mass and function, by virtue of its expression being topologically close to insulin. In β-cells, the regulation of VMAT2 expression is clearly different from that of insulin and appears to be a major advantage, at least compared to insulin, in using VMAT2 as a biomarker of BCM. But VMAT2 expression is also promiscuous in this context because expression is not completely restricted to β-cells, as a low frequency of PP cells, as well as the innervation, are VMAT2 positive. We are currently quantifying the expression of VMAT2 and other pancreatic polypeptides in tissues obtained from the head of the pancreas to obtain a more accurate description of the VMAT2+/ PPY+ cell population.
IMAGING HUMAN β-CELL MASS WITH VMAT2 LIGANDS
On the basis of promising preclinical rodent imaging experiments [7, 37], we tested the hypothesis that the total amount of VMAT2 within the pancreas, as measured by PET scans with [11C](+)DTBZ, would be significantly lower in patients with longstanding T1DM than in healthy volunteers. Fifteen subjects, consisting of patients with long-standing T1D (n = 6), and healthy controls (n = 9) were enrolled for this study. The key inclusion criteria for healthy controls were fasting glucose < 100 mg/dl and no first-degree relative with type 2 diabetes mellitus. As a parallel measure of β-cell mass/function, each study subject underwent a Mixed Meal Tolerance test (MMTT), where β-cells are stimulated to secrete insulin following ingestion of a nutrient load. The sum of serial measurements of serum Insulin C-peptide concentrations performed after the nutrient challenge, given as area-under-the curve, represent one current standard of care measurement of β-cell mass [39]. Demographic and laboratory data of 9 healthy controls and 6 T1D subjects are summarized in Table 1. The T1D population were unable to produce insulin in the MMTT suggesting that they had little or no remaining β-cell mass. Subjects were given a bolus injection of 370–740 MBq of [11C] (+) DTBZ and PET data were acquired for 90 min on a Siemens Accel scanner. After correcting for attenuation, scatter, radioactive decay, the PET data were reconstructed using filtered back projection.
Table 1.
Demographic and Laboratory Data
| Control (n = 9) | T1D (n = 6) | p | |
|---|---|---|---|
| Age (years) | 30.1 ± 2.9* | 35.0 ± 2.3 | 0.12 |
| Gender (male:female) | 5:4 | 2:4 | NA† |
| Body Mass Index (kg/m2) | 23.4 ± 1.1 | 24.6 ± 0.8 | 0.22 |
| Weight (kg) | 66±12 | 72±4 | 0.32 |
| Hemoglobin A1c (%) | 5.1 ± 0.1 | 6.9 ± 0.4 | < 0.001 |
| Insulin Dose/Day (units/kg/day) | NA2 | 39.1 ± 4.5 | NA |
| Duration T1D (years) | NA | 27.3 ± 1.5 | NA |
| Estimated GFR – MDRD (mL/min/1.73m2) | 99.8 ± 7.8 | 99.2 ± 5.1 | 0.48 |
Standard error of the mean
NA, not applicable
A. First Round of PET data Analysis
As a first estimate, regions of interest (ROI) were placed by hand on the reconstructed images of pancreas, kidney and liver and other abdominal organs. It became clear that, at least in late frames of the study, that there would be difficulty in accurately defining the pancreas region of interest because of contamination of radioactive bile in the head of the pancreas, surrounding bowel loops and presence of activity in the stomach. Regions of interest in the pancreas were placed relying mostly on the distinctive high level of blood flow to pancreas easily visible in the first few frames following injection and the time activity curves obtained from the dynamic studies. From these dynamic studies we were able to distinguish many of various abdominal organs on basis of the kinetics of radiotracer accumulations and washout. As might be expected, we also found that the kinetics of metabolized [11C] (+) DTBZ accumulation in the bile, a route of tracer elimination, was distinct from radiotracer accumulation and washout in the pancreas. From the time activity curves of the study subjects, we calculated the average Binding Potential (a measure of the concentration of the VMAT2 target in the region of interest) (BP) using methods already described in detail [16].
Overall the results of the study could be summarized as “good news/bad news.” In controls subjects, we found that a significant positive correlation of BP with the area under the C-peptide curve measurements as might be expected for a gold standard measurement of β-cell mass (Fig. 1). The bad news however, was that we also found significant overlap between the signals of healthy controls with presumably “normal” β-cell masses and type 1 diabetic individuals with β-cell masses predicted to be approaching zero (Fig. 2). Two other centers have performed similar studies with similar preliminary results [40] (M. Kilborn, personal communication).
Fig. 1.
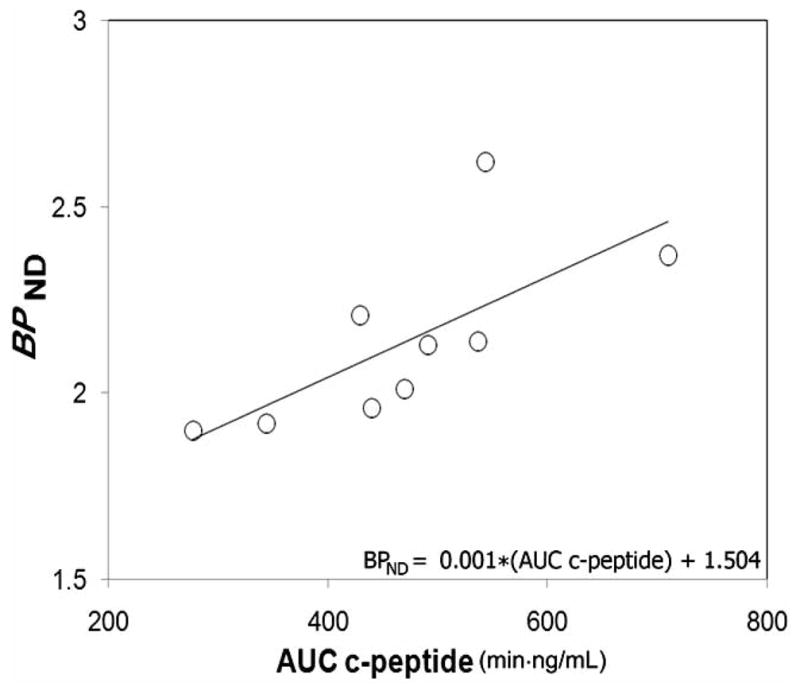
Association between binding potential and glucose-stimulated insulin secretion in control population. Average pancreatic BPND values and AUC c-peptide measures for each healthy control individual were evaluated for strength of association by linear correlation. The regression line BPND = 0.001 * AUC c-peptide + 1.504 yielded a correlation coefficient of r2 = 0.50 and p =0.03. The X and Y intercepts were −1504 and 1.504, respectively. Using non parametric statistics and analyzing the data from T1D patients and controls together, we found a significant correlation (r = 0.82, p =0.001) between insulin secretion, measured as AUC c-peptide, and binding potential (BPND).
Fig. 2.
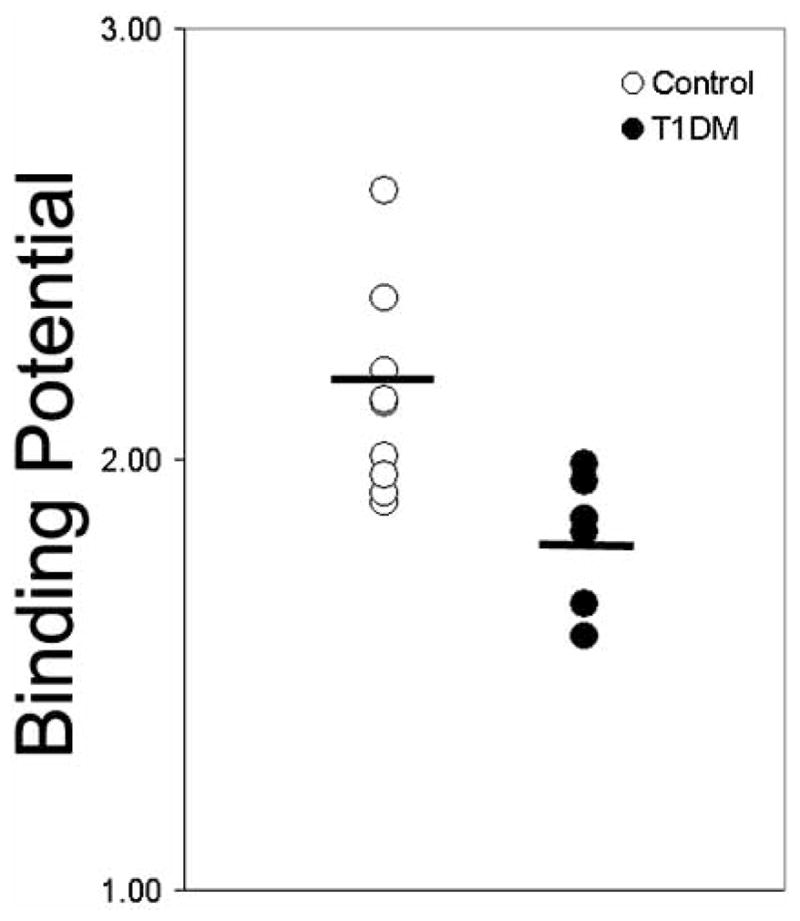
Comparison of Binding Potentials in a population of healthy euglycemic individuals and a weight age matched population of patients with long-term type 1 diabetes. The average non thresholded binding potential is shown by the black bar. The p-value for the difference in the means was 0.014.
B. Second Round of PET Data Analysis
We next developed a list of potential sources of “errors” which might have contributed to a systematic overestimate of the binding potential in the pancreas of longstanding type one diabetes and their possible solutions.
Because [11C] DTBZ is also eliminated in bile, we speculated that errors in ROI definition might lead to overestimating the true average BP in the pancreas. Were our definitions of the pancreatic ROI to stray into bowel carrying radioactive bile, then the average BP of the pancreas might be overestimated. Our concurrent and previous MR studies of healthy and T1D pancreata show that long-term T1D pancreata are one-half the volume of weight-matched healthy controls [41]. In the smaller T1D pancreata, bile contamination of ROI might represent a greater percent error than in the larger normal volume control pancreata. Also the possibility that radioactive bile within the common duct in head of the pancreas might be contributing to the average signal in the region of interest of all pancreata, where no VMAT2 was actually present, needed to considered. Normal respiratory motion also affected the position of the pancreas and thus the definition of the ROI.
The radioligand, [11C] DTBZ, was binding to VMAT2 expressed by other cellular, but non β-cell pancreatic targets. We now have evidence that this is true, but the a precise definition of the extent to which VMAT2 is present on PPY cells is still forthcoming. From previous studies [29–32] the PPY+/VMAT+ cell mass is estimated to be less than ten percent of the normal pancreatic β-cell mass however. The contribution to total VMAT2 by VMAT2 expression in neuronal cells in pancreas appears to insignificant [20].
There is accumulating evidence suggesting that [11C] (+) DTBZ binding to VMAT2 is sensitive to monoamine content in the local environment around the ligand binding site. For example, it was found that there was increased [11C] (+)DTBZ binding in instances of dopamine (DA) depletion ( i.e. methamphetamine users and DOPA responsive dystonia) [42, 43]. We hypothesized that, since DA is an important regulator of β-cell function [44, 45], the vesicular DA content might be different in normal pancreas versus T1D pancreata and binding of [11C] (+) DTBZ to VMAT2 was qualitatively different (higher occupancy) in T1DM. If VMAT2 were expressed at low levels, outside the β-cell population and the dopamine microenvironment affected by the loss of β-cells in T1DM, the apparent density the “off-target” VMAT2 might appear to be increased relative to a healthy pancreas.
Nonspecific binding of radioligand resulting in compression of the true difference between pancreata with “normal” amount BCM and pancreata depleted of β-cells as believed to be found in longstanding diabetic disease. In the analysis methods chosen, we selected the kidney cortex as a reference region that would serve to estimate the nonspecific binding of the radioligand in pancreas. If the kidney bound less ligand non specifically than the pancreas, the BP calculation would be an overestimate. While non specific binding would contribute errors to the BP calculations in both healthy controls and T1D patients (although not necessarily equally), understanding the extent of non specific binding in T1DM pancreata would help reconcile the expectation that the long term diabetic pancreas should have no β-cells and therefore no VMAT2. However, our more recent histology studies (discussed above) suggest that must now revise our expectations of the amount of this biomarker in the long-term type 1 diabetic pancreas.
Thus the problems we identified could be categorized as difficulties in defining the ROI, poor understanding of the true target distribution of the biomarker, differences in radioligand binding microenvironment and a questionable validity of using the kidney cortex as a reference tissue. A more detailed analytical approach, a voxel wise analysis of tracer kinetics, frequently used in analysis of the brain [46], was identified as a possible simultaneous solution to many of the problems encountered. We reasoned that a voxel wise analysis of tracer kinetics would help us better define the region of interest of the pancreas, allowing us to visualize possible heterogeneity of ligand binding within the pancreas, including low binding potential voxels that might be associated with non specific binding, voxels with kinetic profiles attributed to bile contamination.
For each voxel in the PET field of view, we obtained a tracer time activity profile. Next voxels with similar time activity curves were clustered [47, 48] and assigned a specific color (Fig. 3). From these maps of voxels with similar tracer kinetics, the regions of interest were revised and compared to coregistered MR images of the abdomen (and again revised if found to overlap bowel, stomach, spleen). Finally, parametric images of the pancreas and abdomen, were the BP of each voxel in the field of view is calculated and color mapped, were created. We next examined the absolute and relative frequency distribution of BP values for each voxel in the pancreas ROI (Fig. 4) of patients with long standing T1DM and their control counterparts. From these Fig. 4, its apparent that the average distributions of BP values among patients with long standing T1DM and the controls are significantly different, with control pancreata containing significantly higher proportion of high BP voxels relative to T1DM pancreata and, conversely, T1DM pancreata containing a significantly higher proportion of low BP voxels.
Fig. 3.
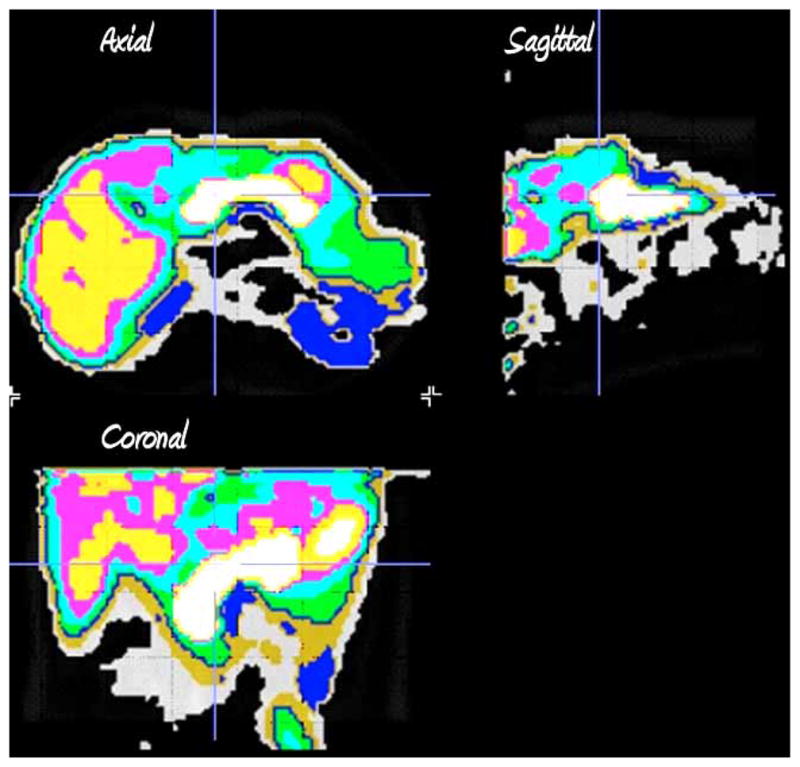
Tissue segmentation by clustering of voxel kinetic data. Axial, sagittal and coronal sections of the clustered kinetic data accurate define the different abdominal tissues. Following clustering each kinetic family of voxel data is assigned a different color.
Fig. 4.
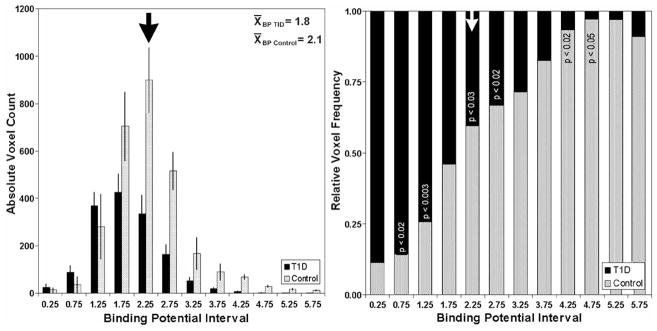
Histogram summary of voxel BPND in control and T1D pancreata. Left panel. The average voxel count at each BPND interval is displayed for controls (n=9) in gray and patients with T1D (n=6) in black. The error bars represent the S.E.M. Right panel. The voxel counts at each BPND interval were normalized to the total number of voxels for controls in gray and patients with T1D in black. The significance of the difference at each BP interval is shown in the stacked columns.
As further refinement we also considered the following. In animal models of diabetes, BCM is frequently estimated by immunohistochemistry. Serial pancreas tissue sections stained for insulin immunoreactivity are evaluated for total pancreas area and total area of insulin staining cells. The total BCM is calculated from the product of the average fractional β-cell area and the mass of the pancreas [49]. Because these β-cell area density measurements are analogous to the BP measure provided by PET, and because of the close association of insulin and VMAT2 [27], we reasoned that the product of voxel BP and voxel volume, summed over the entire pancreas ROI (functional binding capacity (FBC) or VMAT2 index) would be an appropriate estimate of the total pancreatic DTBZ binding sites and that FBC could be used as a biomarker of BCM. We also reasoned that one way to reduce the confounding effects of non specific binding of radioligand in the pancreas would be to consider only “high” BP voxels as truly representing the [11C] (+) DTBZ specifically bound to VMAT2. A difficulty in this approach was that we had little data to help us decide where the threshold should be set to reduce the effects of non specific binding.
In the final empirical approach, we calculated the sum of the products of each voxels’ BP value times the voxel volume (in cm3), the FBC, first considering all voxel BP values greater than zero (> 0), then all voxel BP values greater than 1.5 (> 1.5), then all voxels with BP values greater zero greater than 2.0, 2.5 etc for each study subject. We next compared the average FBC among control subjects and patients with T1DM, at each threshold level. As might be expected from an examination of Fig. 4, at each higher threshold, the difference in average FBC between controls subjects and patients with longstanding T1DM increased, but statistical significance (p<0.05) could only be maintained at the BP >2.5 level (Fig. 5, inset), due to the ever diminishing number of total voxels at each higher threshold. We also reexamined the correlation of the thresholded FBC values with the area under the curve c-peptide β-cell functional assay (AUC C-peptide) (Fig. 5). We found that there a statistically significant correlation between FBC values and AUC C-peptide as might be expected for a valid measure of β-cell mass at all threshold values. Also apparent was that the recalculation of the PET signals as a thresholded functional binding capacity reduced (but did not completely eliminate) the amount of overlap in the population of healthy controls and patients with longstanding T1DM. The reduction in overlap between the two populations is in part due to differences in the average pancreas volume (i.e. 50%), but the overall difference in FBC (70%) also reflects a significantly reduced density of specific DTBZ binding sites in the T1DM population as measured by PET.
Fig. 5.

Relationship between thresholded VMAT2 index (BPnd ≥ 2.5) and insulin secretory capacity in healthy controls (grey squares) and patients with longstanding type 1 diabetes (filled squares). The strength and significance of the relationship between VMAT2 index and AUC C-peptide was calculated using the Spearman Rank nonparametric method (r =0.82, p < 0.002). Inset: the mean values of the VMAT2 index for healthy subjects and patients with T1DM are shown (black bars) as well as the individual values. The method of Student was used to calculate the two tailed p value.
C. Lessons learnt from first study
We concluded from this first study in humans the following:
Measurements of VMAT2 in the pancreas appear to faithfully reflect insulin secretion capacity in controls but fail to be convincing in long-term T1DM patients were the predicted β-cell mass approaches zero.
The unexpectedly high estimates of total pancreatic VMAT2 in T1DM patients and the unexpectedly low measurements of total pancreatic VMAT2 in some controls require some form of explanation. Nonspecific binding of the radioligand to exocrine pancreas is the simplest, although not necessarily the complete, explanation for the poor level of separation of the PET signal between T1DM pancreata and controls. Alternatively, the VMAT2 density measurements were precise (i.e reflecting the normal population variation), but inaccurate (because of the systematic overestimation of binding potential) and the overlap between patients and controls is correct, but misunderstood. Alternate, non β-cell sources of VMAT2 (e.g. PPY cells in the head of the pancreas) cannot completely explain the large signal in long-term T1DM patients. Contamination of the head of the pancreas by radioactive bile in both populations was a possible problem that still requires further resolution. A better anatomical definition of the pancreas ROI might offer a solution.
The second analytical method applied in our study, a voxel wise calculation of Binding Potential visualized significant differences between Controls and T1DM pancreata, but a biological/ biochemical explanation for the extent of the differences is lacking. Furthermore the voxel wise analysis maybe too cumbersome for routine use. The kinetic method of identifying the pancreas ROI could be replaced or certainly aided by PET/CT or even better, by PET/MR. The use of CT, and the more precise definition of the ROI it provides, might be of help in analyzing different parts of the pancreas separately.
PET scans for VMAT2 in pancreata from individuals with long-term disease may be of limited usefulness in predicting what will be seen in longitudinal studies of patients with new onset disease. The pancreas in long-term disease has shrunk to about 50% of its normal volume; there are exocrine functional deficiencies and other abnormalities (i.e. a general atrophy) that may all affect ligand binding in ways dissimilar to ligand binding in the new onset pancreas (e.g. dopamine microenvironment).
Our experience in preclinical rodent studies, where a wide variation in control VMAT2 PET signals was also observed, suggested that the clinically useful measure obtained from PET scanning for VMAT2 would be in the form of a change in signal, not in its absolute amount. This human study suggests that this is still the best approach.
A number of questions arise from this first human PET imaging study of β-cell mass. Why are the results of this human study so different from previous rodent studies? In preclinical rodent studies, we usually found a significantly smaller residual pancreatic VMAT2 signal following development or induction of profound diabetes (i.e blood glucose concentration > 400 mg/dL). As mentioned above, in humans, a low frequency of PPY cells also express VMAT2. Rats apparent have a similar frequency and distribution of PPY cells, perhaps ruling out PPY cells as an explanation for the difference in PET signals between the two species [32]. What is the basis of the large amount of variability in apparent β-cell masses as measured by PET and observed in the control and T1DM population? Was this variability due to errors generated during the measurement, or reflecting natural variability present in the population or some combination of both factors? Perhaps the most important question remaining is “is VMAT2 still a candidate biomarker for β-cell mass measurements by PET?” and will PET measurements of VMAT2 be suitable for making clinically useful measurements of β-cell mass.
NATURAL VARIATIONS IN β-CELL MASS PROMISE TO CONFOUND CROSS SECTIONAL STUDIES
In preclinical rodents studies [7], we first tested the hypothesis that targeting vesicular monoamine transporters, type 2 (VMAT2), expressed by β-cells, with [11C]DTBZ and the use of PET, can provide a useful measurement of BCM. Here, we demonstrated decreased radioligand uptake within the pancreata of diabetic rodents, either following the induction of persistent hyperglycemia by streptozotocin or following the spontaneous development of a disease mimicking T1DM in humans. Also apparent in these studies was a notable amount of rat to rat variation (both in inbred and outbred species) in VMAT2 density (receptors available/unit volume) as measured by PET (Fig. 6). This natural variation in BCM is also evident in humans as supported by a later β-cell mass histomorphometry study by Butler et al [20], who reported as great as a five-fold difference in fractional β-cell area in otherwise healthy age/weight matched euglycemic individuals. The fractional β-cell area reported by Butler et al and the PET outcome measures employed in our studies are dimensionally similar density measurements, an amount per unit volume. A comparison of relative standard errors from four studies of β-cell density, one in control rodents based on histomorphometry [50], the aforementioned study in non-diabetic humans also based on histomorphometry, one study in control non diabetic rodents based on non invasive PET measurements [7] and one study in non diabetic humans based on non invasive PET measurements [16], reveals the following range of variation 23%, 15%, 10%, and 12% respectively.
Fig. 6.
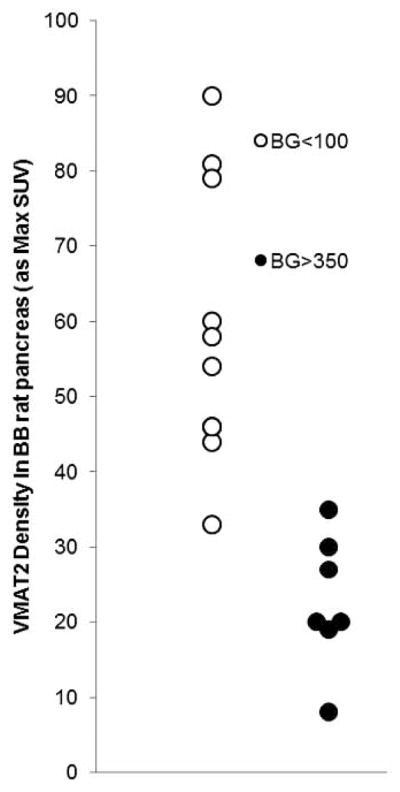
Examination of the Population Variability in VMAT2 in a cohort of BB rats. Young euglycemic BB rats ( > 7 weeks old) and BB rats with frank diabetes (blood glucose > 350 mg/dL and >12 weeks old) were scanned with [11C] (+) DTBZ and the VMAT2 quantitatied as max SUV. The p value for the difference between the population means was less than <0.001.
Aside from the inherent variability of the PET based VMAT2 quantitation method (test retest studies are discussed below), there are other possible origins of variability in pancreatic VMAT2 density. Allelism in the promoter for VMAT2, complete with gain of function haplotypes [51] might contribute to the observed variations in VMAT2 amounts measured in the control and T1DM population. We are currently investigating this possibility with a reporter assay and β-cell lines. As mentioned above, the presence of non β-cell - PPY associated VMAT2 and the over estimation of the true BP values accounts for much of the high PET signals found in the long standing diabetic disease population studied. This fact and the natural variability of β-cell mass would also explain the overlap of PET signals found among the population of T1DM patients and euglycemic control subjects (Fig. 5 inset and Fig. 2). Together these observations emphasize that any approach to making clinically useful β-cell mass measurements, particularly PET, are likely to be better served by studies designed to measure longitudinal changes in VMAT2 rather than static quantities and that making comparison between individuals on the basis of one time measurements may be difficult to interpret in light of the normal variation in BCM from one individual to another.
NEXT GENERATION VMAT2 PROBES
A. 18F-Fluoropropyl -(+)-DTBZ: An Improved Ligand for VMAT2 Quantitation
An important drawback of [11C] (+) DTBZ is the short 20-minute half-life of 11C, restricting use of this radioligand to centers with on-site cyclotrons. Alternative fluoroalkyl derivatives of dihydrotetrabenazine labeled with 18F (a 110 min half-life) have recently been developed by Kilbourn et al. [52, 53]. It is likely that such 18F-labeled VMAT2 tracers could be readily manufactured and distributed for PET imaging studies in a wider variety of secondary care settings. Of these fluoroalkyl derivatives, the optically resolved active ligand 9-fluoropropyl-(+)-DTBZ (18F-FP-(+)-DTBZ) has been shown to be a suitable radioligand for VMAT2 imaging and shows high affinity (Kd = 0.1 nM) (N.B. a higher affinity for VMAT2 relative to DTBZ) and selectivity for VMAT2. Our findings with [11C] (+) DTBZ in the streptozotocin treated rat model have been confirmed by Kung et al using 18F-FP-(+)-DTBZ [54] and vice versa, our preliminary studies using 18F-FP-(+)-DTBZ in the STZ model confirm the finding of Kung et al. In the past few months we have seen that 18F-FP-(+)-DTBZ has other favorable qualities suggesting that it may be better for quantitation of VMAT2 (and BCM) such as:
B. Better Signal to Noise Ratio Due to Less Nonspecific Binding in the Reference Tissue
In rodent studies with [11C] (+) DTBZ, we have observed that there is a portion of the PET signal in the pancreas that cannot be blocked by cold ligand (Fig. 7, Left Panel A - Pancreas B and Pancreas C time activity curves). Using the kidney cortex as a VMAT2 free references region leads to an underestimation of the pancreatic PET signal originating from nonspecific binding. The signal to noise ratio is estimated to be about two. In similar experiments, using 18F-FP-(+)-DTBZ, a greater portion of the signal is blocked by cold ligand (Fig. 7, Right Panel) and the pancreas time activity, measured in the presence of excess cold ligand, approaches the time curve of the kidney cortex reference region. Together these data suggest that, at least in rodents, using the kidney cortex as a reference region is valid for estimating the non-saturable, non specific binding of 18F-FP-(+)-DTBZ in the pancreas. Lastly, the signal to noise ratio is almost two-fold better, relative to that measured using [11C] DTBZ.
Fig. 7. Comparison of radioligands, VMAT2 quantitation and blocking studies.

Rodents were anesthetized and imaged dynamically with about 7–11 MBq of [11C]DTBZ (left panel) or [18F]FP DTBZ (right panel). In some studies cold DTBZ was given before or after hot ligand. From reconstructions of the dynamic image data, pancreas (Pan A–C) and kidney (Kidney A–C) regions of interest were identified to obtain time activity curves (TACs) corrected for dose and animal weight (displayed as SUV TACs). The extent to which excess cold ligand is able to block the radioactivity taken up by the pancreas is shown in the % block column. Comparing this value across left and right panels shows that [18F]-FP-DTBZ is more readily displaced relative to [11C] (+) DTBZ by cold DTBZ (2 mg/Kg) as shown by the higher % blocking value. SUV or standardized uptake value is a measure of radioligand uptake that compares the concentration of radioligand in tissue of interest to what it would hypothetically be where the dose to have been dispersed in a glass of water of equal volume/mass. In each case it can be seen that [18F]-FP-DTBZ gives a higher signal.
A similar question regarded the suitability of using the kidney as reference region to estimate pancreas non specific binding of radioligand also arose in our human experiments with [11C] (+) DTBZ [16]. An ideal reference tissue is within the same field of view as the target, has a negligible receptor density and its distribution volume should be the same as the distribution volume in the target when all receptors are blocked or alternatively the same distribution volume when using the non receptor binding but chemically similar opposite stereoisomer of the probe in question. Thus prior to performing any PET based pancreatic VMAT2 measurements with 18F-FP-(+)-DTBZ in man, we sought to validate the use of the kidney as reference region in a non human primate model. The overall significance of the ability to use a valid reference regions in PET studies is that measurements of arterial blood time activity curves are not needed to accurately asses pancreatic VMAT2 density.
We evaluated the use of the renal cortex or spleen as reference tissue by imaging Papio Ursinus with both enantiomers of 18F-FP-DTBZ as the (−) form has little affinity for VMAT2. Four baboons each underwent dynamic PET scanning of abdomen and brain after bolus injection of 80 MBq of either 18F-FP-(+)-DTBZ or 18F-FP-(−)-DTBZ. For a “gold standard” method of calculating VMAT2 densities in the pancreas, we also performed arterial sampling to obtain an HPLC-metabolite corrected input functions. The input function (i.e. the time activity curve of the parent radioligand in the plasma) and the time activity curve of the radioligand in the pancreas were then used to perform a kinetic analysis to estimate organ total distribution volumes (VT). The VMAT2 specific distribution volumes (BPP) was calculated using (+) and (−) pancreatic VT or (+) non pancreatic organ (renal cortex, spleen and cerebellum) VT. These experiments revealed that the binding of (−)FP-DTBZ in the pancreas was of similar magnitude to the binding of (+)FP-DTBZ in the kidney cortex (i.e. the candidate reference region undergoing validation), but, as expected, four fold less than the binding of (+) FP-DTBZ in the pancreas. Also, the cerebellum, an already validated VMAT2 negative reference region, and spleen [55] bound (+)FP-DTBZ with similar avidity as the binding of (−)FP-DTBZ in the pancreas. Together these results suggest that kidney maybe used as a reference region in studies of VMAT2 quantitation in the pancreas.
C. Good Test Retest Characteristics
We have tried to stress the opinion that PET based measurements of VMAT2 and the derived estimates of BCM will be more valuable if interpreted as changes in density or amounts, measures that will be derived, by necessity, from serial measurements performed during longitudinal studies. To better understand the potential utility of PET based VMAT2 quantitation as method to detect changes in BCM, we studied the test retest characteristics of the procedure using 18F-FP-(+)-DTBZ. As a first step, adult Lewis male rats (>12 weeks old, >360 gms body weight) underwent repeated 3 hr dynamic abdominal scans. The second scan was repeated within one month of the first. 18F-FP-(+)-DTBZ was labeled according to the method described previously [52]. A dose of 18–37 MBq (0.5–1 mCi) 18F-FP-(+)-DTBZ was injected via the penile vein. Images were reconstructed using 2D Fourier Back Projection and correction for attenuation. Following ROI definition, VMAT2 receptor densities were estimated using a Logan reference region analysis [56]. In these analyses, the kidney was used as a receptor-free region. VMAT2 densities in the pancreas ROI are reported as a distribution volume ratio (DVR) (Table 2). Also presented in Table 2 is a limited study performed in human subjects scanned with [11C] DTBZ. The reproducibility of the measurements were examined by calculation and comparisons of the bias [= 100×(retest − test)/test]. The variability was expressed as the standard deviation of the biases and the reliability was measured by calculation of the intraclass correlation coefficient, ICC [= (MSSBetween − MSSWithin)/(MSSBetween + MSSWithin), where MSSBetween is the mean sum of squares between subjects and MSSWithin is the mean sum of squares within subjects. An ICC score of close to 1 indicate that most variance is due to between-subject rather than within subject variance (good reliability), whereas values below zero imply greater within-subject than between-subject variance (poor reliability). The reliability of PET scanning measurements made with either ligand was good as judged by the magnitude of the ICC and variability. On the basis of the variability measurements, longitudinal changes in BP or DVR as measured with either probe [11C] (+) DTBZ or 18F-FP-(+)-DTBZ greater than 23 % (i.e. twice the variability of the measurement), respectively, have a 95% chance of reflecting biological or treatment differences.
Table 2.
Test Retest Characteristics of VMAT2 PET Scans
| Rodents scanned with 18F-FP-(+)-DTBZ | ||||
| Rodent ID | Test | Retest | % Change DVR | |
| 14F | 2 | 1.82 | 9.00 | |
| 14F | 1.82 | 2.2 | −20.88 | |
| 14F | 2.2 | 2 | 9.09 | |
| 1F1 | 2.8 | 2.9 | −3.57 | |
| 168 | 1.65 | 1.62 | 1.82 | |
| 1EA | 2.67 | 2.47 | 7.49 | |
| Mean % Change DVR (mean bias) | 0.49 | |||
| Variability | 11.58 | |||
| ICC | 0.89 | |||
| Humans scanned with [11C] DTBZ | ||||
| Subject ID | Test | Retest | % Change BP | |
| NHDTZB031 | 1.28 | 1.55 | −21.0938 | |
| NHDTZB030 | 2.56 | 2.37 | 7.421875 | |
| NHDTZB004 | 1.58 | 1.57 | 0.632911 | |
| NHDTZB006 | 2.12 | 2.31 | −8.96226 | |
| NHDTZB029 | 1.21 | 1.36 | −12.3967 | |
| Mean % Change BP (mean bias) | − 6.8 | |||
| Variability | 11 | |||
| ICC | 0.68 | |||
D. Less Sensitivity to the Monoamine Microenvironment
[11C]-DTBZ is a specific and high affinity (Kd =1 nM) ligand for VMAT2 and has been used primarily as a probe for studies of the integrity of striatal dopaminergic nerve terminal densities in neurodegenerative and psychiatric diseases[57–59]. While it has been well documented that the total numbers of VMAT2 in the striatum are not regulated by many pharmacological manipulations that affect the endogenous neurotransmitter systems (e.g. Haloperidol (acting at D2R), Paragylin, Diprenyl (acting at MAO), Levodopa-methyl-ester (acting at DOPA decarboxylase) [60–63], the effects of chronic drug challenges or pathological conditions which maintain altered vesicular dopamine (DA) levels and their effects on the measurement of VMAT2 have been less well-examined.
Following the development of 18F-FP-(+)-DTBZ, two papers relevant to PET based VMAT2 measurements were published that questioned VMAT2 measurements as a stable dopamine (DA) neuron biomarker [42], the findings of which paralleled those of a previous 2003 report [43]. This study demonstrated that in DOPA-responsive dystonia, a human neurological disorder resulting from the inability to synthesize DA, there was observed a 20% increase in [11C]DTBZ binding in select regions of the CNS. These authors concluded that the increased [11C]DTBZ binding reflected the greater accessibility of the radioligand to VMAT2 binding sites due to lack of competition from endogenous DA. Together these papers suggested that [11C] (+)DTBZ binding to VMAT2 might be sensitive to changes in vesicular DA storage levels. In these reports, it was found that there was increased [11C] (+)DTBZ binding (about 20%), but not in actual VMAT2 density, in instances of dopamine depletion (i.e. methamphetamine users and DOPA responsive dystonia).
Since DA is also an important regulator of insulin secretion [44, 45] and vesicular DA content might change during normal pancreatic function and particularly following long term chronic disease, we set out to determine the effects of depletion of pancreatic DA on binding of 18F-FP-(+)-DTBZ to β-cell VMAT2.
To examine the relationship between dopamine depletion and pancreatic VMAT2 - 18F-FP-(+)-DTBZ binding in vivo, we examined the effects of alpha methyl p- tyrosine (AMPT), a compound that competitively inhibits tyrosine hydroxlase and effects a depletion of tissue DA content. In islet β-cells, the combination of glucose and the sulfonylurea Tolbutamide, causes β-cell degranulation and the release of intragranular/vesicular insulin and DA. Since sulfonylureas are clinically important and have the potential to deplete pancreatic dopamine stores (particularly after chronic usage) because they induce DA containing vesicle exocytosis [64], we also studied the effects of tolbutamide on tissue dopamine content. Adult rats were administered either a saline control injection, AMPT or Tolbutamide and glucose twice a day for up to five days. At the end of the course of drugs, rodents were anesthetized and whole pancreas and brain harvested and snap frozen at −80 C. The next day tissue were processed for extraction of DA and PCR analysis of VMAT2 abundance. The DA content of the tissue was assayed by ELISA (Fig. 8). As expected, administration of AMPT reduced brain and pancreas DA content. Tolbutamide, also as expected, only reduced DA content in the pancreas. VMAT2 transcript abundance was unchanged by the drug treatment.
Fig. 8.
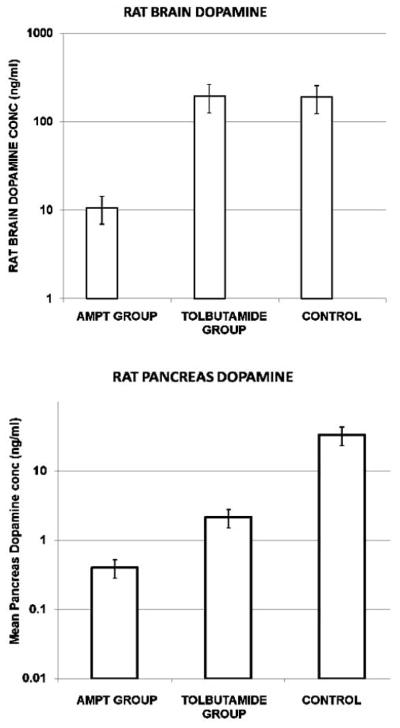
Dopamine tissue concentrations in saline and AMPT-treated rat brains and pancreata. Data are mean +/− S.E.M. for N = 6 animals.
Next, to determine whether tissue DA content influenced the binding of 18F-FP-(+)-DTBZ to VMAT2, we applied a serial imaging strategy. Rodents were imaged at baseline with 18F-FP-(+)-DTBZ and then again on the same day as the last drug injection. Using Students T testing, we found no statistically significant differences in the mean % change DVR in the dopamine depletion study (Table 3) compared to the test retest study (see Table 2), suggesting that the dopamine status in the pancreas does not affect 18F-FP-(+)-DTBZ binding to VMAT2 beyond the normal variability. A power analysis of the sample sizes used in this study indicated that there was at least an eighty percent chance to detect differences of 20% at 95% confidence interval. Although performed in different tissues, these preliminary results suggest that 18F-FP-(+)-DTBZ binding to VMAT2 is significantly less sensitive local dopamine levels than [11C]-(+)-DTBZ binding to VMAT2. This observation is consonant with the fact that 18F-FP-(+)-DTBZ has a greater binding affinity for VMAT2 (relative to DTBZ). This finding also represents another advantage for use of this ligand in the context of β-cell mass measurements.
Table 3.
Dopamine Depletion Study
| Average Pancreatic VMAT2 Density as DVR measured with 18F-FP-DTBZ | ||||
| Rodent ID | Baseline | AMPT | % Change in DVR | |
| 14F | 2 | 1.92 | 4.00 | |
| 15E | 1.97 | 2.11 | −7.11 | |
| 39C | 1.75 | 1.78 | −1.71 | |
| 3A8 | 2.1 | 2.5 | −19.05 | |
| 330 | 1.5 | 1.27 | 15.33 | |
| Mean % Change DVR | −1.71 | |||
| Variability | 12.77 | |||
E. Good Correlation of PET Based Pancreatic VMAT2 Measurements with other Standard Measures
A particularly important preclinical validation study is the determining the degree of correlation of BCM measurements made by PET with other standard measures of BCM in rodent models of diabetes. To this end, we repeated experiments in the streptozotocin (STZ) treated Lewis rat model similar to those previously described by us [7]. In past experiments, individual rodents were studied longitudinally, PET scanned and metabolically phenotyped at the initiation of the study and then again following induction of stable diabetes. In the current set of experiments, we studied the operating characteristics of the VMAT2 PET scans using a crossectional study design (i.e. groups of control and STZ treated rodents (Table 4). Since VMAT2 expression is mostly restricted to β-cells in the rat pancreas [44], in these experiments we also measured the abundance of pancreatic Insulin and VMAT2 mRNAs as a parallel measure of BCM. In these experiments, we were particularly attentive to the depth of diabetes induced in the rodents. STZ induced rat models of diabetes most frequently uses 65 mg/kg in a citrate vehicle. In our experiments, we used an alternate protocol were rats were fasted overnight and then given two STZ treatments (50 mg/Kg) given twice two days apart. Diabetes was diagnosed based on physiological and biochemical parameters. To be included in the study, rats must have had on three consecutive days a 6 hour fasting blood glucose level above 400 mg/dL, evidence of polyuria and polydypsia (>60 mL fluid intake over 24 h) and weight loss (>5 grams). Rodents were scanned once, either as group of controls or a group with diabetes, or serially once at baseline and again following induction of diabetes, followed by measurements of the abundance of mRNA for VMAT2 and Insulin (both transcripts) in the total pancreata harvested from control and STZ treated rats (Table 4). We found that there was good agreement between the reduction of VMAT2 (as measured by PET and expressed as a Binding Potential, BP) and the amounts of Insulin and VMAT2 measured by real time quantitative PCR, further corroborating the validity of the use of VMAT2 as a biomarker for BCM [7, 16–19, 37, 65–69]. Of interest, however, is the observation that not all VMAT2 transcripts detected in the pancreas were sensitive to ablation by high doses of STZ, suggesting the presence of “off target” non beta cell associated VMAT2 in the rat.
Table 4.
Crossectional Association of VMAT2 Measurements by PET, by Real Time Quantitative PCR and Insulin Measurements
| Control | STZ Treated | Mean % Change | ||||||||||
|---|---|---|---|---|---|---|---|---|---|---|---|---|
| Blood Glucose | mRNA Copy Number | VMAT2 by PET as BP | Blood Glucose | mRNA Copy Number | VMAT2 by PET as BP | mRNA Copy Number | VMAT2 by PET as BP | |||||
| mg/dL | Ins | VMAT2 | mg/dL | Ins | VMAT2 | Ins | VMAT2 | |||||
| Cross Sectional Study | ||||||||||||
| Lewis Rats | Mean | 97 | 1.62 | 433 | 0.31 | 81 | ||||||
| SD | 16 | 1.11 | 55 | 0.38 | ||||||||
| SEM | 3.6 | 0.26 | 18 | 0.13 | ||||||||
| n | 19 | 19 | 9 | 9 | ||||||||
| Cross Sectional Study | Control | STZ Treated | ||||||||||
| Lewis Rats | Mean | 96 | 7.6E+09 | 2.9E+06 | 482 | 4.4E+07 | 4.8E+05 | 99 | 83 | |||
| SD | 11 | 4.2E+09 | 1.7E+06 | 23 | 5.4E+07 | 5.1E+05 | ||||||
| SEM | 10 | 1.4E+11 | 5.6E+05 | 10 | 1.6E+07 | 1.5E+05 | ||||||
| n | 9 | 9 | 9 | 12 | 12 | 12 | ||||||
| Longitudinal Study | Baseline | STZ Treated | ||||||||||
| Lewis Rodent ID | Group Mean | 92 | ||||||||||
| 19A | 98 | 2.63 | 490 | 1.1 | 94 | |||||||
| 148 | 101 | 4.96 | 419 | 1.01 | 100 | |||||||
| 181 | 87 | 1.78 | 437 | 1.11 | 86 | |||||||
| 206 | 94 | 1.74 | 528 | 1.09 | 88 | |||||||
NEXT STEPS IN IMAGING B-CELL MASS WITH VMAT2 LIGANDS
Based on the preclinical data we obtained using 18F-FP-(+)-DTBZ to image and quantitate VMAT2, we are now repeating the crossectional study of healthy control subjects and patients with long term type 1 diabetes, this time using 18F-FP-(+)-DTBZ. In addition, we will use a 64 slice PET/CT instrument plan to collect CT based anatomical data of the abdomen for ROI placement in register with the dynamic PET scan data. In this study we will collect arterial blood for calculating an input function and making VMAT2 measurements based on kinetic models of radioligand uptake as well reference tissue measurements of radioligand uptake. Once complete, these studies will be immediately followed by test and retest studies and a longitudinal study of patients with new onset type 1 diabetes. This latter study represents the only real necessary and sufficient validation hurdle for VMAT2 based PET measurements of β-cell mass. If these serial imaging studies reveal significant decay in pancreatic VMAT2 content that parallels loss of β ell function as measured by biochemical/ metabolic methods, we will have achieved an important milestone in developing this method. It is important to note that these studies are likely to be (should be!) much simpler to interpret than the previous cross-sectional studies where pancreas atrophy in the longstanding type I diabetes population was probably a major confounding factor. This longitudinal study is expected to run two to three years to fully allow for expected decay in β-cell function accompanying autoimmune destruction of the β component of the endocrine pancreas.
NOVEL VMAT2 PROBES AND NOVEL APPLICATIONS
The development of novels probes to image VMAT2 will continue to driven by simple economics, the need for ever more sensitive VMAT2 measurements and the importance of VMAT2 as a drug target. For example, 18F-FP-(+)-DTBZ development was in great part driven by logistic difficulties associated with [11C] based radioligands[52, 53]. The improved VMAT2 binding characteristics displayed by 18F-FP-(+)-DTBZ and lower non specific binding in the reference tissues were only appreciated after successful synthesis of the compound. In general the synthesis of new DTBZ derivatives will likely proceed with the following goals in mind; a) continue to reduce ligand non specific binding in reference tissues, b) maintain ligand affinity for VMAT2 at high levels and c) minimize ligand defluorination and unwanted metabolites. Recently Kung et al reported on two new DTBZ ligand based ligands, a DTBZ analog containing an epoxide ring at the C2 position of the TBZ core structure [17] and an N-fluoroalkyl substituted amino-DTBZ ligand [70]. Both ligands were reported to be less lipophilic than the parent DTBZ compound. The epoxide-DTBZ compounds displayed similar binding affinities to VMAT2 as the 18F-FP-(+)-DTBZ. The amino DTBZ compound however displayed less VMAT2 binding affinity relative to DTBZ so it not yet known whether this reagent will be useful for β-cell imaging.
With the similar goals in mind (i.e reducing the lipophilicity/ increase polarity of DTBZ) to reduce penetration of compound into the blood brain barrier, we set out to develop a new class of TBZ derivatives that might show the hypoglycemia inducing - antidiabetic effects of inhibitors of VMAT2 [44]. In these studies we developed a novel series of dihydropyridones with comparable VMAT2 binding affinities [44] showing the in vivo hypoglycemic effect. In addition, preliminary studies show that some of these compounds readily displace [11C] (+) DTBZ binding in the pancreas, although are some indications that the kinetics of pancreatic uptake is slower. This novel class of compounds awaits direct [11C] labeling for study of binding to VMAT2 in β-cells and in pancreata in vivo. It is likely that this family of compounds represents yet another future generation of VMAT2 imaging probes.
Similarly exciting is the class of Fluorescent False Neurotransmitters (FFNs) developed by Sames et al. [71] for the study of synaptic transmission (Fig. 9). Here optical tracers of monoamine neurotransmitters, or fluorescent false neurotransmitters (FFNs), were designed based on the structure functional properties of phenyl-ethylamines (e.g. vesicular uptake and discharge) and fluorogeneic MAO probes [72]. The currently generation of FFN show VMAT2 binding affinities in the 1 μM range, a value close to dopamine itself. Preliminary data shows that these compounds can be labelled with 18F for PET studies as well as be used to track vesicular monoamine uptake in β-cell lines by optical methods.
Fig. 9.

Structures for compounds discussed in article.
PET scan measurements of VMAT2 need not be restricted to β-cell in situ. Recently, using [11C] (+) DTBZ we demonstrated that VMAT2 quantitation could also subserve experimental rodent islet transplantation In these studies, Witkowski et al. [18] showed that syngeneic rodent islet transplants reversed diabetes when grafted in a novel retromuscular position instead of the traditional intrahepatic site. Successful isografting however only occurred if the retromuscular transplant site had been pretreated with angiogenic growth factors. In these studies PET scans with using [11C] (+) DTBZ showed not only the novel retromuscular islet transplant site but could also be used to quantitate the residual islet cell mass in the diabetic rodents. Since cell therapy and transplantation of cadaveric islets or engineered β-cells represent very realistic potential cures to type 1 and type 2 diabetes, the ability to non invasively quantitate these cells by VMAT2 may represent a useful tool in the development of cell therapy as a cure for diabetes or in management of cell transplants.
FUTURE PERSPECTIVES
While we have made much progress in understanding VMAT2 biology in the context of its use as a biomarker of β-cells, the feasibility of obtaining clinically useful human BCM measurements by PET scanning with VMAT2 ligands remains unproven. Following our first human study clinical study we identified a series of problems that more or less forced our attention back into preclinical/animal studies. Most recently we have reemerged from laboratory and are ready to begin human trials with a fresh set of tools and perspectives. The ability to switch focus from cell membranes to human clinical studies (and all steps in-between) and back again may be prerequisite to developing imaging of new diabetes biomarkers. This iterative approach certainly represents a road that many PET researchers, developing new ligands for the study of the CNS, have already taken. Our current experience in imaging the pancreas also establishes that there is still a great wealth of experience to be drawn from the “brain imagers” and applied to imaging the pancreas. PET imaging in the abdomen itself is a relatively unexplored field and we are continually challenged to develop new methods to obtain more accurate PET measurements. As we approach technical competence in making these measurements, other questions regarding β-cell biology will probably become more and more relevant. For example, historically, β-cell mass measurement made by histological methods take weeks to months to complete. If VMAT2 PET scanning is validated for making BCM measurements, it will become possible to gather BCM measurements in large populations quite rapidly. Such information may prove valuable towards understanding the biological basis of variability in β-cell mass that appears to be present in the human population, help us better understand progression of type II diabetic disease as well as manage the therapy patients with established disease. At present, the current understanding of normal and pathologic β-cell biology and specific imaging technical limitations, will limit us to making measurements of changes in β-cell mass. Hopefully such data, when it becomes available, will live up to the expectations and needs of diabetologists and patients who have waited for them so long.
Acknowledgments
This work was supported by the JDRF (37-2009-54) and the PHS, NIH, NIDDK (R01 DK063567, RO1 DK077493). One author (P.E.H.) has a potential duality of interest as a patent holder in the field reviewed by this article.
References
References 73–75 are related articles recently published.
- 1.BDW Group. Biomarkers and surrogate endpoints: preferred definitions and conceptual framework. Clin Pharmacol Ther. 2001;69:89–95. doi: 10.1067/mcp.2001.113989. [DOI] [PubMed] [Google Scholar]
- 2.http://www.cancer.gov/dictionary/?CdrID=45618.
- 3.Gepts W. Pathologic anatomy of the pancreas in juvenile diabetes mellitus. Diabetes. 1965;14:619–33. doi: 10.2337/diab.14.10.619. [DOI] [PubMed] [Google Scholar]
- 4.Gepts W, Lecompte PM. The pancreatic islets in diabetes. Am J Med. 1981;70:105–15. doi: 10.1016/0002-9343(81)90417-4. [DOI] [PubMed] [Google Scholar]
- 5.Saito K, Yaginuma N, Takahashi T. Differential volumetry of A, B and D cells in the pancreatic islets of diabetic and nondiabetic subjects. Tohoku J Exp Med. 1979;129:273–83. doi: 10.1620/tjem.129.273. [DOI] [PubMed] [Google Scholar]
- 6.Shi ZD, Wu H, Ruddy B, Griffiths GL. Imaging probe development center: a national institutes of health core synthesis resource for imaging probes. J Biomed Opt. 2007;12:051502. doi: 10.1117/1.2778702. [DOI] [PubMed] [Google Scholar]
- 7.Simpson NR, Souza F, Witkowski P, Maffei A, Raffo A, Herron A, et al. Visualizing pancreatic beta-cell mass with [11C]DTBZ. Nucl Med Biol. 2006;33:855–64. doi: 10.1016/j.nucmedbio.2006.07.002. [DOI] [PMC free article] [PubMed] [Google Scholar]
- 8.Sundsten T, Ortsater H. Proteomics in diabetes research. Mol Cell Endocrinol. 2009;297:93–103. doi: 10.1016/j.mce.2008.06.018. [DOI] [PubMed] [Google Scholar]
- 9.Ueberberg S, Meier JJ, Waengler C, Schechinger W, Dietrich JW, Tannapfel A, et al. Generation of novel single-chain antibodies by phage-display technology to direct imaging agents highly selective to pancreatic {beta}- or {alpha}-cells in vivo. Diabetes. 2009;58(10):2324–34. doi: 10.2337/db09-0658. [DOI] [PMC free article] [PubMed] [Google Scholar]
- 10.Wenzlau JM, Frisch LM, Gardner TJ, Sarkar S, Hutton JC, Davidson HW. Novel antigens in type 1 diabetes: the importance of ZnT8. Curr Diab Rep. 2009;9:105–12. doi: 10.1007/s11892-009-0019-4. [DOI] [PubMed] [Google Scholar]
- 11.Samli KN, McGuire MJ, Newgard CB, Johnston SA, Brown KC. Peptide-mediated targeting of the islets of Langerhans. Diabetes. 2005;54:2103–8. doi: 10.2337/diabetes.54.7.2103. [DOI] [PubMed] [Google Scholar]
- 12.Kutlu B, Burdick D, Baxter D, Rasschaert J, Flamez D, Eizirik DL, et al. Detailed transcriptome atlas of the pancreatic beta cell. BMC Med Genomics. 2009;2:3. doi: 10.1186/1755-8794-2-3. [DOI] [PMC free article] [PubMed] [Google Scholar]
- 13.Quayum N, Kutchma A, Sarkar SA, Juhl K, Gradwohl G, Mellitzer G, et al. GeneSpeed beta cell: an online genomics data repository and analysis resource tailored for the islet cell biologist. Exp Diabetes Res. 2008;2008:312060. doi: 10.1155/2008/312060. [DOI] [PMC free article] [PubMed] [Google Scholar]
- 14.Jongeneel CV, Delorenzi M, Iseli C, Zhou D, Haudenschild CD, Khrebtukova I, et al. An atlas of human gene expression from massively parallel signature sequencing (MPSS) Genome Res. 2005;15:1007–14. doi: 10.1101/gr.4041005. [DOI] [PMC free article] [PubMed] [Google Scholar]
- 15.Maffei A, Liu Z, Witkowski P, Moschella F, Del Pozzo G, Liu E, et al. Identification of tissue-restricted transcripts in human islets. Endocrinology. 2004;145:4513–21. doi: 10.1210/en.2004-0691. [DOI] [PubMed] [Google Scholar]
- 16.Goland R, Freeby M, Parsey R, Saisho Y, Kumar D, Simpson N, et al. 11C-dihydrotetrabenazine PET of the pancreas in subjects with long-standing type 1 diabetes and in healthy controls. J Nucl Med. 2009;50:382–9. doi: 10.2967/jnumed.108.054866. [DOI] [PMC free article] [PubMed] [Google Scholar]
- 17.Kung HF, Lieberman BP, Zhuang ZP, Oya S, Kung MP, Choi SR, et al. In vivo imaging of vesicular monoamine transporter 2 in pancreas using an (18)F epoxide derivative of tetrabenazine. Nucl Med Biol. 2008;35:825–37. doi: 10.1016/j.nucmedbio.2008.08.004. [DOI] [PMC free article] [PubMed] [Google Scholar]
- 18.Witkowski P, Sondermeijer H, Hardy M, Woodland D, Lee K, Bhagat G, et al. Islet grafting and imaging in a bioengineered intramuscular space. Transplantation. 2009;88(9):1065–74. doi: 10.1097/TP.0b013e3181ba2e87. [DOI] [PMC free article] [PubMed] [Google Scholar]
- 19.Singhal T, Labaree D, Ropchan J, Nabulsi N, Weinzimmer D, Treadway J, et al. Evaluation of [C-11]DTBZ-PET for estimation of pancreatic beta cell mass (BCM) in a rat model of diabetes. J Nucl Med. 2008;49 (Suppl 1):317. [Google Scholar]
- 20.Meier JJ, Butler AE, Saisho Y, Monchamp T, Galasso R, Bhushan A, et al. Beta-cell replication is the primary mechanism subserving the postnatal expansion of beta-cell mass in humans. Diabetes. 2008;57:1584–94. doi: 10.2337/db07-1369. [DOI] [PMC free article] [PubMed] [Google Scholar]
- 21.Atouf F, Czernichow P, Scharfmann R. Expression of neuronal traits in pancreatic beta cells. Implication of neuron-restrictive silencing factor/repressor element silencing transcription factor, a neuron-restrictive silencer. J Biol Chem. 1997;272:1929–34. doi: 10.1074/jbc.272.3.1929. [DOI] [PubMed] [Google Scholar]
- 22.Bernal-Mizrachi E, Cras-Meneur C, Ohsugi M, Permutt MA. Gene expression profiling in islet biology and diabetes research. Diabetes Metab Res Rev. 2003;19:32–42. doi: 10.1002/dmrr.331. [DOI] [PubMed] [Google Scholar]
- 23.Weihe E, Eiden LE. Chemical neuroanatomy of the vesicular amine transporters. FASEB J. 2000;14:2435–49. doi: 10.1096/fj.00-0202rev. [DOI] [PubMed] [Google Scholar]
- 24.Weihe E, Schafer MK, Erickson JD, Eiden LE. Localization of vesicular monoamine transporter isoforms (VMAT1 and VMAT2) to endocrine cells and neurons in rat. J Mol Neurosci. 1994;5:149–64. doi: 10.1007/BF02736730. [DOI] [PubMed] [Google Scholar]
- 25.Erickson JD, Schafer MK, Bonner TI, Eiden LE, Weihe E. Distinct pharmacological properties and distribution in neurons and endocrine cells of two isoforms of the human vesicular monoamine transporter. Proc Natl Acad Sci USA. 1996;93:5166–71. doi: 10.1073/pnas.93.10.5166. [DOI] [PMC free article] [PubMed] [Google Scholar]
- 26.Ahren B. Autonomic regulation of islet hormone secretion--implications for health and disease. Diabetologia. 2000;43:393–410. doi: 10.1007/s001250051322. [DOI] [PubMed] [Google Scholar]
- 27.Anlauf M, Eissele R, Schafer MK, Eiden LE, Arnold R, Pauser U, et al. Expression of the two isoforms of the vesicular monoamine transporter (VMAT1 and VMAT2) in the endocrine pancreas and pancreatic endocrine tumors. J Histochem Cytochem. 2003;51:1027–40. doi: 10.1177/002215540305100806. [DOI] [PubMed] [Google Scholar]
- 28.Saisho Y, Harris PE, Butler AE, Galasso R, Gurlo T, Rizza RA, et al. Relationship between pancreatic vesicular monoamine transporter 2 (VMAT2) and insulin expression in human pancreas. J Mol Histol. 2008;39:543–51. doi: 10.1007/s10735-008-9195-9. [DOI] [PMC free article] [PubMed] [Google Scholar]
- 29.Baetens D, De Mey J, Gepts W. Immunohistochemical and ultrastructural identification of the pancreatic polypeptide-producing cell (PP-cell) in the human pancreas. Cell Tissue Res. 1977;185:239–46. doi: 10.1007/BF00220668. [DOI] [PubMed] [Google Scholar]
- 30.Rahier J, Wallon J, Gepts W, Haot J. Localization of pancreatic polypeptide cells in a limited lobe of the human neonate pancreas: remnant of the ventral primordium? Cell Tissue Res. 1979;200:359–66. doi: 10.1007/BF00234848. [DOI] [PubMed] [Google Scholar]
- 31.Rahier J, Wallon J, Loozen S, Lefevre A, Gepts W, Haot J. The pancreatic polypeptide cells in the human pancreas: the effects of age and diabetes. J Clin Endocrinol Metab. 1983;56:441–4. doi: 10.1210/jcem-56-3-441. [DOI] [PubMed] [Google Scholar]
- 32.Baetens D, Malaisse-Lagae F, Perrelet A, Orci L. Endocrine pancreas: three-dimensional reconstruction shows two types of islets of langerhans. Science. 1979;206:1323–5. doi: 10.1126/science.390711. [DOI] [PubMed] [Google Scholar]
- 33.Herrera PL. Defining the cell lineages of the islets of Langerhans using transgenic mice. Int J Dev Biol. 2002;46:97–103. [PubMed] [Google Scholar]
- 34.Delghingaro-Augusto V, Nolan CJ, Gupta D, Jetton TL, Latour MG, Peshavaria M, et al. Islet beta cell failure in the 60% pancreatectomised obese hyperlipidaemic Zucker fatty rat: severe dysfunction with altered glycerolipid metabolism without steatosis or a falling beta cell mass. Diabetologia. 2009;52:1122–32. doi: 10.1007/s00125-009-1317-8. [DOI] [PubMed] [Google Scholar]
- 35.Goodison S, Kenna S, Ashcroft SJ. Control of insulin gene expression by glucose. Biochem J. 1992;285 ( Pt 2):563–8. doi: 10.1042/bj2850563. [DOI] [PMC free article] [PubMed] [Google Scholar]
- 36.Wang H, Kouri G, Wollheim CB. ER stress and SREBP-1 activation are implicated in beta-cell glucolipotoxicity. J Cell Sci. 2005;118:3905–15. doi: 10.1242/jcs.02513. [DOI] [PubMed] [Google Scholar]
- 37.Freeby M, Goland R, Ichise M, Maffei A, Leibel R, Harris P. VMAT2 quantitation by PET as a biomarker for beta-cell mass in health and disease. Diabetes Obes Metab. 2008;10 (Suppl 4):98–108. doi: 10.1111/j.1463-1326.2008.00943.x. [DOI] [PubMed] [Google Scholar]
- 38.Poitout V, Hagman D, Stein R, Artner I, Robertson RP, Harmon JS. Regulation of the insulin gene by glucose and fatty acids. J Nutr. 2006;136:873–6. doi: 10.1093/jn/136.4.873. [DOI] [PMC free article] [PubMed] [Google Scholar]
- 39.Bacha F, Gungor N, Arslanian SA. Measures of beta-cell function during the oral glucose tolerance test, liquid mixed-meal test, and hyperglycemic clamp test. J Pediatr. 2008;152:618–21. doi: 10.1016/j.jpeds.2007.11.044. [DOI] [PMC free article] [PubMed] [Google Scholar]
- 40.Liu E, Herscovitch P, Barker C, Harlan D. C-11-DTBZ PET scanning: its potential for measuring beta-cell mass in vivo. Diabetes. 2007:A83–3. [Google Scholar]
- 41.Williams AJ, Chau W, Callaway MP, Dayan CM. Magnetic resonance imaging: a reliable method for measuring pancreatic volume in Type 1 diabetes. Diabet Med. 2007;24:35–40. doi: 10.1111/j.1464-5491.2007.02027.x. [DOI] [PubMed] [Google Scholar]
- 42.Boileau I, Rusjan P, Houle S, Wilkins D, Tong J, Selby P, et al. Increased vesicular monoamine transporter binding during early abstinence in human methamphetamine users: Is VMAT2 a stable dopamine neuron biomarker? J Neurosci. 2008;28:9850–6. doi: 10.1523/JNEUROSCI.3008-08.2008. [DOI] [PMC free article] [PubMed] [Google Scholar]
- 43.De La Fuente-Fernandez R, Furtado S, Guttman M, Furukawa Y, Lee CS, Calne DB, et al. VMAT2 binding is elevated in dopa-responsive dystonia: visualizing empty vesicles by PET. Synapse. 2003;49:20–8. doi: 10.1002/syn.10199. [DOI] [PubMed] [Google Scholar]
- 44.Raffo A, Hancock K, Polito T, Xie Y, Andan G, Witkowski P, et al. Role of vesicular monoamine transporter type 2 in rodent insulin secretion and glucose metabolism revealed by its specific antagonist tetrabenazine. J Endocrinol. 2008;198:41–9. doi: 10.1677/JOE-07-0632. [DOI] [PMC free article] [PubMed] [Google Scholar]
- 45.Rubi B, Ljubicic S, Pournourmohammadi S, Carobbio S, Armanet M, Bartley C, et al. Dopamine D2-like receptors are expressed in pancreatic beta cells and mediate inhibition of insulin secretion. J Biol Chem. 2005;280:36824–32. doi: 10.1074/jbc.M505560200. [DOI] [PubMed] [Google Scholar]
- 46.Cselenyi Z, Olsson H, Halldin C, Gulyas B, Farde L. A comparison of recent parametric neuroreceptor mapping approaches based on measurements with the high affinity PET radioligands [11C]FLB 457 and [11C]way 100635. Neuroimage. 2006;32:1690–708. doi: 10.1016/j.neuroimage.2006.02.053. [DOI] [PubMed] [Google Scholar]
- 47.Kim J, Cai W, Feng D, Eberl S. Segmentation of VOI from multidimensional dynamic PET images by integrating spatial and temporal features. IEEE Trans Inf Technol Biomed. 2006;10:637–46. doi: 10.1109/titb.2006.874192. [DOI] [PubMed] [Google Scholar]
- 48.Guo H, Renaut R, Chen K, Reiman E. Clustering huge data sets for parametric PET imaging. Biosystems. 2003;71:81–92. doi: 10.1016/s0303-2647(03)00112-6. [DOI] [PubMed] [Google Scholar]
- 49.Pick A, Clark J, Kubstrup C, Levisetti M, Pugh W, Bonner-Weir S, et al. Role of apoptosis in failure of beta-cell mass compensation for insulin resistance and beta-cell defects in the male Zucker diabetic fatty rat. Diabetes. 1998;47:358–64. doi: 10.2337/diabetes.47.3.358. [DOI] [PubMed] [Google Scholar]
- 50.Inuwa IM, El Mardi AS. Correlation between volume fraction and volume-weighted mean volume, and between total number and total mass of islets in post-weaning and young Wistar rats. J Anat. 2005;206:185–92. doi: 10.1111/j.1469-7580.2005.00367.x. [DOI] [PMC free article] [PubMed] [Google Scholar]
- 51.Glatt CE, Wahner AD, White DJ, Ruiz-Linares A, Ritz B. Gain-of-function haplotypes in the vesicular monoamine transporter promoter are protective for Parkinson disease in women. Hum Mol Genet. 2006;15:299–305. doi: 10.1093/hmg/ddi445. [DOI] [PMC free article] [PubMed] [Google Scholar]
- 52.Goswami R, Ponde DE, Kung MP, Hou C, Kilbourn MR, Kung HF. Fluoroalkyl derivatives of dihydrotetrabenazine as positron emission tomography imaging agents targeting vesicular monoamine transporters. Nucl Med Biol. 2006;33:685–94. doi: 10.1016/j.nucmedbio.2006.05.006. [DOI] [PubMed] [Google Scholar]
- 53.Kilbourn MR, Hockley B, Lee L, Hou C, Goswami R, Ponde DE, et al. Pharmacokinetics of [(18)F]fluoroalkyl derivatives of dihydrotetrabenazine in rat and monkey brain. Nucl Med Biol. 2007;34:233–7. doi: 10.1016/j.nucmedbio.2007.01.007. [DOI] [PMC free article] [PubMed] [Google Scholar]
- 54.Kung M, Lieberman B, Hou C, Ponde D, Goswami R, Skovronsky D, Deng S, et al. F-18(+)FP-DTBZ: An investigational PET ligand for measuring beta cell mass in the pancreas. J Nucl Med. 2007;48:114. [Google Scholar]
- 55.Koeppe RA, Frey KA, Kuhl DE, Kilbourn MR. Assessment of extrastriatal vesicular monoamine transporter binding site density using stereoisomers of [11C]dihydrotetrabenazine. J Cereb Blood Flow Metab. 1999;19:1376–84. doi: 10.1097/00004647-199912000-00011. [DOI] [PubMed] [Google Scholar]
- 56.Logan J. Graphical analysis of PET data applied to reversible and irreversible tracers. Nucl Med Biol. 2000;27:661–70. doi: 10.1016/s0969-8051(00)00137-2. [DOI] [PubMed] [Google Scholar]
- 57.Albin RL, Koeppe RA, Bohnen NI, Nichols TE, Meyer P, Wernette K, et al. Increased ventral striatal monoaminergic innervation in Tourette syndrome. Neurology. 2003;61:310–5. doi: 10.1212/01.wnl.0000076181.39162.fc. [DOI] [PubMed] [Google Scholar]
- 58.Bohnen NI, Albin RL, Koeppe RA, Wernette KA, Kilbourn MR, Minoshima S, et al. Positron emission tomography of monoaminergic vesicular binding in aging and Parkinson disease. J Cereb Blood Flow Metab. 2006;26:1198–212. doi: 10.1038/sj.jcbfm.9600276. [DOI] [PubMed] [Google Scholar]
- 59.Bohnen NI, Koeppe RA, Meyer P, Ficaro E, Wernette K, Kilbourn MR, et al. Decreased striatal monoaminergic terminals in Huntington disease. Neurology. 2000;54:1753–9. doi: 10.1212/wnl.54.9.1753. [DOI] [PubMed] [Google Scholar]
- 60.Kilbourn MR, Frey KA, Vander Borght T, Sherman PS. Effects of dopaminergic drug treatments on in vivo radioligand binding to brain vesicular monoamine transporters. Nucl Med Biol. 1996;23:467–71. doi: 10.1016/0969-8051(96)00023-6. [DOI] [PubMed] [Google Scholar]
- 61.Vander Borght T, Kilbourn M, Desmond T, Kuhl D, Frey K. The vesicular monoamine transporter is not regulated by dopaminergic drug treatments. Eur J Pharmacol. 1995;294:577–83. doi: 10.1016/0014-2999(95)00594-3. [DOI] [PubMed] [Google Scholar]
- 62.Vilpoux C, Leroux-Nicollet I, Naudon L, Raisman-Vozari R, Costentin J. Reserpine or chronic paroxetine treatments do not modify the vesicular monoamine transporter 2 expression in serotonin-containing regions of the rat brain. Neuropharmacology. 2000;39:1075–82. doi: 10.1016/s0028-3908(99)00210-5. [DOI] [PubMed] [Google Scholar]
- 63.Wilson JM, Kish SJ. The vesicular monoamine transporter, in contrast to the dopamine transporter, is not altered by chronic cocaine self-administration in the rat. J Neurosci. 1996;16:3507–10. doi: 10.1523/JNEUROSCI.16-10-03507.1996. [DOI] [PMC free article] [PubMed] [Google Scholar]
- 64.Barg S. Mechanisms of exocytosis in insulin-secreting B-cells and glucagon-secreting A-cells. Pharmacol Toxicol. 2003;92:3–13. doi: 10.1034/j.1600-0773.2003.920102.x. [DOI] [PubMed] [Google Scholar]
- 65.Cline G, Carson RE, Ding YS, Huang H, Weinzimmer DP, Jakoski A, et al. Islet-selectivity of G-protein coupled receptor (GPCR) ligands evaluated for PET imaging. Diabetes. 2008;58 (Suppl):156. [Google Scholar]
- 66.Xie Y, Raffo A, Ichise M, Deng S, Harris PE, Landry DW. Novel hypoglycemic dihydropyridones serendipitously discovered from O- versus C-alkylation in the synthesis of VMAT2 antagonists. Bioorg Med Chem Lett. 2008;18:5111–4. doi: 10.1016/j.bmcl.2008.07.129. [DOI] [PMC free article] [PubMed] [Google Scholar]
- 67.Harris PE, Ferrara C, Barba P, Polito T, Freeby M, Maffei A. VMAT2 gene expression and function as it applies to imaging beta-cell mass. J Mol Med. 2008;86:5–16. doi: 10.1007/s00109-007-0242-x. [DOI] [PubMed] [Google Scholar]
- 68.Murthy R, Harris P, Simpson N, Van Heertum R, Leibel R, Mann JJ, et al. Whole body [(11)C]-dihydrotetrabenazine imaging of baboons: biodistribution and human radiation dosimetry estimates. Eur J Nucl Med Mol Imaging. 2008;35(4):790–7. doi: 10.1007/s00259-007-0648-2. [DOI] [PubMed] [Google Scholar]
- 69.Inabnet WB, 3rd, Milone L, Korner J, Durak E, Ahmed L, Pomrantz J, et al. A rodent model of metabolic surgery for study of type 2 diabetes and positron emission tomography scanning of beta cell mass. Surg Obes Relat Dis. 2009;5:212–7. doi: 10.1016/j.soard.2008.09.007. [DOI] [PMC free article] [PubMed] [Google Scholar]
- 70.Zhu L, Liu J, Kung HF. Synthesis and evaluation of 2-amino-dihydrotetrabenzine derivatives as probes for imaging vesicular monoamine transporter-2. Bioorg Med Chem Lett. 2009;19:5026–8. doi: 10.1016/j.bmcl.2009.07.048. [DOI] [PubMed] [Google Scholar]
- 71.Gubernator NG, Zhang H, Staal RG, Mosharov EV, Pereira DB, Yue M, et al. Fluorescent false neurotransmitters visualize dopamine release from individual presynaptic terminals. Science. 2009;324:1441–4. doi: 10.1126/science.1172278. [DOI] [PMC free article] [PubMed] [Google Scholar]
- 72.Chen G, Yee DJ, Gubernator NG, Sames D. Design of optical switches as metabolic indicators: new fluorogenic probes for monoamine oxidases (MAO A and B) J Am Chem Soc. 2005;127:4544–5. doi: 10.1021/ja0428457. [DOI] [PubMed] [Google Scholar]
- 73.Huber JD. Diabetes, cognitive function, and the blood-brain barrier. Curr Pharm Des. 2008;14(16):1594–600. doi: 10.2174/138161208784705441. [DOI] [PubMed] [Google Scholar]
- 74.Penberthy WT. Nicotinamide adenine dinucleotide biology and disease. Curr Pharm Des. 2009;15(1):1–2. doi: 10.2174/138161209787185779. [DOI] [PubMed] [Google Scholar]
- 75.Thompson CS. Animal models of diabetes mellitus: relevance to vascular complications. Curr Pharm Des. 2008;14(4):309–24. doi: 10.2174/138161208783497679. [DOI] [PubMed] [Google Scholar]