Abstract
Symptoms in Parkinson’s disease (PD) have been linked to oscillatory activity within the basal ganglia. In humans, such activity has been detected mainly in the local field potentials (LFPs) recorded from electrode contacts used for deep brain stimulation. Although most studies have focused on activity within the subthalamic nucleus (STN), the internal part of the globus pallidus (GPi) is considered an equally efficacious site for therapeutic neuromodulation. Moreover, while most investigations have evaluated changes in oscillatory activity in the beta (12–35 Hz) and gamma (35–100 Hz) bands, our preliminary spectral analysis of LFP signals in the GPi suggested distinct activity at higher frequencies as well. We hypothesized there is a unique LFP signature in the GPi that consists of movement modulated spectral power increases above 100Hz. Using invasive recordings from the GPi of patients undergoing DBS, in addition to confirming increased beta band activity within the GPi of patients with PD, we have identified and characterized a previously undescribed peak between 200–300 Hz centered at approximately 235 Hz, whose height and width but not center frequency are movement modulated. An increase in peak height is not transient, but rather persists for the duration of movement. The 200–300 Hz rhythms in the GPi could have a functional role in the basal ganglia reentrant circuits by encoding output information entering the thalamo-cortical network or by organizing downstream activity for the successful execution of tasks.
Keywords: Parkinson’s Disease, Globus Pallidus, Basal Ganglia, Oscillatory Activity, Power Spectrum, Pathophysiology
Introduction
Basal ganglia (BG) dysfunction has been implicated in the motor signs of Parkinson’s disease (PD) in humans (Brown et al., 2001; Doyle et al., 2005; Dejean et al., 2008), animal models (Burkhardt et al., 2007; Cruz et al., 2009) and computational studies (Berns and Sejnowski, 1998; Frank, 2006; Humphries et al., 2006; Kang and Lowery, 2009; Noori and Jager, 2010). The pathoetiology of the disease is attributed to dopaminergic (DA) denervation of BG due to neuronal loss within the substantia nigra. At the systems level, a mechanistic explanation that links BG functionality to motor behavior remains elusive. While oscillations in the β band in the cortico-basal ganglia thalamo-cortical reentrant circuits correlate with parkinsonian symptoms (Dostrovsky and Bergman, 2004; Brown, 2007), it is not known whether the synchronized bursting of neuronal populations in the BG is the primary cause of motor dysfunction or simply an epiphenomenon of the disease (Eusebio and Brown, 2009).
Recordings from BG structures of patients are afforded by electrode contacts on deep brain stimulation (DBS) leads implanted for therapeutic purposes (Kumar et al., 1998; Lopiano et al., 2001) or the microelectrodes used during stereotactic surgery to confirm the target BG nuclei (Chu et al., 2006). The former provide local field potentials (LFPs) representing ensemble neuronal activity over a volume of tissue, with enhanced oscillatory activity represented as increases in the spectral power of LFP. In the DA depleted state, abnormal oscillations in the BG have primarily been reported as increases in β power (13–30Hz) (Ray et al., 2008; Mallet et al., 2008). It has been proposed that these synchronized oscillations within and between BG structures might interfere with the basal ganglia’s proposed role in selectively activating neuronal processes that are relevant to a proposed task and attenuating others (McAuley, 2003). The DA replete state, conversely, has been associated with increased γ-band power at ~70 Hz (Brown et al., 2001). Specifically, increased γ-band power has been found to be coincident with motor tasks (Brown, 2000; Masimore et al., 2005) and therefore considered “pro-kinetic.”
Very high gamma-band activity has also been reported in the subthalamic nucleus (STN) of awake patients with PD and have been shown to be dopamine- and activity-modulated, suggesting these rhythms may be intimately related to the pathophysiology of disease (Foffani et al., 2003; López-Azcárate et al., 2010). Such very high gamma-band activity, however, has not previously been described in the internal part of the globus pallidus (GPi). Because GPi is a common target for neuromodulation in the treatment of PD and is the final common output node for both the direct and indirect basal ganglia pathways, we hypothesized that a very high gamma band (>200 Hz) rhythm is also present in GPi and that this rhythm would demonstrate activity-modulation.
We recorded LFPs intra-operatively from the GPi of seven patients with PD after overnight withdrawal from dopaminergic medication and found a previously undescribed band of increased spectral power between 200 and 300 Hz that exhibits activity modulation.
Materials and Methods
Subjects
Seven subjects (table 1) with PD symptoms undergoing DBS implantation on the right GPi participated in the study after having provided informed consent approved by the internal review board at the University of California, Los Angeles.
Table 1. Subjects in this study.
Subjects 1 and 6 could not be present for Off UPDRS because they were severely affected by symptoms. Subject 4 could not be tested for On UPDRS due to intolerance to medication.
| Subject | Age | Sex | MDS-UPDRS PIII, Off/On |
Disease duration (years) |
|---|---|---|---|---|
| 1 | 62 | F | 52/27 | 25 |
| 2 | 69 | F | 33/9 | 12 |
| 3 | 64 | M | NA/21 | 12 |
| 4 | 60 | M | 30/NA | 10 |
| 5 | 40 | M | 56/42 | 5 |
| 6 | 71 | M | NA/23 | 13 |
| 7 | 72 | M | 46/9 | 15 |
Recording procedures
LFP recordings from the last 24mm of the DBS lead trajectory of implantation, which included the GPi, were obtained from the lead’s four ring electrode contacts (Medtronic, Model 3387, length 1.5mm, inter-contact distance 1.5mm). Signal acquisition was performed using BCI2000 v6.2 through a connection of the DBS lead to an amplifier (g.Tec, g.USBamp 2.0). The recording was performed at a sampling rate of 2400 Hz and online high-pass filtering above 0.1 Hz. Concurrent recordings from a data glove (5DT data glove 5 Ultra) worn by the patient on the hand contralateral to the DBS lead were obtained at a slower effective sampling rate, which was oversampled at 2400 Hz by BCI2000 using stair step interpolation. Scalp ground and reference were used. Amplifier potential equalization was provided by an ECG lead attached to each patient’s left shoulder.
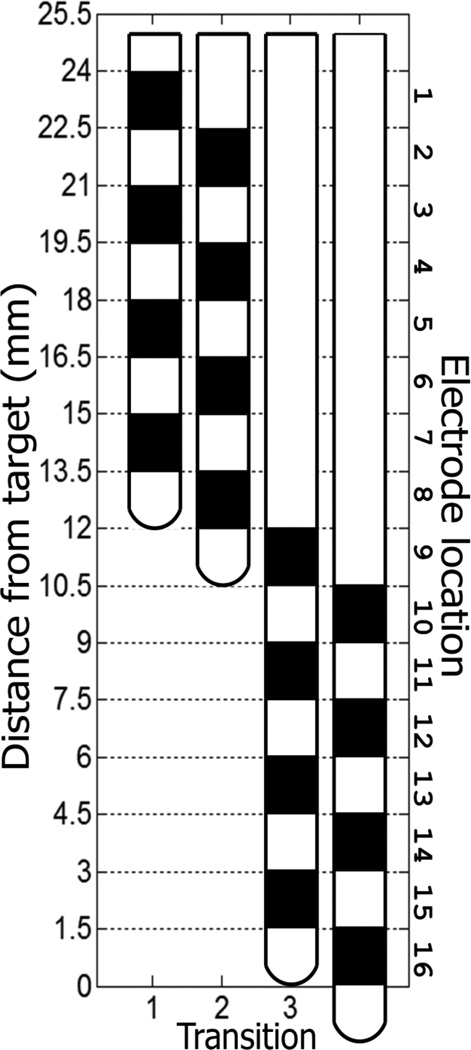
Once target coordinates were determined based on standard clinical methods, including indirect and direct (image-guided) targeting, microelectrode recordings, and intraoperative fluoroscopy, the DBS lead was advanced to target (average distance anterior to mid-commissural point: 19.82mm, and interior to AC-PC plane: 4.61 mm) in four incremental steps, beginning initially at a point 13.5 mm from target with subsequent advances as illustrated in Figure 1. This provided LFP recordings from a 24 mm span of the trajectory with non-overlapping interleaving recordings. At each position, signals were recorded during 60 seconds of rest and 60 seconds of self-paced contralateral hand movement (hand opening and closing, Table 2). Thirty to 60 seconds was allowed between each recording position to allow advancing of the electrode. In each case, the electrode was advanced using the Alpha Omega microdrive system.
Figure 1.
Advancement of DBS lead to target. The lead was advanced four times such that its most distal electrode contact was 13.5 mm, 12 mm, 1.5 mm and 0 mm away from target. This protocol ensured recordings took place in every part of the last 2.4 cm along the path used to implant the lead. The most dorsal location was named location 1, while the most ventral location 16. Locations 15 and 16 were considered to be in the GPi, the target nucleus for stimulation.
Table 2. Intra-operative recording protocol.
Rest (R1, R2, R3, R4), movement (M1, M2, M3, M4), and lead location transition (T1, T2, T3) phases were alternated in order to obtain recordings for 16 locations evenly spread along a 24mm trajectory ending at the GPi.
| Phase | Duration | DBS location | Hand movement |
|---|---|---|---|
| R1 | 60 sec | 1, 3, 5, 7 | no |
| M1 | 60 sec | 1, 3, 5, 7 | yes |
| T1 | 60 sec | (transition) | - |
| R2 | 60 sec | 2, 4, 6, 8 | no |
| M2 | 60 sec | 2, 4, 6, 8 | yes |
| T2 | 60 sec | (transition) | - |
| R3 | 60 sec | 9, 11, 13, 15 | no |
| M3 | 60 sec | 9, 11, 13, 15 | yes |
| T3 | 60 sec | (transition) | - |
| R4 | 60 sec | 10, 12, 14, 16 | no |
| M4 | 60 sec | 10, 12, 14, 16 | yes |
Signal pre-processing
All computational procedures were performed in Matlab v.7.10.0 (www.mathworks.com). The original monopolar signal recordings (MON) were re-referenced offline to generate the equivalent time series for a bipolar (BIP) and a common average referenced (CAR) configuration. Bipolar signals were generated by subtracting signals from adjacent pairs of contacts at each recording position. For CAR, the common average reference of all four electrodes at each recording position was subtracted from the recordings of each contact in that recording position. Because noise characteristics were different among the three configurations, procedures to remove noise were separate.
In the MON configuration data was filtered using a 2 Hz high pass Chebyshev II filter (filter order n=18) implemented as a second order sections direct form II structure using double precision arithmetic. The signals were then notch filtered at 60 Hz (Butterworth, n=8, quality factor Q = 50) in order to remove line noise. The phase of the oscillations in the processed signals was preserved (zero-phase filtering) by filtering first in a forward fashion and then in the reverse direction (Gustafsson, 1996). Periods during which the power spectra had abnormally high values and a pattern with excessive presence of harmonics, accompanied by a time series with high rates of voltage change measured by the first derivative, were spliced out from the signal and not included in the analysis (26, 2, 4.8, 6, 3.3, 38.7 and 0 sec. total duration in the 1st–7th subject respectively during ~480 sec. of rest and movement recordings per subject). In addition, sudden DC shifts in the signal of the 1st and 7th subject possibly caused by internal adjustments of the amplifier were also spliced out with almost negligible amount of signal loss, in the range of 3–32 msec. per DC shift. All splicing was done in an automated manner and subsequently inspected to ensure proper removal of segments with high signal-to-noise ratio. For subject 6, recordings at target were free of artifacts, whereas several locations proximal to it had significant signal contamination. Therefore, only a 23 second recording was considered to extract baseline activity in the metric Relative Band Power mentioned later and the analysis for that subject was limited to only the MON and CAR configurations.
Signals from the CAR and BIP configurations, were filtered as in MON. Re-referencing removed the seconds-long spectral perturbations (except for the 6th subject) seen in MON. Any sudden DC shifts were spliced out while keeping the signal loss minimal (CAR: 160, 26 msec. for 1st and 5th subjects respectively; BIP: 245, 125, 67 msec. for the 1st, 3rd and 5th subjects respectively).
Data analysis
Peak extraction
Besides block design, to ensure proper differentiation of rest vs. movement, movement phases were confirmed based on signals generated from the data glove. The signals were remapped with respect to location and phase type: rest (R), movement (M), and transition (T) (Table 2, Figure 1). Location 1 was designated as the most dorsal (furthest from target), while location 16 or 12 (BIP) as the target site.
For each time segment we obtained the power spectral density using the multitaper method implemented in Matlab signal processing toolbox (time-bandwidth product NW = 9, number of leading tapers K = 17) and time-frequency representations (TFR) using both a custom Matlab script (NW = 6, K = 11, moving window size = 6 sec. and step = 6 sec.) and the chronux toolbox (v.2.00) (NW = 3, K = 5, moving window size = 6 sec. and step = 0.5 sec). The range of frequencies for all spectral estimates was 2–1000 Hz and all the resulting data was log transformed.
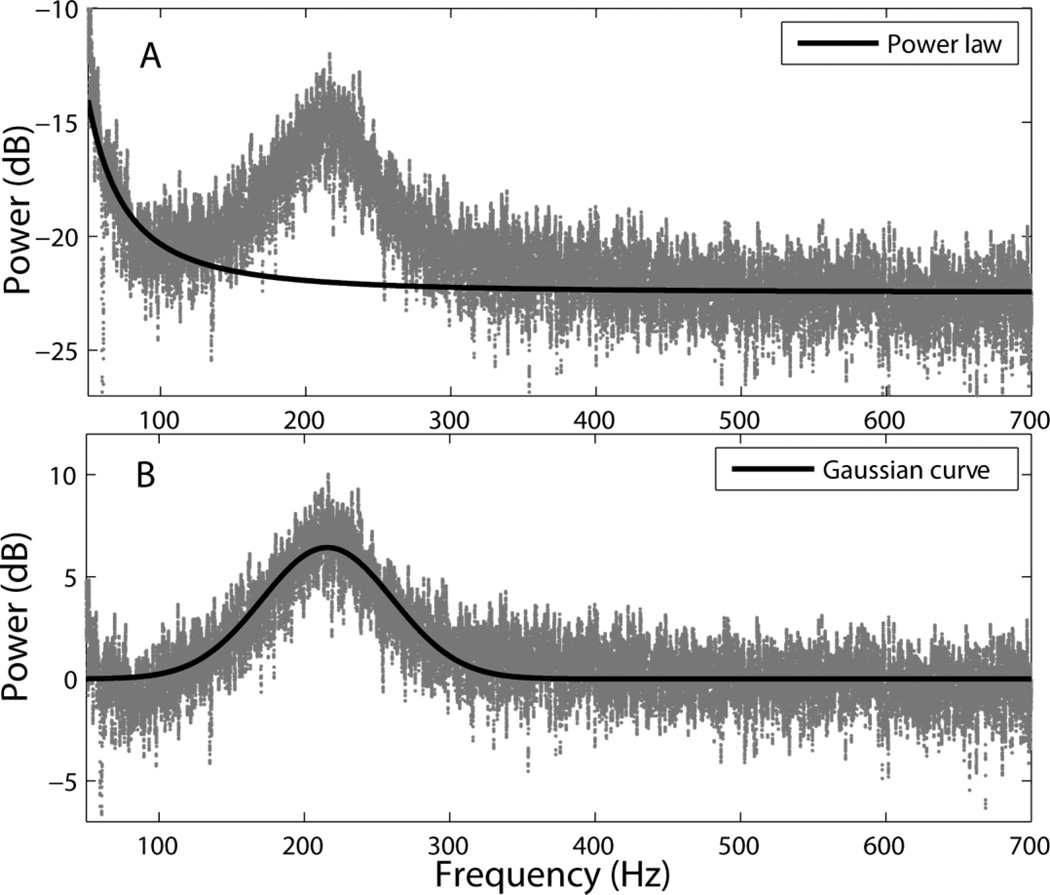
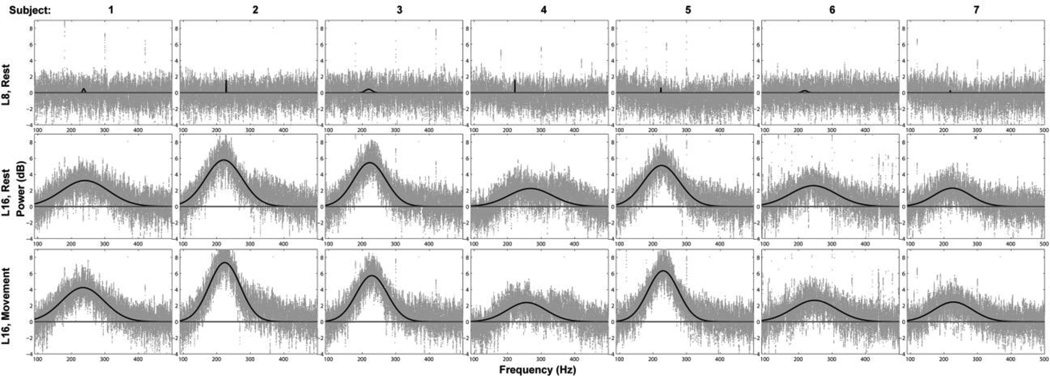
To extract peak parameters in the 200–300Hz range we used the curve fitting toolbox from Matlab. We first fitted a power law in each spectrum using only the ranges 55–130 Hz and 400–700 Hz (Figure 2A) to reduce the effect of spectral peaks on the model, and then subtracted the fitted curve from the spectrum. A Gaussian curve was then fitted (nonlinear least squares with bisquare robust method, Figure 2B) to the part of the resulting data that corresponded to the 100–350 Hz range. All fitting was verified individually and in cases where a clear peak was not obvious, the fitted curve height was set to zero and the center frequency and bandwidth were ignored. In those cases the height was small and the bandwidth large, reflecting the mismatch between the power law and the actual data rather than an underlying peak.
Figure 2.
Peak extraction at 200–300 Hz. (A) The power law (black) was fitted to spectra (subject 2, location 15, CAR) in frequencies that had minimal or no spectral peaks (55–130 Hz and 400–700 Hz). (B) A Gaussian curve (black) was fitted to spectra (100–350 Hz) from which the power law had been subtracted (gray).
To observe the evolution of peak parameter values from the rest to the movement condition we obtained TFRs with finer time resolution (NW = 2, K = 3, moving window size = 1 sec. and step = 0.1 sec.). From those, we calculated the average band power in a frequency range with center and bandwidth that was obtained as an average of the centers and bandwidths between rest and movement. The band power was then plotted against time.
Relative Band Power
Because increases in β power could not be described by Gaussian peaks accurately, we measured activity in low β (12–20 Hz) and high β (20–35 Hz) using the summary statistic Relative Band Power (RBPlow_β, RBPhigh_β), calculated as a log-transformed average band power normalized with respect to the 600–1000Hz band, which served as a reference because it followed the power law and did not show significant peaks in any part of the recordings (equation 1). This methods is similar to that previously described by Foffani, et al. (2006).
| (1) |
In (1), a is the mean power of the band of interest and b is the mean power of the reference band (600–1000Hz). We also measured this statistic for the 200–300 Hz band, RBP200–300Hz, in addition to the peak analysis in order to verify our results. This statistic was reported as a percent difference from baseline, with baseline defined as the average RBP from the most proximal locations (1–8 for MON and CAR; 1–6 for BIP).
Statistical analysis
The analysis involved an inter-subject design from which we could make inferences about the underlying population, as well as an intra-subject design in which the results were relevant to each subject. Because not all the selected statistics had normal distributions and the sample sizes were relatively small (n=7 for inter-subject, n=~10 for intra-subject), we used only non-parametric tests (one-sided, single or paired sample, Wilcoxon signed rank test) for all three configurations: MON, CAR and BIP.
In the inter-subject design we tested the null hypotheses that peak height in the 200–300 Hz band is greater than zero at the GPi of patients with PD, and that the peak height increases and the bandwidth decreases during movement. We also tested the null hypothesis that the center frequency differs between rest and movement using paired-sample tests. In the intra-subject design, we considered 6 second non-overlapping windows for the ~60 second rest and movement phases to test the same null hypotheses. Moreover, we tested the hypothesis that there is increased low β (12–20Hz) and high β (20–35Hz) band activity at and near the GPi compared to recordings made outside of the GPi target region.
Results
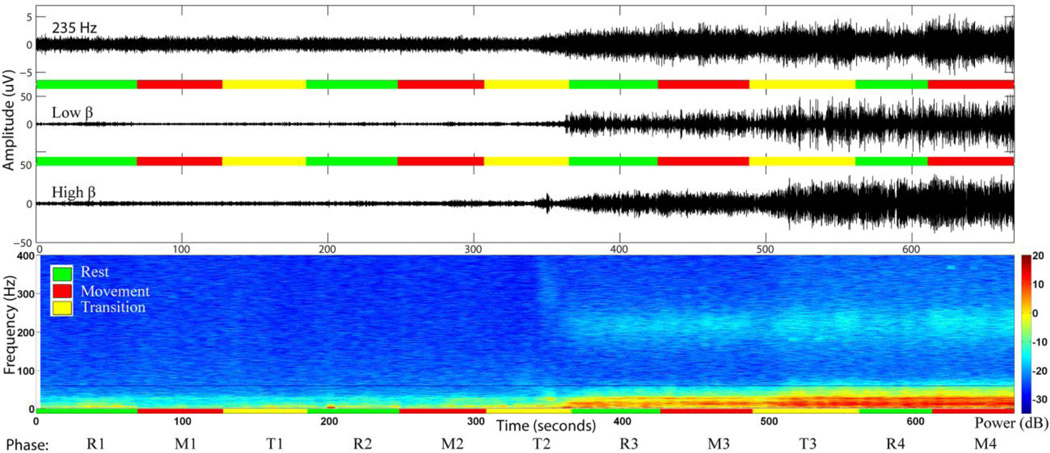
The power in the 200–300 Hz band demonstrated a clear and consistent increase in power across all subjects at recording sites at and close to the GPi target (Figure 3), particularly after the second electrode position transition (T2, Table 2). A similar pattern of increased power was seen in the beta band at and close to the GPi target (Figure 3). Subsequent analyses focus on characterizing this previously undescribed GPi very high gamma band activity in patients with PD and verifying the presence of β band activity that has been previously described.
Figure 3.
Time series (top) and time frequency representation (TFR) (bottom), of the recording from the most distal electrode contact of the lead in subject 2. According to the recording protocol this electrode covered locations 7, 8, 15 and 16. The green, red and yellow horizontal lines correspond to rest, movement and lead transition phases respectively. After the second transition the electrode was advanced to location 15 and a noticeable increase in power near 200 Hz appeared. Starting with the third transition the electrode contact reached location 16 and a further increase in the power of the higher frequencies was observed. Careful inspection also reveals that finger movement further increased the power near 200 Hz compared to rest.
200–300 Hz power in the GPi
Rest Condition
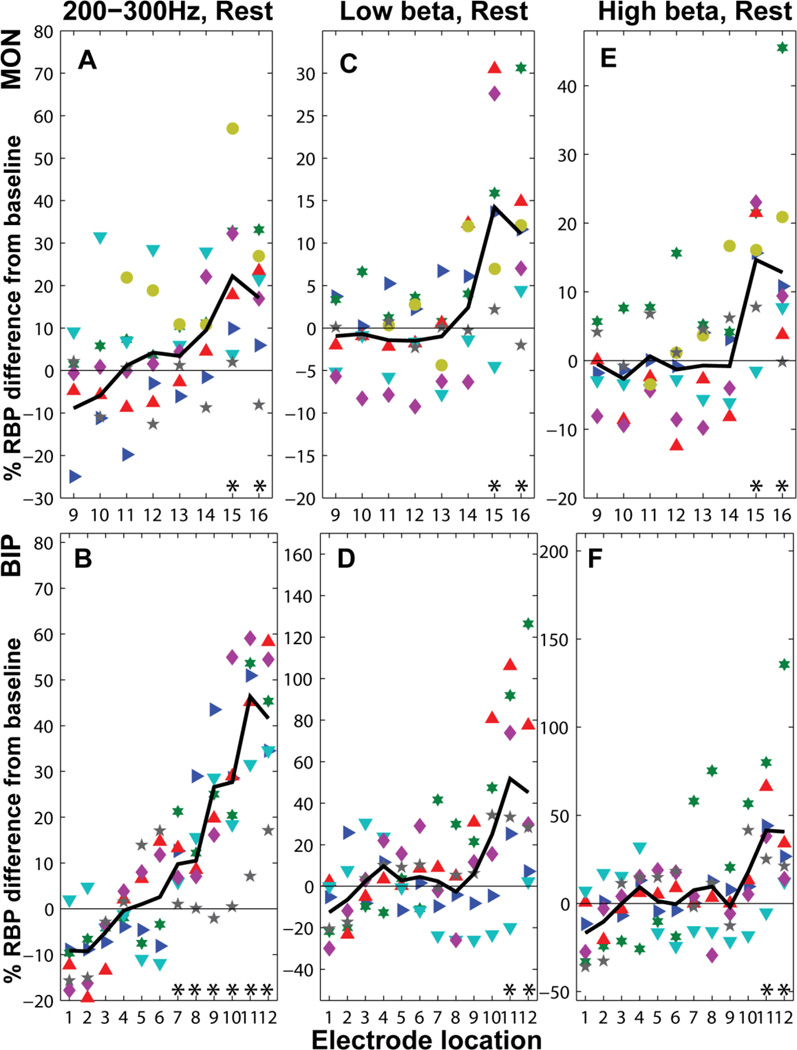
200–300 Hz power was first measured with the RBP200–300Hz index, which confirmed our initial hypothesis that power in that range increases near target. RBP200–300Hz in the GPi (locations 15 and 16) was higher than baseline (MON, CAR: locations 1–8) in all subjects regardless of referencing configuration (Figure 4 A, B) (percent difference in MON: 22.22 ± 19.77 %, p=0.0079 for location 15 and 17.1 ± 14.0 %, p=0.023 for location 16).
Figure 4.
Relative Band Power (RBP) for the 200–300 Hz, low β (12–20 Hz) and high β (20–35 Hz) in the GPi for all subjects. The percent difference from baseline (locations 1–8 in MON) is denoted for each subject with a different symbol and color. The average RBP200–300Hz (black line) (A,B) increased at target, consistent with the observation from a subsequent analysis that the peak height at around 235Hz reached its highest value at target. Both RBPlow β and RBPhigh β are higher than baseline at the GPi (C-F) (locations 15 and 16 for MON, and 12 for BIP). Values for the 6th subject were not considered in the bipolar configuration (B, D, F). Asterisks indicate significance at the 5% level for one-sided non-parametric tests.
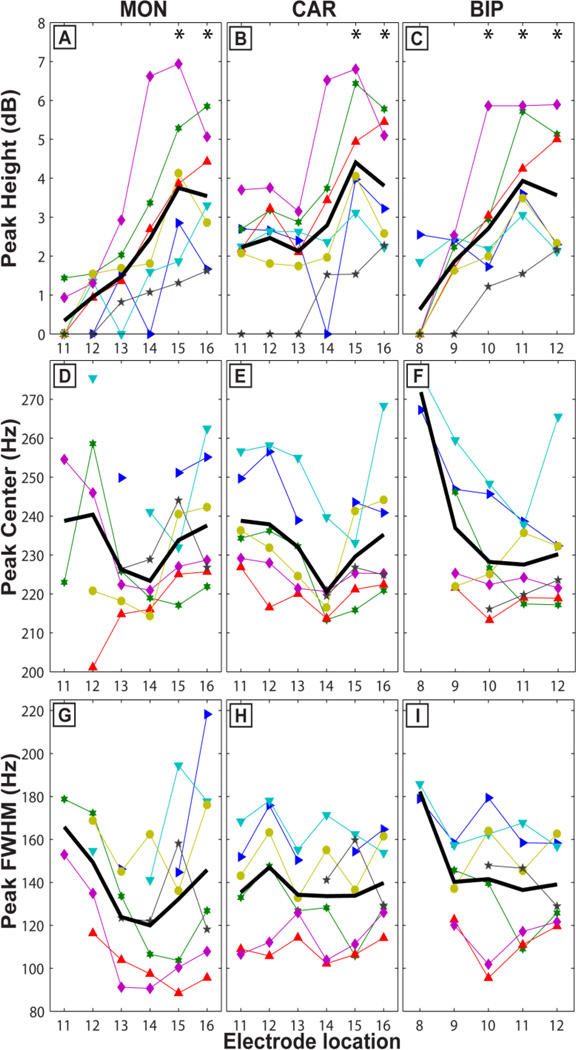
We then proceeded to further characterize the very high gamma band power increase by characterizing peak parameters in further detail. In the inter-subject analysis, peaks in the 200–300Hz band were only detected after the second electrode transition, corresponding to recordings from within the globus pallidus. Even within the globus pallidus, the consistency with which peaks were detected across subjects increased with increasingly ventral recordings (i.e., positions 15 and 16, Figure 5 A–C, Figure 6). Moreover, the heights (or associated power) of these peaks were greatest at the most ventral recording sites (near target) within the GPi (MON: 3.7 ± 2.0 dB at location 15 and 3.5 ± 1.6 at location 16, MON: one-sample, one-sided, Wilcoxon Signed Rank, p<0.0079, Figure 5A). The center frequency at the most distal location (16 for MON and CAR) was 237.6 ± 16.0 Hz for MON, 235.2 ± 17.2 Hz for CAR and 230.2 ± 16.7 Hz for BIP. Finally, the peak’s full width at half maximum (FWHM) was 62.0 ± 19.2 Hz (MON), 59.3 ± 8.4 Hz (CAR) and 59.1 ± 8.1 Hz (BIP).
Figure 5.
Peak characteristics at GPi. During rest (A-I) the peak height was greatest at GPi (AC) with highest average values (black line) reached at location 15. Peaks were detected for all subjects at target, in more proximal locations. The peak centers at location 16 were 235 ± 4 Hz depending on electrode configuration (MON: D; CAR: E; and BIP: F). In D and F there is a tendency for the peak centers to have less variability at the GPi compared to more distal locations (e.g. 240.4 ± 29.6 at location 12 whereas 233.8 ± 11.9 at location 15, D). A comparison between MON and CAR reveals that by subtracting the common average reference from each of the four concurrent recordings (B) the 235 Hz spectral component at the GPi has affected other locations (11–12). Asterisks in A-C indicate that peak height is greater than zero at the 1% significance level using one-sided non-parametric tests.
Figure 6.
Peak extraction (CAR). Peaks were not present away from the GPi (e.g. location 8, 1st row). At locations 9 and 10 (not illustrated) there was not usually a peak, but if present it was either weak (< 1 dB) or a result of re-referencing using the common average reference and bipolar configurations. At target (location 16) in the rest condition peaks were present for all 7 subjects (2nd row). During movement the peak heights were increased by ~0.7 dB (Figure 7 B) for all subjects (3rd row). In different configurations (MON, BIP) not all subjects showed an increase (Figure 7 A, C).
In the intra-subject analysis, peaks in the 200–300Hz band were more frequently identified from 6-second samples from recordings within GPi (locations 15 and 16) than recordings from other locations in the trajectory. Peak height was significantly greater than zero (MON: one-sample, one-sided, Wilcoxon Signed Rank, p < 0.016) at both of these most ventral locations.
Movement Condition
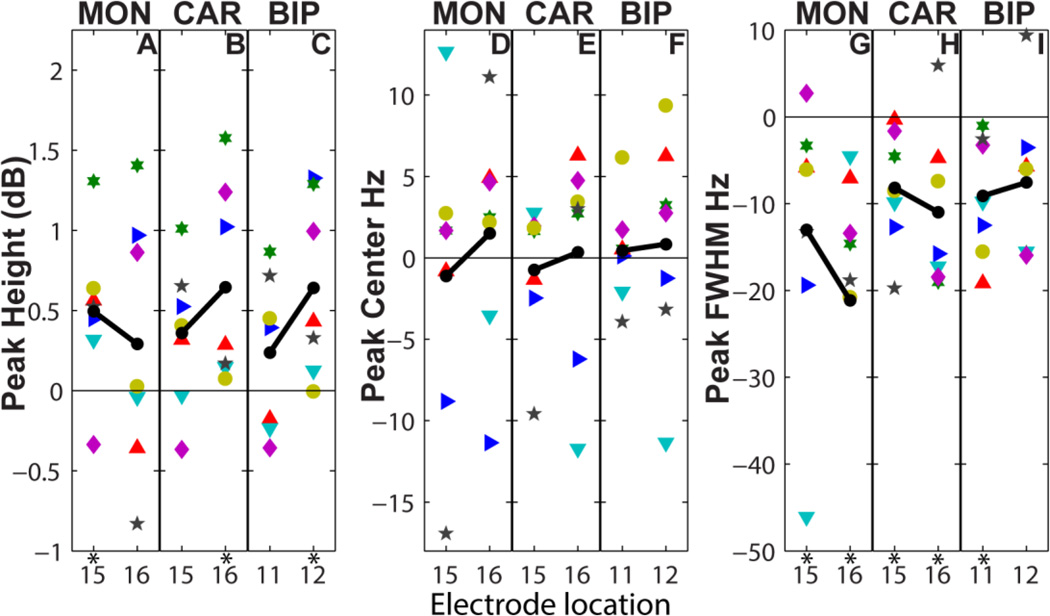
In the inter-subject analysis, the height (or associated power) of the peak in the 200–300Hz band was higher during movement compared to rest (difference in MON: 0.50 ± 0.48 dB at location 15, and 0.30 ± 0.80 at location 16, Figure 7A). Statistical significance depended on location (paired-sample, one-sided Wilcoxon Signed Rank, p = 0.023 and p = 0.23 for locations 15 and 16 respectively). The equivalent results in CAR (0.36 ± 0.45 dB, p=0.055 and 0.64 ± 0.61, p=0.0078 for locations 15 and 16) and BIP (0.64 ± 0.55, p=0.016 for location 12 [corresponding to the most ventral recording site]) suggest that movement increased the peak height near and at target.
Figure 7.
Effect of voluntary finger movement on peak attributes. Movement caused an increase in average peak height (A-B, black line) of ~0.4 dB and decrease in average peak width (G-I, black line) of ~10 Hz compared to rest. Movement seemed to modulate the peak center for some subjects by either increasing or decreasing its value (D-F). Asterisks indicate significance at the 5% level with one-sided non-parametric tests.
The FWHM of the peak in the 200–300Hz band decreased during movement compared to rest (MON: −13.0 ± −8.5 Hz and −21.2 ± −14.1 Hz at locations 15 and 16 respectively, Figure 7G). The results were significant for both locations in any electrode configuration (paired-sampled, one-sided Wilcoxon Signed Rank, p < 0.023) with one exception that approached significance (location 12 in BIP, p = 0.055).
The center frequency of the peak was not movement-modulated, with the difference between the two conditions in the peak center being near zero (MON: −1.1 ± −6.1 Hz and 1.5 ± −3.9 Hz at locations 15 and 16, Figure 7D).
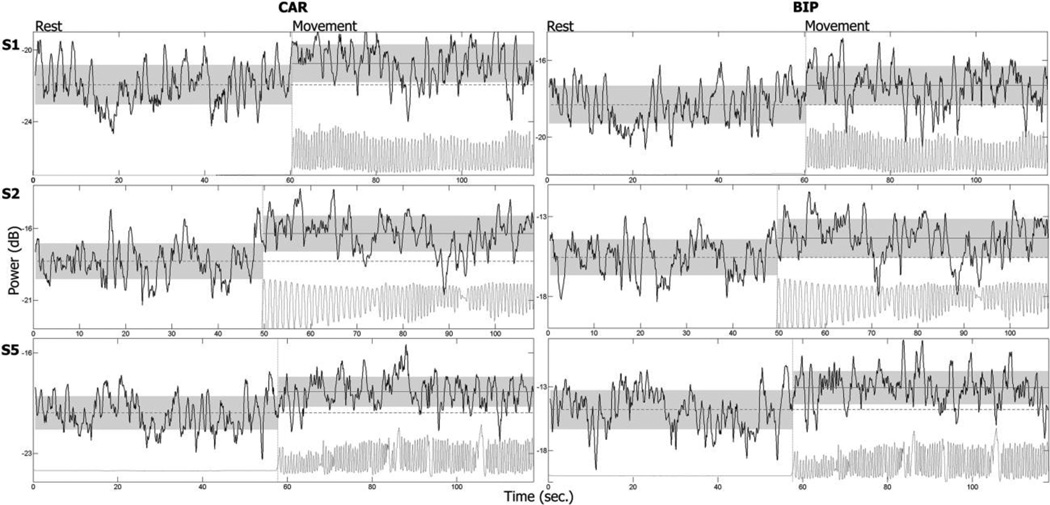
An observation of how the peak height changes during rest and movement using a moving windows of size 1 second and step size 0.1 seconds revealed that in subjects in which movement modulation was found, the increase in height was not a transient response, but rather persisted throughout the duration of the movement (Figure 8).
Figure 8.
Sustained increase in 200–300 Hz power during movement. The average values (straight horizontal lines) and standard deviations (top and bottom of shadowed areas) for rest and movement are shown for subjects 1, 2 and 5 at the 1st, 2nd and 3rd rows respectively in two configurations (CAR and BIP). The increase in 200–300 Hz power persisted for as long as the subject was moving their contralateral fingers and did not have a clear transient response. After initiation of movement the band power was higher than the baseline resting average for most of the time.
In the intra-subject analysis, the height of the peak was significantly higher during movement in at least one of the locations 15 and 16 in 5 of 7 subjects (MON: t-test, p < 0.033). For the same subjects the peak FWHM was significantly reduced in at least one of the two locations (MON: t-test, p < 0.022). Differences in the peak center frequencies between movement and rest were sometimes significant (6 increases and 2 decreases at location 15 and 16, p < 0.05) indicating the polarity of the modulation was dependent on the subject.
Beta band power in the GPi
Results for the β band resembled those of the 200–300 Hz band during both rest and movement conditions (Figure 3). Regardless of referencing algorithm (MON, CAR, BIP), RBPlow_β and RBPhigh_β values at distal recording sites (i.e., within the GPi) at rest were significantly greater (approximately 30%, Figure 4 C–F) than those recorded from proximal positions within the trajectory (locations 1–8 for MON and CAR, and 1–6 for BIP) from white matter areas including anterior corona radiata (percent difference from baseline in MON for RBPlow_β: 13.18 ± 12.8 %, p=0.023 and 11.2 ± 10.2 %, p=0.016 for locations 15 and 16 respectively). Equivalent results for RBPhigh_β were significant (14.9 ± 8.9, p=0.016 and 14.0 ± 15.4, p=0.016).
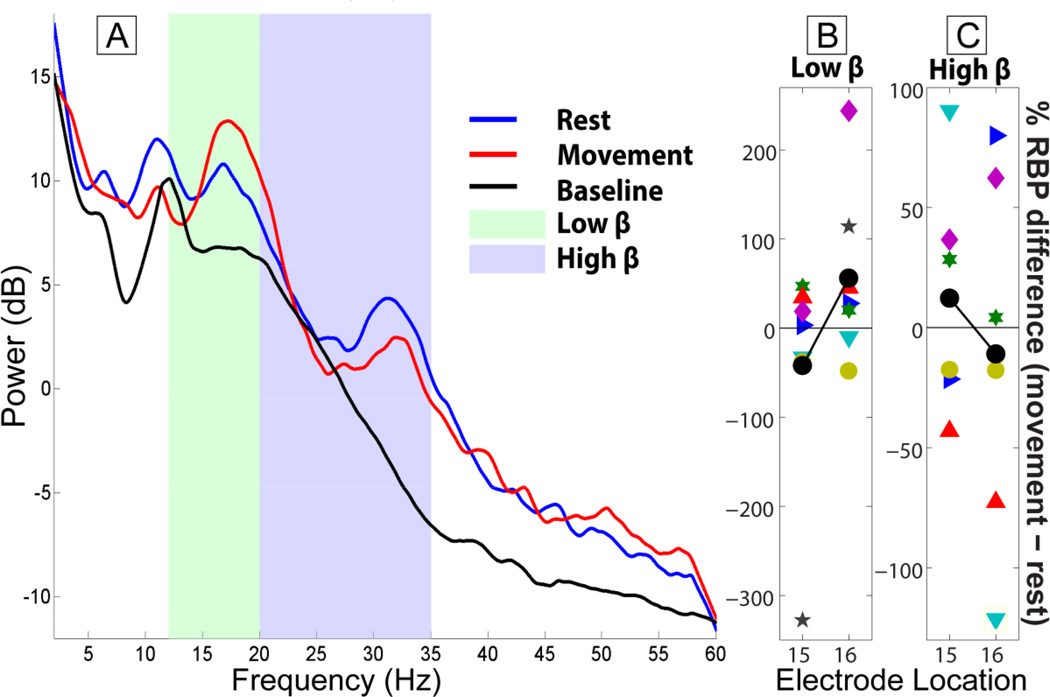
The low β (12–20 Hz) band power at locations 15 and 16 increased with movement for 4 out of 7 subjects while high β (20–35 Hz) increased in 3 subjects (Figure 9 B–D). These results did not reach significance (percent difference between movement and rest at location 16 for MON: 56.2 ± 96.6 %, p=0.11, 5 positive values). In the other subjects at least one of the locations showed a decrease in β power with movement.
Figure 9.
Low and high β band power for the 5th subject at GPi (locations 15 and 16) using a monopolar electrode configuration. The spectra (A) at location 16 were obtained with a multitaper method (NW = 9, K = 17) and smoothed with local regression (linear least squares, 1st degree polynomial model, range of 3Hz). Activity at the low and high β bands in the GPi is higher than baseline (locations 1–8) as evidenced by the spectra (shown only for subject 5) and Figure 4 C–F. The Relative Band Power (RBP) of low and high β band was normalized against a baseline (average RBP of locations 1–8) for movement and rest. The percent differences between the two conditions are shown in B and C for each subject. Average values of those differences (black lines) varied above and below zero depending on electrode configuration (only MON shown) and electrode location. Within subjects a tendency towards increased or decreased β band activity with movement was at times significant but across subjects there was not a significant difference between movement and rest (location 15 and 16 average values from subjects with less than 50 percent and more than −50 percent difference: 2.76 ± 34.19 and 7.06 ± 32.73).
Discussion
Our findings indicate there is increased high γ (200–300 Hz) activity in the GPi of patients undergoing DBS for PD that is movement-modulated. We characterized the peak in that range, which had an average center frequency of 234 ± 17 Hz, and FWHM 60 ± 8 Hz. The peak height was pro-kinetic in most subjects.
The results also confirmed the presence of increased β band in the GPi of patients with PD (Priori et al., 2002). The same study showed movement-dependent decreases in β band power in the STN and GPi, which contrasts with our findings. The anti-kinetic character of the β band has largely emerged from studies of the STN (Levy et al., 2002; Kuhn et al., 2004; Kuhn et al. 2006) with only a single report in GPi. As discussed below, the two nuclei form distinct neuronal networks for which oscillatory activity can have different neurophysiological roles.
The β band could have a widespread regulatory role in the signal processing cascade of the basal ganglia. As is the case with the STN and motor cortex, at the GPi it has been shown (Silverstein et al. 2003) that β power decreases with medication. However, unlike the STN and motor cortex, the relative position of GPi in the basal ganglia circuits as a common output for both the indirect and direct pathways may in part account for the lack of modulation by activity. Another explanation is that since β power is often considered as “inhibitory”, the failure to suppress it in the GPi in the dopamine depleted state (MED OFF) may in fact be part of the pathophysiology of PD.
Movement-dependent 200–300 Hz power in GPi
Although very high γ power activity in the GPi has not been previously described, others have described dopamine and movement-modulated very high gamma power (300 Hz or 150–200 Hz) in the STN of PD patients (Foffani et al., 2003; Kane et al., 2009; López-Azcárate et al., 2010).Foffani et al. (2003) and López-Azcárate et al. (2010) reported movement-modulation of very high frequency rhythms (200–350 Hz, central frequency 319 Hz and 323 Hz) in the STN in the “on” state (after administration of dopaminergic therapy) with contralateral self-paced movement of a finger or wrist. Interestingly, our findings resemble a similar pattern to these findings with a comparable task. While both studies indicate a “pro-kinetic” nature of very high gamma band activity, the STN studies showed that in the “off” medication state there was little to no change in the fast rhythms with movement, in contrast to our results. One possibility is that movement-modulated very fast oscillations are present in the GPi of healthy subjects to accommodate temporal integration from the large input from the striatum and external part of the Globus Pallidus. In PD patients, the neuronal circuits in the GPi might partially or fully retain their ability to oscillate in a movement dependent manner, unlike the STN. Moreover, in the “off” state the peak center at the GPi is 235 Hz, considerably lower than the 319 Hz oscillations in the STN found by (Foffani et al. 2003) but closer to the 265 ± 33 Hz STN rhythm reported by López-Azcárate et al. (2010). While both nuclei are targets for therapeutic neuromodulation, they comprise distinct neuronal circuits in the BG. Patterns of activity might have similarities among BG nuclei, but may not be easily extrapolated from one nucleus to another. To shed more light on the unique properties of the GPi further studies could compare the effect of “on” and “off” medication conditions on very fast oscillations.
Role of high frequency activity in basal ganglia function
GPi projections to thalamic nuclei constitutes the primary output from the BG, with the substantia nigra pars reticulata (SNpr) also being an output structure. Thalamocortical coupling has been detected in the theta and β band (Llinas et al., 1999; Paradiso et al., 2004; Sarnthein and Jeanmonod, 2007) and has been implicated in the preparation of voluntary movements (Paradiso et al., 2004). A possible role of high frequency oscillations in GPi could be to encode information before it is relayed to thalamic nuclei. Higher frequencies could theoretically carry more information than slower ones if they reflect an increased rate of spiking activity and the statistical characteristics of spike trains represent units of information. As explained by Theunissen and Miller (1995), with an approximate duration of 1 msec for one action potential, a 100 msec window could encode a staggering 2100 symbols in a deterministic sense. Despite our uncertainty about the functional significance of the 200–300 Hz rhythms, it is noteworthy that they afford processing in a decreased temporal scale and that high γ band activity in the striatum (Masimore et al., 2005; van der Meer and Redish, 2009) and STN (Cassidy et al., 2002). A similar argument that higher frequencies can process more information was also made byFoffani et al. (2003). However, the oscillatory activity might not be involved in the delivery of “messages” to the thalamo-cortical network, but rather in providing a dynamic background for cortical signal processing (Shi et al., 2004). In this scenario neuronal activity between GPi and motor cortex are likely to be coherent. Coupling between the two structures has already been demonstrated for low frequency rhythms at ~1 Hz (Magill et al., 2000) and the alpha band (Salih et al. 2009).
Another possibility for the role of 200–300 Hz rhythms is that the temporal encoding capability might accommodate the integration of the vast input received by the basal ganglia that comes from most areas of the neocortex and the intralaminar nuclei of the thalamus (DeLong and Georgopoulos, 2011). The output nuclei of the BG (GPi, SNpr) are considerably smaller in size and have less neurons than the main input structures (putamen and caudate nucleus). The reduction in size is accompanied by a convergence of neuronal projections, with an estimated 31 million projections in the striatum and only 229000 in the GPi (Tisch et al., 2004). This anatomical substrate seems appropriate for integration or selection of information from the input to the output structures and the result of this process could be encoded in time by the 200–300 Hz rhythms. This working model is consistent with findings that fast oscillations in the γ band can be observed in the GPi during movement (Cassidy et al., 2002, Brown and Williams, 2005), which possibly requires extensive integration of input from the sensorimotor cortex. It is likely that temporal coding is necessary for proper communication with the thalamus whereas the choice of neural circuits that are being activated is determined primarily by the specific intended action according to the topographic representation that can be found throughout the cortico-basal ganglia thalamo-cortical circuit (DeLong and Georgopoulos, 2011).
While considering a possible significance of the 200–300 Hz rhythms for basal ganglia coding capacity it is important to the possibility of increased synchronization in that frequency range being detrimental to normal function of the network. Considering the monosynaptic interactions between the GPi and the thalamus, GPi 200–300 Hz activity might contribute to motor deficits by 1) dominating over signals or other oscillations, such as γ, that encode information for movement execution, or 2) modulating thalamic oscillatory activity and preventing the thalamocortical network from organizing parallel cortical activities prior to onset of movement. Nevertheless, our finding that the 235 Hz rhythm is pro-kinetic suggests it might be present in the normally functioning GPi.
Limitations and future directions
LFP recordings in the GPi were made only in the MED OFF state and without deep brain stimulation (STIM OFF), two factors that might modulate the 200–300 Hz band power. Consequently our findings are amenable mostly to interpretation of how the GPi functions in the MED OFF and STIM OFF conditions in PD patients. Future efforts should evaluate differences between the OFF and ON states.Rouse et al. (2011) and Stanslaski et al. (2011) have implemented implantable devices capable of concurrent sensing and stimulation. While interpreting results from these experiments it is important to consider the differential effect that acute and chronic dopamine (DA) depletion can have on the presence of oscillations. Some animal studies (Mallet et al., 2008; Degos et al., 2009) have shown that pathological oscillations appear mostly in chronic DA depletion and that PD symptoms can precede any observable disturbances in oscillatory activity. A link between DA medication or DBS stimulation and 200–300 Hz oscillations could implicate the later with PD dysfunction and comprise a physiological characteristic of the disease that should be included in models of BG functionality.
Further suggestions include an examination of the GPi fast rhythms in the broader context of the cortico-basal ganglia-thalamocortical network. An appealing reason for looking at directional coupling between the GPi and thalamo-cortical network in the form of nested frequency components is that the 200–300 Hz rhythms of the former might be coherent to very high oscillations (600–1000 Hz) that have been observed in the latter as somatosensory evoked potentials (Gobbelé et al., 2008). Finally, as it has been done in studies testing for coherence between unit recordings and LFP in the β band (Goldberg et al., 2004), similar experiments but focused on the 200–300 Hz rhythms could elucidate how closely network activity can be predicted from spike discharges.
Conclusion
Movement-dependent 200–300 Hz power in the GPi of patients with PD has been identified, providing additional material to consider in the complex model of BG physiology and pathophysiology. It is unknown how the 110–150Hz stimulation frequency of DBS in the GPi or STN of PD patients has a therapeutic outcome. It is noteworthy that the second harmonic of typical choices for stimulation frequency is included in the 200–300Hz range and (Foffani et al., 2003) notes a possible link between them. If the high frequency oscillations are strongly correlated with PD symptoms they might be a good choice for a controlled variable in closedloop DBS. Moreover, the peak at 235 Hz could serve as intraoperative confirmation of the correct placement of an electrode.
Highligghts.
200–300 Hz oscillations in the Globus Pallidus Internus of Parkinson's Disease patients.
Peak heights at ~235 Hz remain elevated thoughout the duration of contralateral finger movement.
β band activity in the GPi did not decrease during movement in all subjects.
Acknowledgements
This work is supported by funds provided by National Institute Of Biomedical Imaging And Bioengineering under Award Number K23EB014326 (NP), the UCLA Scholars in Translational Medicine Program, and the UCLA Department of Neurosurgery Visionary Ball.
Footnotes
Publisher's Disclaimer: This is a PDF file of an unedited manuscript that has been accepted for publication. As a service to our customers we are providing this early version of the manuscript. The manuscript will undergo copyediting, typesetting, and review of the resulting proof before it is published in its final citable form. Please note that during the production process errors may be discovered which could affect the content, and all legal disclaimers that apply to the journal pertain.
Conflict of interest:
The authors declare no competing financial interests.
References
- Berke J. Fast oscillations in cortical-striatal networks switch frequency following rewarding events and stimulant drugs. European Journal of Neuroscience. 2009;30:848–859. doi: 10.1111/j.1460-9568.2009.06843.x. [DOI] [PMC free article] [PubMed] [Google Scholar]
- Berns GS, Sejnowski TJ. A computational model of how the basal ganglia produce sequences. Journal of Cognitive Neuroscience. 1998;10:108–121. doi: 10.1162/089892998563815. [DOI] [PubMed] [Google Scholar]
- Brown P. Cortical drives to human muscle: the Piper and related rhythms. Progress in neurobiology. 2000;60:97–108. doi: 10.1016/s0301-0082(99)00029-5. [DOI] [PubMed] [Google Scholar]
- Brown P. Bad oscillations in Parkinson’s disease. Parkinson’s Disease and Related Disorders. 2006:27–30. doi: 10.1007/978-3-211-45295-0_6. [DOI] [PubMed] [Google Scholar]
- Brown P. Abnormal oscillatory synchronisation in the motor system leads to impaired movement. Current opinion in neurobiology. 2007;17:656–664. doi: 10.1016/j.conb.2007.12.001. [DOI] [PubMed] [Google Scholar]
- Brown P, Marsden CD. Bradykinesia and impairment of EEG desynchronization in Parkinson's disease. Movement disorders. 1999;14:423–429. doi: 10.1002/1531-8257(199905)14:3<423::aid-mds1006>3.0.co;2-v. [DOI] [PubMed] [Google Scholar]
- Brown P, et al. Dopamine dependency of oscillations between subthalamic nucleus and pallidum in Parkinson's disease. The Journal of neuroscience. 2001;21:1033–1038. doi: 10.1523/JNEUROSCI.21-03-01033.2001. [DOI] [PMC free article] [PubMed] [Google Scholar]
- Brown P, Williams D. Basal ganglia local field potential activity: character and functional significance in the human. Clinical Neurophysiology. 2005;116:2510–2519. doi: 10.1016/j.clinph.2005.05.009. [DOI] [PubMed] [Google Scholar]
- Burkhardt JM, et al. Synchronous oscillations and phase reorganization in the basal ganglia during akinesia induced by high-dose haloperidol. European Journal of Neuroscience. 2007;26:1912–1924. doi: 10.1111/j.1460-9568.2007.05813.x. [DOI] [PubMed] [Google Scholar]
- Cassidy M, et al. Movement-related changes in synchronization in the human basal ganglia. Brain. 2002;125:1235–1246. doi: 10.1093/brain/awf135. [DOI] [PubMed] [Google Scholar]
- Chu Chen C, et al. Neuronal activity in globus pallidus interna can be synchronized to local field potential activity over 3–12 Hz in patients with dystonia. Experimental neurology. 2006;202:480–486. doi: 10.1016/j.expneurol.2006.07.011. [DOI] [PubMed] [Google Scholar]
- Cruz AV, et al. Effects of dopamine depletion on network entropy in the external globus pallidus. Journal of neurophysiology. 2009;102:1092–1102. doi: 10.1152/jn.00344.2009. [DOI] [PMC free article] [PubMed] [Google Scholar]
- Degos B, et al. Chronic but not acute dopaminergic transmission interruption promotes a progressive increase in cortical beta frequency synchronization: relationships to vigilance state and akinesia. Cerebral Cortex. 2009;19:1616–1630. doi: 10.1093/cercor/bhn199. [DOI] [PubMed] [Google Scholar]
- Dejean C, et al. Dynamic changes in the cortex-basal ganglia network after dopamine depletion in the rat. Journal of neurophysiology. 2008;100:385–396. doi: 10.1152/jn.90466.2008. [DOI] [PubMed] [Google Scholar]
- DeLong MR, Georgopoulos AP. Motor functions of the basal ganglia. Comprehensive Physiology. 2011 [Google Scholar]
- Dostrovsky J, Bergman H. Oscillatory activity in the basal ganglia—relationship to normal physiology and pathophysiology. Brain. 2004;127:721–722. doi: 10.1093/brain/awh164. [DOI] [PubMed] [Google Scholar]
- Doyle L, et al. Levodopa-induced modulation of subthalamic beta oscillations during self-paced movements in patients with Parkinson's disease. European Journal of Neuroscience. 2005;21:1403–1412. doi: 10.1111/j.1460-9568.2005.03969.x. [DOI] [PubMed] [Google Scholar]
- Eusebio A, Brown P. Synchronisation in the beta frequency-band--The bad boy of parkinsonism or an innocent bystander? Experimental neurology. 2009;217:1–3. doi: 10.1016/j.expneurol.2009.02.003. [DOI] [PMC free article] [PubMed] [Google Scholar]
- Foffani G, et al. Subthalamic oscillatory activities at beta or higher frequency do not change after high-frequency DBS in Parkinson's disease. Brain research bulletin. 2006;69:123–130. doi: 10.1016/j.brainresbull.2005.11.012. [DOI] [PubMed] [Google Scholar]
- Foffani G, et al. 300-Hz subthalamic oscillations in Parkinson’s disease. Brain. 2003;126:2153–2163. doi: 10.1093/brain/awg229. [DOI] [PubMed] [Google Scholar]
- Frank MJ. Hold your horses: a dynamic computational role for the subthalamic nucleus in decision making. Neural Networks. 2006;19:1120–1136. doi: 10.1016/j.neunet.2006.03.006. [DOI] [PubMed] [Google Scholar]
- Gobbelé R, et al. Evaluation of Thalamocortical Impulse Propagation in the Akinetic Rigd Type of Parkinson's Disease Using High-Frequency (600 Hz) SEP Oscillations. Journal of Clinical Neurophysiology. 2008;25:274. doi: 10.1097/WNP.0b013e3181879d81. [DOI] [PubMed] [Google Scholar]
- Goldberg JA, et al. Spike synchronization in the cortex-basal ganglia networks of parkinsonian primates reflects global dynamics of the local field potentials. The Journal of neuroscience. 2004;24:6003–6010. doi: 10.1523/JNEUROSCI.4848-03.2004. [DOI] [PMC free article] [PubMed] [Google Scholar]
- Gustafsson F. Determining the initial states in forward-backward filtering. Signal Processing, IEEE Transactions on. 1996;44:988–992. [Google Scholar]
- Hadipour NA. Transmission of the subthalamic nucleus oscillatory activity to the cortex: a computational approach. Journal of computational neuroscience. 2003;15:223. doi: 10.1023/a:1025816909270. [DOI] [PubMed] [Google Scholar]
- Hanajima R, et al. Very fast oscillations evoked by median nerve stimulation in the human thalamus and subthalamic nucleus. Journal of neurophysiology. 2004;92:3171–3182. doi: 10.1152/jn.00363.2004. [DOI] [PubMed] [Google Scholar]
- Humphries MD, et al. A physiologically plausible model of action selection and oscillatory activity in the basal ganglia. The Journal of neuroscience. 2006;26:12921–12942. doi: 10.1523/JNEUROSCI.3486-06.2006. [DOI] [PMC free article] [PubMed] [Google Scholar]
- Kane A, et al. Dopamine-dependent high-frequency oscillatory activity in thalamus and subthalamic nucleus of patients with Parkinson's disease. Neuroreport. 2009;20:1549. doi: 10.1097/WNR.0b013e32833282c8. [DOI] [PubMed] [Google Scholar]
- Kang G, Lowery M. A model of pathological oscillations in the basal ganglia and deep brain stimulation in parkinson’s disease. IEEE. 2009:3909–3912. doi: 10.1109/IEMBS.2009.5333557. [DOI] [PubMed] [Google Scholar]
- Klostermann F, et al. Spatiotemporal characteristics of human intrathalamic high-frequency (>400 Hz) SEP components. Neuroreport. 1999;10:3627. doi: 10.1097/00001756-199911260-00030. [DOI] [PubMed] [Google Scholar]
- Kühn AA, et al. Modulation of beta oscillations in the subthalamic area during motor imagery in Parkinson's disease. Brain. 2006;129:695–706. doi: 10.1093/brain/awh715. [DOI] [PubMed] [Google Scholar]
- Kühn AA, et al. Event-related beta desynchronization in human subthalamic nucleus correlates with motor performance. Brain. 2004;127:735–746. doi: 10.1093/brain/awh106. [DOI] [PubMed] [Google Scholar]
- Kumar R, et al. Double-blind evaluation of subthalamic nucleus deep brain stimulation in advanced Parkinson's disease. Neurology. 1998;51:850–855. doi: 10.1212/wnl.51.3.850. [DOI] [PubMed] [Google Scholar]
- Lempka SF, et al. In vivo impedance spectroscopy of deep brain stimulation electrodes. Journal of neural engineering. 2009;6:046001. doi: 10.1088/1741-2560/6/4/046001. [DOI] [PMC free article] [PubMed] [Google Scholar]
- Levy R, et al. Dependence of subthalamic nucleus oscillations on movement and dopamine in Parkinson’s disease. Brain. 2002;125:1196–1209. doi: 10.1093/brain/awf128. [DOI] [PubMed] [Google Scholar]
- Llinás RR, et al. Thalamocortical dysrhythmia: a neurological and neuropsychiatric syndrome characterized by magnetoencephalography. Proceedings of the National Academy of Sciences. 1999;96:15222. doi: 10.1073/pnas.96.26.15222. [DOI] [PMC free article] [PubMed] [Google Scholar]
- López-Azcárate J, et al. Coupling between beta and high-frequency activity in the human subthalamic nucleus may be a pathophysiological mechanism in Parkinson's disease. The Journal of neuroscience. 2010;30:6667–6677. doi: 10.1523/JNEUROSCI.5459-09.2010. [DOI] [PMC free article] [PubMed] [Google Scholar]
- Lopiano L, et al. Deep brain stimulation of the subthalamic nucleus: clinical effectiveness and safety. Neurology. 2001;56:552–554. doi: 10.1212/wnl.56.4.552. [DOI] [PubMed] [Google Scholar]
- Magill PJ, et al. Relationship of activity in the subthalamic nucleus–globus pallidus network to cortical electroencephalogram. The Journal of neuroscience. 2000;20:820–833. doi: 10.1523/JNEUROSCI.20-02-00820.2000. [DOI] [PMC free article] [PubMed] [Google Scholar]
- Mallet N, et al. Parkinsonian beta oscillations in the external globus pallidus and their relationship with subthalamic nucleus activity. The Journal of neuroscience. 2008;28:14245–14258. doi: 10.1523/JNEUROSCI.4199-08.2008. [DOI] [PMC free article] [PubMed] [Google Scholar]
- Mallet N, et al. Disrupted dopamine transmission and the emergence of exaggerated beta oscillations in subthalamic nucleus and cerebral cortex. The Journal of neuroscience. 2008;28:4795–4806. doi: 10.1523/JNEUROSCI.0123-08.2008. [DOI] [PMC free article] [PubMed] [Google Scholar]
- Masimore B, et al. Transient striatal [gamma] local field potentials signal movement initiation in rats. Neuroreport. 2005;16:2021. doi: 10.1097/00001756-200512190-00010. [DOI] [PubMed] [Google Scholar]
- McAuley J. The physiological basis of clinical deficits in Parkinson’s disease. Progress in neurobiology. 2003;69:27–48. doi: 10.1016/s0301-0082(03)00003-0. [DOI] [PubMed] [Google Scholar]
- Noori HR, Jäger W. Neurochemical oscillations in the basal ganglia. Bulletin of mathematical biology. 2010;72:133–147. doi: 10.1007/s11538-009-9441-7. [DOI] [PubMed] [Google Scholar]
- Paradiso G, et al. Involvement of human thalamus in the preparation of self-paced movement. Brain. 2004;127:2717–2731. doi: 10.1093/brain/awh288. [DOI] [PubMed] [Google Scholar]
- Priori A, et al. Movement-related modulation of neural activity in human basal ganglia and its L-DOPA dependency: recordings from deep brain stimulation electrodes in patients with Parkinson's disease. Neurological Sciences. 2002;23:101–102. doi: 10.1007/s100720200089. [DOI] [PubMed] [Google Scholar]
- Ray N, et al. Local field potential beta activity in the subthalamic nucleus of patients with Parkinson's disease is associated with improvements in bradykinesia after dopamine and deep brain stimulation. Experimental neurology. 2008;213:108–113. doi: 10.1016/j.expneurol.2008.05.008. [DOI] [PubMed] [Google Scholar]
- Rouse A, et al. A chronic generalized bi-directional brain–machine interface. Journal of neural engineering. 2011;8:036018. doi: 10.1088/1741-2560/8/3/036018. [DOI] [PMC free article] [PubMed] [Google Scholar]
- Salih F, et al. Functional connectivity between motor cortex and globus pallidus in human non-REM sleep. The Journal of physiology. 2009;587:1071–1086. doi: 10.1113/jphysiol.2008.164327. [DOI] [PMC free article] [PubMed] [Google Scholar]
- Sarnthein J, Jeanmonod D. High thalamocortical theta coherence in patients with Parkinson's disease. The Journal of neuroscience. 2007;27:124–131. doi: 10.1523/JNEUROSCI.2411-06.2007. [DOI] [PMC free article] [PubMed] [Google Scholar]
- Shi L, et al. Neural responses in multiple basal ganglia regions during spontaneous and treadmill locomotion tasks in rats. Experimental brain research. 2004;157:303–314. doi: 10.1007/s00221-004-1844-y. [DOI] [PubMed] [Google Scholar]
- Silberstein P, et al. Patterning of globus pallidus local field potentials differs between Parkinson’s disease and dystonia. Brain. 2003;126:2597–2608. doi: 10.1093/brain/awg267. [DOI] [PubMed] [Google Scholar]
- Stanslaski S, et al. Design and Validation of a Fully Implantable, Chronic, Closed-Loop Neuromodulation Device With Concurrent Sensing and Stimulation. Neural Systems and Rehabilitation Engineering, IEEE Transactions on. 2012:1–1. doi: 10.1109/TNSRE.2012.2183617. [DOI] [PubMed] [Google Scholar]
- Theunissen F, Miller JP. Temporal encoding in nervous systems: a rigorous definition. Journal of computational neuroscience. 1995;2:149–162. doi: 10.1007/BF00961885. [DOI] [PubMed] [Google Scholar]
- Tisch S, et al. The basal ganglia: Anatomy, physiology, and pharmacology. Psychiatric Clinics of North America. 2004 doi: 10.1016/j.psc.2004.06.004. [DOI] [PubMed] [Google Scholar]
- van der Meer MAA, Redish AD. Low and high gamma oscillations in rat ventral striatum have distinct relationships to behavior, reward, and spiking activity on a learned spatial decision task. Frontiers in Integrative Neuroscience. 2009;3 doi: 10.3389/neuro.07.009.2009. [DOI] [PMC free article] [PubMed] [Google Scholar]


