Abstract
Background
We evaluated the profiles of allergic rhino-conjunctivitis and asthma patients annually in Antalya, a Mediterranean coastal city in Turkey.
Material/Methods
We evaluated patients’ allergic clinical status, and recorded the climate and pollens in the city center air, investigating any correlation between pollination, climatic conditions and allergic disorders. The meteorological conditions and the pollen count/cm2 during every month of the year and the concordance of this with the patient’s clinical status were evaluated.
Results
SPT positivity for plantago lanceolata, aspergillus fumigatus and d. pteronyssinus was significant in patients younger than 40 years old. Pollination levels are consistent from March 2010 to February 2011. In Antalya, high levels occur mostly from April to June, thus we performed skin prick tests mostly in May/June (~30%). During these months meteorological conditions of the city were windy with low humidity, without rain, and lukewarm temperatures, all of which contribute to high-risk conditions for seasonal allergies.
Conclusions
The major allergen between April and June was derived from Graminea; between February and March was Cupressus spp; and between March and June was Pinus spp. These results suggest that the pollination is correlated with allergic conditions and thus SPT might be best performed according to the pollen count.
Keywords: aero allergens, climate, allergic rhinoconjunctivitis, allergic asthma, Mediterranean coast
Background
Allergic rhinoconjunctivitis is a common health problem, with 2 forms: seasonal and perennial. The prevalence and etiology of allergic rhinoconjunctivitis varies from region to region and affects approximately 10%–20% of the population. Several studies have investigated the association between pollen exposure and asthma emergency admissions, but only 2 have investigated the effect of airborne allergens on consultations for rhinitis [1–3].
The prevalence of asthma, allergic rhinitis, and allergic eye disease is 8.2%, 10.8% and 7.5%, respectively, in Antalya, a city on the south coast of Turkey [4]. Asthma affects individuals of all ages and there is evidence that its prevalence is increasing [4–6]. Asthma is recognized as a complex condition with a wide range of severity, natural history, comorbidities, and response to treatment. It has been defined as “a common chronic disorder of the airways,” characterized by variable and recurring symptoms, airflow obstruction, bronchial hyper-responsiveness, and underlying inflammation [7]. There are various ways to classify asthma, although no universally accepted classification of subsets differing in severity exists. Symptoms in the most severe form of asthma, called “severe persistent allergic asthma,” are precipitated by allergen exposure [7–9].
Allergic disorders and rhinitis are increasing in prevalence, particularly in industrialized Western societies [9–11]. Allergic diseases are most likely caused by complex interactions between largely unknown genetic and environmental factors. A positive family history of atopic disease is often present; concordance between monozygotic twins is consistent with an important role for genetic factors [12]. Epidemiologic studies have also suggested a relationship between allergic rhinitis and diet, hygiene, and life-style, consistent with an effect of environmental factors on the development of allergic rhinitis [13]. Allergic rhinitis has a negative impact on socialization, well-being, quality of life, and employment [14,15]; all of which confirm that allergic rhinitis has a substantial socio-economic impact [10–20].
In the Antalya region, allergic disorders can be stimulated by allergens from local vegetation, including many types of herbs, plants and trees. The warm, humid climate also provides an ideal environment for mites and cockroaches, and recently the volume of industrial activity in the surrounding region has increased considerably. Because of its geographic localization, Turkey is a Mediterranean country with rich plant diversity; recent taxonomic studies reported more than 10,000 specimens. According to previous studies on the plants of Turkey and the urban plant flora of Antalya, there are 1069 species reported in the city center and 2473 in the surrounding area [21,22].
We used a skin prick test (SPT) and allergen-specific and total IgE levels to characterize 866 patients evaluated in the Clinics of Internal Medicine, Allergy and Clinical Immunology Division of the Antalya Training and Research Hospital. We also recorded the climate and pollens in the city center air to evaluate any correlation between pollination, climatic conditions, and clinical status of the allergic patients.
Material and Methods
Patients
The study was approved by the local ethics committee, and written consent was obtained from all patients and healthy volunteers. The study was conducted in Antalya between March, 2010 and February, 2011. Our study enrolled 866 of 2862 patients who had allergic rhinoconjunctivitis and asthma, and were found to have high total IgE levels, at the Allergy and Clinical Immunology Division of the Antalya Training and Research Hospital. SPT was performed on all of these 866 patients, and the positivity of the SPT and its accordance with the season was evaluated.
A questionnaire was used to obtain data to determine various socio-demographic characteristics including, age, sex, place of residence, allergens that exacerbate disease, and smoking status.
Allergic rhinoconjunctivitis and asthma were diagnosed by history, physical examination, high eosinophil count, total and allergen-specific IgE levels, respiratory function tests, and skin prick test results. A strong history of coughing spells, nasal drainage, nasal obstruction, itching sensation in the nose, tearing and itching in the eye, along with physical examination findings of pale and hypertrophic conchae, pale nasal mucosa, and the presence of nasal serous secretions, suggested allergic rhinitis.
Cases with symptoms suggesting allergic rhinitis, which also had eosinophilia and prick test positivity, were diagnosed as having allergic rhinitis. In other subjects with allergic rhinitis symptoms together with low prick test positivity, allergen-specific Ig E levels were used to confirm the diagnosis.
Laboratory methods
Total and specific IgE levels were determined by a fluoroenzyme immunoassay (ImmunoCAP-FEIA) method using an ImmunoCAP (Phar-macia, Uppsala, Sweden) kit. Values above 100 kU/L and 0.35 kU/L (total and specific IgE levels) were considered high.
Skin Prick Tests (SPT)
In all patients, skin prick tests on the forearm were performed using standardized latex extract containing high-ammonia natural rubber latex, and a full set of 35 common allergens. In addition, venom SPT was performed on 1 patient based on the subject’s clinical history. SPTs were performed by skilled nursing personnel. Positive tests were counted as wheals of 3 mm in diameter after 20 minutes. Tests were compared with positive histamine controls and negative saline controls. Commercial extracts used were manufactured by Alyostal ST-IR (Starallergenes S.A. – France). No intradermal tests were performed.
Pollination and climate follow up in the city
To measure pollination of the city center plants, we put the glycerine-gelatinated lam into the Durheim device, which was placed in 2 different locations in the city, at approximately 150 cm height. Each preparation was renewed weekly for a 1-year period and analyzed under microscopy for pollen counting and pollen identification per cm2. The Wodehouse method was used to define the pollens, which were further identified using the Turkish Atlas of Pollens and Turkish Natural Plants, Pollens and Bee Plants. Meteorologic data, including temperature, rain fall, rate and wind speed, were collected from the Turkish State Meteorological Service during the same time period, in order to allow for correlation between climate, pollination and allergic conditions.
Evaluation of the data
Statistical differences were assessed using SPSS software (version 14.00), chi-square test and percent ratios. Statistical significance was assumed for a p value of less than 0.05.
Results
Of the 866 patients studied, 92.8% of whom lived in the city center: 66.1% were females; 61.21% of these 866 patients had allergic rhinoconjunctivitis and 38.79% had asthma and allergic rhinoconjunctivitis; 16.3% of all cases were active smokers; and among all cases ~40% had increased symptoms with exposure to both active/passive cigarette smoking. Approximately the same numbers of patients with higher than 100 kU/L total IgE levels and who had allergen-specific IgE positivity, clustered in the age ranges 10–19, 20–29, 30–39 and 40–49, as shown in Table 1. Patients generally complained about allergic symptoms in February to June and most admissions to our clinic occurred in these months (mean monthly patients number: 72.17+39.9). Skin prick tests were performed mostly in May and June (combined ~30%) (Table 1).
Table 1.
Demographics for the patient group (n=866).
| Number of patients | Percentage% | |
|---|---|---|
| Sex | ||
| Male | 294 | 33.9 |
| Female | 572 | 66.1 |
| Age | ||
| 10–19 | 179 | 20.7 |
| 20–29 | 192 | 22.2 |
| 30–39 | 203 | 23.4 |
| 40–49 | 155 | 17.9 |
| 50–59 | 83 | 9.6 |
| 60+ | 54 | 6.2 |
| Clinical visit numbers per month | ||
| January | 59 | 6.8 |
| February | 92 | 10.6 |
| March | 86 | 9.9 |
| April | 104 | 12.0 |
| May | 152 | 17.6 |
| June | 127 | 14.7 |
| July | 55 | 6.4 |
| August | 40 | 4.6 |
| September | 48 | 5.5 |
| October | 24 | 2.8 |
| November | 40 | 4.6 |
| December | 39 | 4.5 |
All of the SPT results are shown in Table 2. Sensitivity for D was found in 61.4% of cases. Pteronyssinus, 81.2% for grass mix, 59.6% for barley mix, 54.4% for weed mix, and 50% for tree mix.
Table 2.
Skin prick test results for patients (n=866) and% positivity to different allergens.
| Test | x ±SD (mm) | Minimum maximum size (mm) | Positive Result | |
|---|---|---|---|---|
| Number of patients | Percentage of patients | |||
| Positive control | 11.15±3.79 | 1–24 | 863 | 99.6 |
| Negative control | 0.17±1.03 | 2–10 | 23 | 2.6 |
| Grass mix | 5.86±4.03 | 1–30 | 703 | 81.2 |
| Holcuslanatus | 4.14±4.08 | 3–23 | 512 | 59.1 |
| Dactylisglomerata | 4.75±4.40 | 3–26 | 594 | 68.6 |
| Loliumperenne | 4.56±4.29 | 1–28 | 568 | 65.6 |
| Phleumpratense | 3.46±3.76 | 3–21 | 452 | 52.2 |
| Poapratensis | 3.54±3.92 | 2–24 | 459 | 53.0 |
| Festucapratensis | 3.15±3.74 | 2–19 | 416 | 48.0 |
| Barley mix | 4.09±4.20 | 2–30 | 516 | 59.6 |
| Hordeumvulgare | 2.78±3.65 | 3–20 | 366 | 42.3 |
| Triticumsativum | 2.61±3.54 | 2–20 | 351 | 40.5 |
| Secalecereale | 2.32±3.63 | 2–22 | 316 | 36.5 |
| Avenasativa | 2.32±3.35 | 2–18 | 319 | 36.8 |
| Weed mix | 3.35±3.39 | 1–21 | 471 | 54.4 |
| Artemissiavulgaris | 3.26±3.21 | 3–14 | 477 | 55.1 |
| Urticadioica | 2.45±2.99 | 2–12 | 372 | 42.9 |
| Plantagolanceolata | 2.65±3.15 | 3–18 | 396 | 45.7 |
| Taraxacumofficianele | 2.46±3.33 | 3–20 | 353 | 40.8 |
| Tree mix | 3.22±3.46 | 3–21 | 433 | 50.0 |
| Alnusglutinosa | 2.40±3.19 | 3–18 | 337 | 38.9 |
| Corylusavellana | 2.42±3.50 | 3–44 | 326 | 37.6 |
| Populusalba | 2.52±3.12 | 3–13 | 366 | 42.3 |
| Salixcaprea | 2.69±3.08 | 2–11 | 397 | 45.8 |
| Betulaverricosa | 2.12±2.99 | 3–10 | 307 | 35.4 |
| Pinussilvestris | 1.45±2.68 | 3–10 | 207 | 23.9 |
| Quereusrobur | 2.58±3.03 | 3–10 | 386 | 44.6 |
| Robininapseudoacacia | 0.17±1.03 | 2–10 | 23 | 2.6 |
| Oleaauropeae | 3.57±3.48 | 3–18 | 491 | 56.7 |
| Epithelial allergens | ||||
| Dog | 3.30±3.14 | 2–10 | 486 | 56.1 |
| Cat | 2.91±3.26 | 3–15 | 415 | 47.9 |
| Horse | 0.08±0.71 | 4–9 | 10 | 1.1 |
| Fungal allergens | ||||
| Alternaria | 3.38±3.18 | 2–18 | 496 | 57.3 |
| Aspergillusfumigatus | 3.36±3.17 | 3–19 | 493 | 56.9 |
| Mite mix | ||||
| D. pteronyssinus | 3.88±3.69 | 3–36 | 532 | 61.4 |
| D. farinae | 3.95±4.54 | 3–45 | 517 | 59.7 |
| P. germanica | 0.07±0.70 | 4–11 | 9 | 1.0 |
| P. america | 0.03±0.39 | 3–8 | 4 | 0.5 |
| Blatella germanica | 2.73±3.32 | 3–35 | 457 | 52.8 |
Exacerbation of rhinitis and asthma symptoms was most commonly attributed to air pollution. SPT positivity for corylusavellana was significant in the age group of >40 years old. SPT positivity for plantagolanceolata, aspergillus fumigatus and D. pteronyssinus was significant in patients younger than 40 years old (Table 3), but there was no difference in SPT positivity between the males and females. As shown in Table 4, the sensitivity for the grass, barley, weed, and tree allergen mixtures of SPT was significantly increased in May and June. During the month of May, air pollination of gramineae was also increased (Table 5).
Table 3.
Age distribution (n=866) and mean SPT positivity.
| AGE | Corylusavellana X±SD (mm) | Aspergillus fumigatus X±SD (mm) | Dpteronyssinus X±SD (mm) | Plantagolanceolata X±SD (mm) |
|---|---|---|---|---|
| <40 | 2.21±3.14 | 3.59±3.12 | 4.12±3.78 | 3.00±3.49 |
| 40+ | 2.82±4.09 | 2.93±3.23 | 3.42±3.47 | 2.19±2.90 |
| Independent-samples t-test | p=0.02 | p=0.004 | p=0.008 | p=0.001 |
Table 4.
The most commonly detected months of the allergens.
| Allergens | Most common on … | % |
|---|---|---|
| Grass mix (n: 703) | May (n: 115), June(n: 97) | 30.2 |
| Barley mix (n: 516) | May (n: 94), June (n: 89) | 35.5 |
| Weed mix (n: 471) | May (n: 71), June (n: 71) | 30.1 |
| Tree mix (n: 433) | May (n: 77), June (n: 77) | 35.6 |
Table 5.
Monthly pollination ratios.
| March | April | May | June | July | August | September | October | November | December | January | February | Total | Total % | |
|---|---|---|---|---|---|---|---|---|---|---|---|---|---|---|
| Pinaceae | 62.1 | 125.9 | 56.2 | 24.5 | 3.1 | 0.0 | 1.6 | 1.3 | 0.6 | 0.4 | 0.0 | 0.0 | 275.7 | 19.0 |
| Cupressaceae | 84.9 | 8.2 | 2.7 | 1.1 | 0.0 | 0.0 | 0.0 | 0.0 | 0.0 | 0.0 | 0.0 | 65.3 | 162.2 | 11.2 |
| Gramineae | 0.6 | 4.0 | 202.9 | 78.6 | 51.1 | 22.9 | 13.4 | 1.8 | 0.4 | 0.0 | 0.0 | 0.0 | 375.7 | 25.9 |
| Ericaceae | 0.0 | 0.0 | 0.2 | 0.0 | 0.0 | 0.0 | 0.0 | 0.0 | 0.6 | 0.0 | 0.0 | 0.0 | 0.7 | 0.1 |
| Chenopodiaceae Amaranthaceae | 0.0 | 0.0 | 0.0 | 7.4 | 17.8 | 3.2 | 0.8 | 3.0 | 0.0 | 0.0 | 0.0 | 0.0 | 32.1 | 2.2 |
| Unidentified | 104.4 | 155.2 | 110.1 | 87.8 | 41.0 | 19.6 | 29.5 | 31.6 | 5.2 | 5.9 | 3.3 | 8.0 | 601.5 | 41.5 |
| Total | 252.0 | 293.3 | 372.1 | 199.3 | 113.0 | 45.6 | 45.3 | 37.7 | 6.7 | 6.3 | 3.3 | 73.3 | 1447.9 | 100.0 |
| Total % | 17.4 | 20.3 | 25.8 | 13.8 | 7.8 | 3.2 | 3.1 | 2.6 | 0.5 | 0.4 | 0.2 | 5.1 | 100.0 |
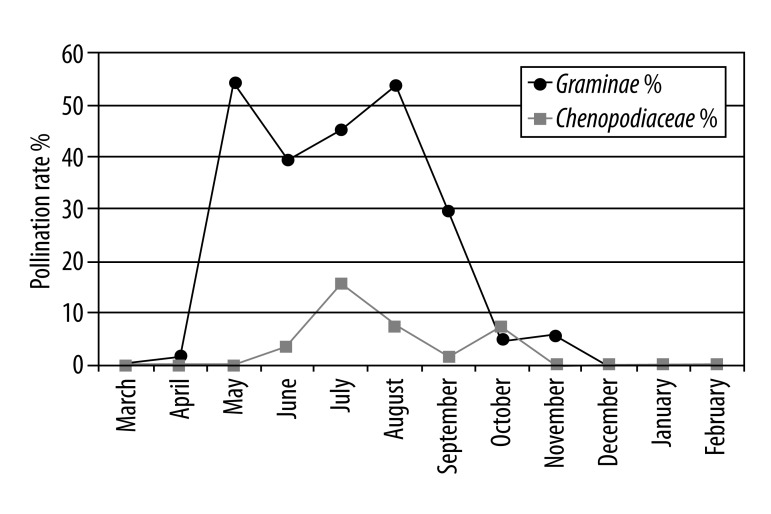
Most cases reported that their rhinitis symptoms were due to pollen and/or house dust mites (the second most common irritant). Pollen count per cm2 was recorded as 1447.9 over the whole year, with a maximum in May and minimum in January. The monthly pollen count for the city during a 1-year period is shown in Table 5. Pollens of Graminea plants known to be very allergic were frequently detected between May and November. The other pollen ratios are shown in Figure 1A.
Figure 1A.
Monthly pollination rates of Graminae and Chenopodiaceae in all pollens.
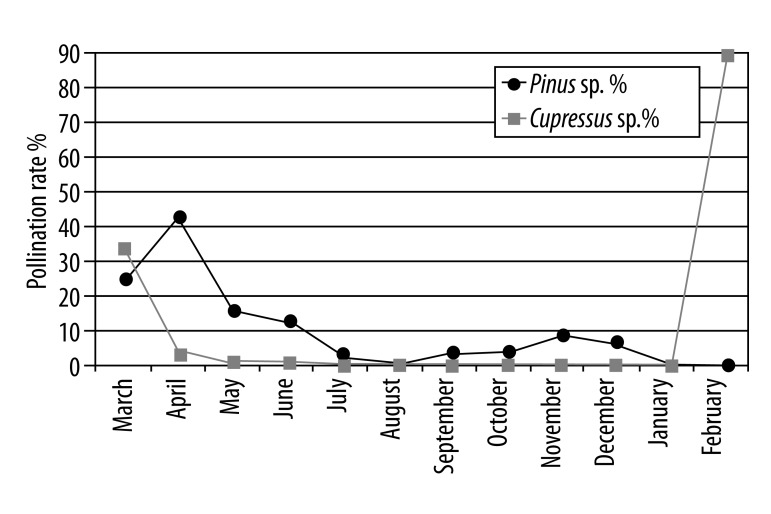
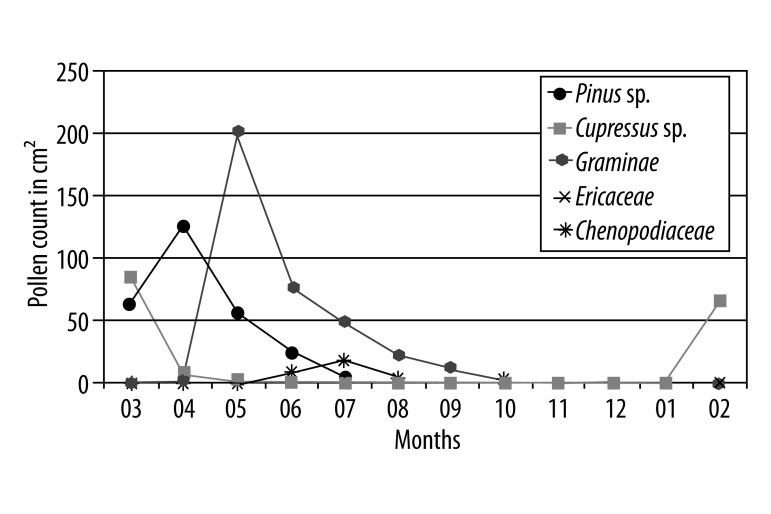
The densities of the allergenic pollens were determined throughout the year. Gramineae pollen, found in the atmosphere during May to July, generates 40% to 55% of the total pollen (Figure 1); Chenopodiaceae/Amaranthaceae pollens found during June to October generates 2% to 17% (Figure 1A); Pinaceae pollens found during March to December generate 2% to 42%; and Cupressaceae pollens found especially in February generate ~90% of the total pollen in the atmosphere, with periodic effects continuing from February to May (Figure 1B, 1C).
Figure 1B.
Monthly pollination rates of Pinus sp. and Cupressus sp. in all pollens.
Figure 1C.
Major allergens during a year period (count per cm2).
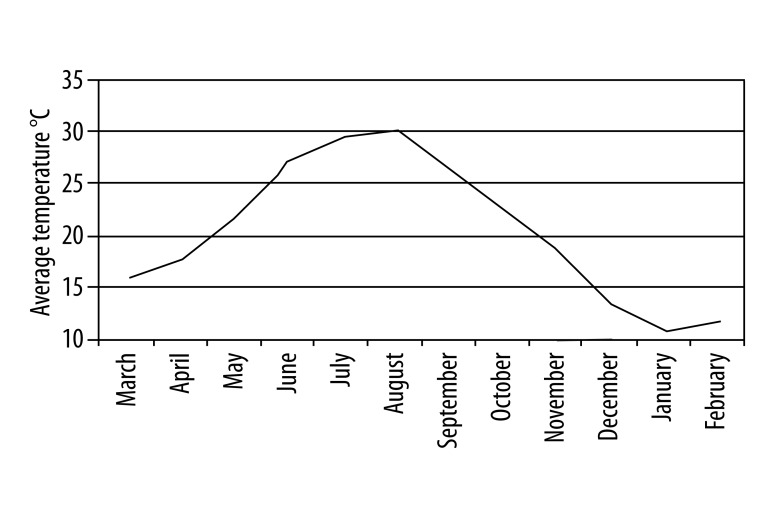
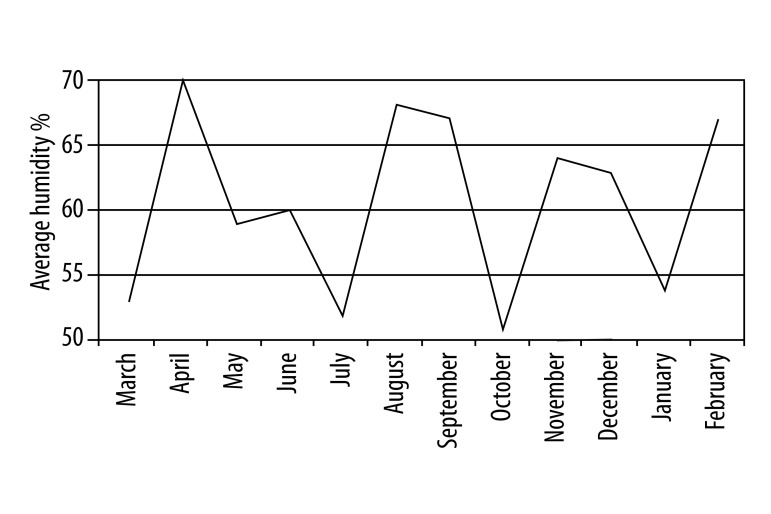
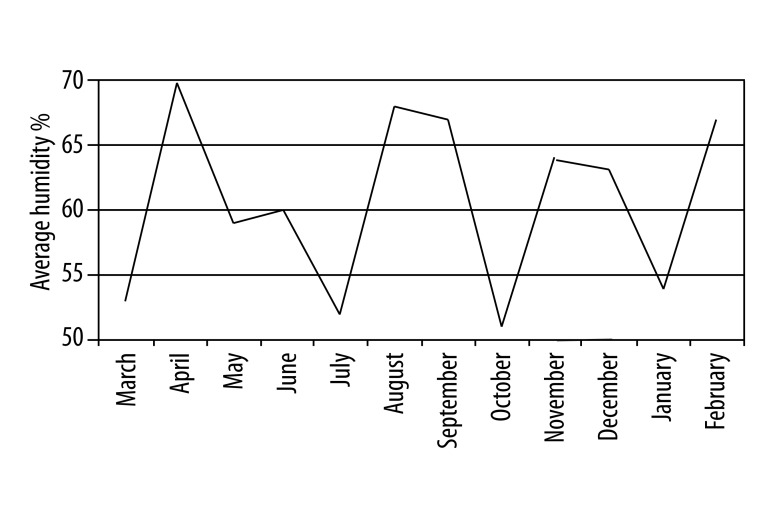
Temperature changes in Antalya during the year are shown in Figure 2. The average temperature was highest in July and August. The rainfall rate was at its minimum level between May and August (Figure 3), while wind speed was highest in the same period from May to June (Figure 4). Comparing these data and the patient numbers in the allergy and clinical immunology clinics, there was a significant concordance as shown in Table 1 (17.6% in May and 14.7% in June). Additionally, as shown in Figure 5, the increase of humidity in January and October was significant.
Figure 2.
Average monthly temperature (°C) in Antalya during 2010–2011.
Figure 3.
Monthly rainfall rate in Antalya during March 2010 and February 2011 (mm3).
Figure 4.
Monthly average wind speed (m/sec) in Antalya during March 2010 and February 2011.
Figure 5.
Monthly average humidity (%) in Antalya during March 2010 and February 2011.
Discussion
According to the so-called hygiene hypothesis, the increased rate of allergic diseases in city centers may be attributed to many factors, including improved hygienic conditions, a decreased infection rate in infancy and childhood, a sedentary lifestyle, and increased time spent indoors. These changes attenuate activation of the innate immune system and maturation of the acquired immune system. The immune system is thought to show Th-2 dominance during intrauterine life and infancy, and relies on challenge from infectious agents during development to drive Th-1 responses. The failure of this change leads to emergence of allergic diseases; the latter are more prevalent in industrialized countries with higher socioeconomic status, where infant immunization occurs and mycobacterial infections do not occur [5–9].
The diagnosis of allergic rhinitis is generally made before the age of 40. In our previous study, we reported that allergic rhinitis symptoms began during childhood, but firm diagnosis was often delayed until the second or third decades of life, with new diagnoses decreasing after the fourth decade [4]. The decrease in positive SPT rates with age, seen above, might reflect the greater amount of time spent indoors in older age groups, and a contributing effect on pollen exposure. Pollination schedules are consistent from year to year, and in Antalya occur mostly from April to June. Thus skin prick tests were performed mostly in May/June (~30%). During these months, the meteorological conditions of the city were windy with low humidity and without rain, and a warm climate, all of which makes for a climate perfect for allergies. Graminae was the major allergen between April and June; Cupressus spp between February and March; and Pinus spp between March and June. These results suggest that the pollination was correlated with the allergic conditions, and imply that SPT testing might be best performed according to the pollen count. When the wind speed and pollination was increased, we suggested that patients avoid green and open areas, and we gave them special lectures about the importance of regular medication use in order to avoid exacerbation of their symptoms.
It is hard to differentiate the specific risks for pollens that have the same pollination period; thus, time-series studies based on medication consumption are useful to highlight and to supervise pollen-related diseases requiring ambulatory care. In our study, there was an increase in Poacea, Fraxinus, and Betula pollens in relation to treated allergic rhinoconjunctivitis patients.
Dominancy of Quercus, Cupressaceae, Pinaceae, Morus, Betulaceae, Acer, Platanus, Fraxinus, Poaceae, and Ambrosia pollens were corroborated previously. There was a peak of early flowering weeds of Rumex and Typha and Poaceae and an overlap with tree pollens in April. While tree pollen accounted for 91.2%, weeds 3.8%, and grasses 3.2% of total annual pollen yield, biphasic seasons were noted for Poaceae and Ulmus. However there was a variation in overall pollen production from year to year, with high-production years for some species and low-production years for others. Cyclic pollination patterns of Alnus, Betulaceae, and Fagus were observed. Grass and weed pollen correlated positively with maximum temperature and dew point; however, the results for individual tree species were variable. Further investigation into year-to-year variation with respect to inherent cycling and meteorological influences is warranted [23]. In our study, pollen count per cm2 was recorded as 1447.9 over the whole year, with a maximum in May and minimum in January. Pollens of Graminea plants known to be very allergic were frequently detected between May and November.
The temperature changes in spring have clear impact on pollination. While there is an increase in the average temperature, the pollination occurs earlier and at higher levels. In this study, the pollens of Cupressaceae family were highly detected in March (beginning of spring) and pollens of the Graminea family mostly in late spring between April and October. A previous study reported from the south Mediterranean coast of Spain suggested the family of Cupressaceae pollens were the main allergens for patients. Other studies suggested that high humidity and low wind speed caused exacerbation of allergic reactions and asthma symptoms [24,25]. In our study, in late spring (especially in May) patients’ symptoms of allergic rhinitis and asthma were increased according to periods of low rain fall and high wind speed.
Cockroaches live at a temperature of 20–25°C, with a relative humidity of 60–70%, especially in kitchens and bathrooms. In Turkey, of 20 different species, Blatella germanica is most commonly found in Antalya. The reported cockroach sensitivity rate in adult asthma patients in Turkey varies between 4.3% and 36% [20], and was ~53% in this study. Our higher observed sensitivity rates might be due to the environment of Antalya, a city on the south coast, with a hot, humid Mediterranean climate. Eradication of cockroaches depends upon fastidious attention to hygiene and regular use of insecticides.
Our subjects are acutely aware of their clinical condition. As in all chronic diseases, knowing what is harmful and what is good for their health helps them cope with their disease more easily. Pollen allergies differ according to the pollens present in the atmosphere, which itself is a function of the flora of the region and the duration of the pollen season. Pollen allergies generally cause seasonal allergic rhinitis [3–7]. In our previous study [27,28], we found that the most frequent allergens were grass/cereal mixtures and dust mites. In this study, when we evaluated prick test results according to age groups, the SPT positivity decreased with increased age groups for grass and cereals. However, only the Plantagolanceolata and Corylusavellana sensitivity was statistically different by age.
Though allergic rhinitis is a chronic inflammatory disease, many patients have no regular treatment or have no treatment at all. Many drugs are already developed or under development for treatment of allergic diseases. Some of these drugs include inhibitors of pro-inflammatory cytokines, anti-IgE antibodies, drugs blocking adhesion molecules, and immune-biological agents including, eg, chemokine inhibitors [29–31]. Many studies have suggested markers that will enable us to monitor clinical improvement. Our earlier studies provided a novel perspective on severe persistent allergic asthma, using as markers serum sTRAIL, NO, MDA, H2O2, high sensitive CRP, total antioxidant capacity, and ceruloplasmin oxidase activity measurements [32–35] Avoidance of the inciting allergen is still the primary therapy for all allergic patients, and is a very effective treatment option, particularly for allergies to food, drugs and animal dander. However, there is great difficulty in avoiding mites and pollens that are present in the atmosphere in large amounts. For mites, measures to decrease the allergen “load” in the environment include frequent cleaning of pillows, coverlets, mattresses and toys. Carpets and rugs should be replaced with hard flooring, and chemical eradication of the mites should be considered.
Conclusions
In conclusion, this study provides important information linking a high prevalence of allergic diseases to environmental conditions. In our region of Turkey, Antalya, the prevalence of asthma is quite high because of the high temperature, moisture and dense pollination. Allergic rhinoconjunctivitis is the most common allergic disorder among occupants of “shanty-type” housing, and housewives suffer most frequently [3,4]. Allergens are known to exhibit regional variation in expression, which helps explain why allergen profiles and skin prick tests should be designed with reference to individual locales. From the observations in our clinic, grass, cereal mixtures, and mites were responsible for most cases of allergic rhinoconjunctivitis seen, with other important allergens linked to the flora and climate of the region, including olives and cockroaches. The high asthma prevalence in housewives and in people living in shanties may be due to exposure to house dust mites.
Acknowledgement
We thank all participating patients and volunteers. Ludwig. G. Strauss
Footnotes
Competing interests
The authors declare that they have no competing interests.
Source of support: Departmental sources
References
- 1.Charpin D, Pichot C, Calleja M. Trimming cypress tree hedges and its effects on subsequent pollination. Ann Allergy Asthma Immunol. 2011;106(3):259–60. doi: 10.1016/j.anai.2010.12.007. [DOI] [PubMed] [Google Scholar]
- 2.Fuhrman C, Sarter H, Thibaudon M, et al. Short-term effect of pollen exposure on antiallergic drug consumption. Ann Allergy Asthma Immunol. 2007;99(3):225–31. doi: 10.1016/S1081-1206(10)60657-6. [DOI] [PubMed] [Google Scholar]
- 3.International Rhinitis Management Working Group. International Consensus Report on the Diagnosis and Management of Rhinitis. Allergy. 1994;49(19):1–34. [PubMed] [Google Scholar]
- 4.Yalcin AD, Oncel S, Akcan A, et al. Prevalance of allergic asthma, rhinitis and conjunctivitis in over 16 year old individuals in Antalya. Turkiye Klinikleri J Med Sci. 2010;30:888–94. [Google Scholar]
- 5.Masoli M, Fabian D, Holt S, Beasley R Global Iniative for Asthma (GINA) Program. The global burden of asthma: executive summary of the GINA Dissemination Committee report. Allergy. 2004;59:469–78. doi: 10.1111/j.1398-9995.2004.00526.x. [DOI] [PubMed] [Google Scholar]
- 6.Bousquet J, Cabrera P, Berkman N, et al. The effect of treatment with omalizumab, an anti-IgE antibody, on asthma exacerbations and emergency medical visits in patients with severe persistent asthma. Allergy. 2005;60:302–8. doi: 10.1111/j.1398-9995.2004.00770.x. [DOI] [PubMed] [Google Scholar]
- 7.Lotvall J, Akdis C, Bacharier LB, et al. Asthma endotypes: A new approach to classification of disease entities within the asthma syndrome. J Allergy Clin Immunol. 2011;127:355–60. doi: 10.1016/j.jaci.2010.11.037. [DOI] [PubMed] [Google Scholar]
- 8.Moore WC, Pascual RM. Update in asthma 2009. Am J Respir Crit Care Med. 2010;181:1181–87. doi: 10.1164/rccm.201003-0321UP. [DOI] [PMC free article] [PubMed] [Google Scholar]
- 9.Von Hertzen L, Haahtela T. Disconnection of man and the soil: reason for the asthma and atopy epidemic? J Allergy Clin Immunol. 2006;117:334–44. doi: 10.1016/j.jaci.2005.11.013. [DOI] [PubMed] [Google Scholar]
- 10.Nicolaou N, Siddique N, Custovic A. Allergic disease in urban and rural populations: increasing prevalence with increasing urbanization. Allergy. 2005;60:1357–60. doi: 10.1111/j.1398-9995.2005.00961.x. [DOI] [PubMed] [Google Scholar]
- 11.Tariq SM, Matthews SM, Hakim EA, et al. The prevalence of and risk factors for atopy in early childhood: a whole population birth cohort study. J Allergy Clin Immunol. 1998;101:587–93. doi: 10.1016/S0091-6749(98)70164-2. [DOI] [PubMed] [Google Scholar]
- 12.Casolaro V, Georas SN, Song Z, Ono SJ. Biology and genetics of atopic disease. Curr Opin Immunol. 1996;8:796–803. doi: 10.1016/s0952-7915(96)80007-0. [DOI] [PubMed] [Google Scholar]
- 13.Cockburn IM, Bailit HL, Berndt ER, Finkelstein SN. Loss of work productivity due to illness and medical treatment. J Occup Environ Med. 1999;41:948–53. doi: 10.1097/00043764-199911000-00005. [DOI] [PubMed] [Google Scholar]
- 14.Malone DC, Lawson KA, Smith DH, et al. A cost of illness study of allergic rhinitis in the United States. J Allergy Clin Immunol. 1997;99:22–27. doi: 10.1016/s0091-6749(97)70296-3. [DOI] [PubMed] [Google Scholar]
- 15.Bener A, Safa W, Abdulhalik S, Lestringant GG. An analysis of skin prick test reactions in asthmatics in a hot climate and desert environment. Allergy Immunol. 2002;34:281–86. [PubMed] [Google Scholar]
- 16.Arbes SJ, Jr, Gergen Pj, Elliott L, Zeldin DC. Prevalences of positive skin test responses to 10 common allergens in the US population: results from the third National Health and Nutrition Examination Survey. J Allergy Clin Immunol. 2005;116:377–83. doi: 10.1016/j.jaci.2005.05.017. [DOI] [PubMed] [Google Scholar]
- 17.Roul S, Léauté-Labrèze C, Perromat M, et al. Sensitization to cockroach allergens evaluated by skin tests in children with atopic dermatitis. Ann Dermatol Venereol. 2001;128:115–17. [PubMed] [Google Scholar]
- 18.Seedat RY, Claassen J, Claassen AJ, Joubert G. Mite and cockroach sensitisation in patients with allergic rhinitis in the Free State. S Afr Med J. 2010;100:160–63. doi: 10.7196/samj.3669. [DOI] [PubMed] [Google Scholar]
- 19.Bunnag C, Jareoncharsri P, Tantilipikorn P, et al. Epidemiology and current status of allergic rhinitis and asthma in Thailand – ARIA Asia-Pacific Workshop report. Asian Pac J Allergy Immunol. 2009;27:79–86. [PubMed] [Google Scholar]
- 20.Karaman O, Turgut CS, Uzuner N, et al. aletermination of asthma, rhinitis, eczema, and atopy prevalence in 9- to 11-year-old children in the city of Izmir. Allergy Asthma Proc. 2006;27:319–24. doi: 10.2500/aap.2006.27.2877. [DOI] [PubMed] [Google Scholar]
- 21.Kutluk H, Aytug B. Airborne pollen flora of a deciduous mesic forest in Turkey. Bangladesh J. Plant Taxon. 2010;17(1):23–31. [Google Scholar]
- 22.Gokturk RS, Sumbul H. A New Species of Cephalaria (Dipsacaceae) from South Anatolia, Turkey. Ann Bot Fennici. 1997;34:153–55. [Google Scholar]
- 23.Kosisky SE, Marks MS, Nelson MR. Pollen aeroallergens in the Washington, DC, metropolitan area: a 10-year volumetric survey (1998–2007) Ann Allergy Asthma Immunol. 2010;104(3):223–35. doi: 10.1016/j.anai.2010.01.005. [DOI] [PubMed] [Google Scholar]
- 24.Diaz De La Guardia C, Alba F, De Linares C, et al. Aerobiological and allergenic analysis of cupressaceae pollen in Granada. JIACI. 2010;(16):24–33. [PubMed] [Google Scholar]
- 25.Marinho S, Simpson A, Custovic A. Allergen avoidance in the secondary and tertiary prevention of allergic diseases: does it work? Prim Care Respir J. 2006;15:152–58. doi: 10.1016/j.pcrj.2006.02.005. [DOI] [PMC free article] [PubMed] [Google Scholar]
- 26.Sever ML, Arbes SJ, Jr, Gore JC, et al. Cockroach allergen reduction by cockroach control alone in low-income urban homes: a randomized control trial. J Allergy Clin Immunol. 2007;120:849–55. doi: 10.1016/j.jaci.2007.07.003. [DOI] [PMC free article] [PubMed] [Google Scholar]
- 27.Yalcin AD, Ozdemir L, Polat HH. Evaluation of Socio-Demographic characteristics of Patients Receiving Spesific Immunotherapy In Antalya. 029: oral presentation, APSR; 3–6 November 2011; China, Respirology. p. 191. [Google Scholar]
- 28.Yalcin AD, Gumuslu S, Parlak GE, Bisgin A. Soluble TRAIL as a marker of efficacy of allergen-spesific immunotherapy in patients with allergic rhinoconjunctivitis. Med Sci Monit. 2012;18(10):CR617–21. doi: 10.12659/MSM.883488. [DOI] [PMC free article] [PubMed] [Google Scholar]
- 29.Melvin TA, Patel AA. Pharmacotherapy for allergic rhinitis. Otolaryngol Clin North Am. 2011;44:727–39. doi: 10.1016/j.otc.2011.03.010. [DOI] [PubMed] [Google Scholar]
- 30.Gautrin D, Malo JL. Risk factors, predictors, and markers for work-related asthma and rhinitis. Curr Allergy Asthma Rep. 2010;10:365–72. doi: 10.1007/s11882-010-0131-1. [DOI] [PubMed] [Google Scholar]
- 31.Gratziou C, Rovina N, Makris M, et al. Breath markers of oxidative stress and airway inflammation in Seasonal Allergic Rhinitis. Int J Immunopathol Pharmacol. 2008;21:949–57. doi: 10.1177/039463200802100419. [DOI] [PubMed] [Google Scholar]
- 32.Yalcin AD, Bisgin A, Kargi A, Gorczynski RM. Serum soluble TRAIL levels in patients with severe persistent allergic asthma: its relation to Omalizumab treatment. Med Sci Monit. 2012;18(3):PI11–15. doi: 10.12659/MSM.882504. [DOI] [PMC free article] [PubMed] [Google Scholar]
- 33.Yalcin AD, Gorczynski RM, Parlak GE, et al. Total antioxidant capacity, hydrogen peroxide, malondialdehyde and total nitric oxide concentrations in patients with severe persistent allergic asthma: its relation to omalizumab treatment. Clin Lab. 2012;58(1–2):89–96. [PubMed] [Google Scholar]
- 34.Yalcin AD, Gumuslu S, Parlak GE, et al. Systemic Levels Of Ceruloplasmin Oxidase Activity In Allergic Asthma And Allergic Rhinitis. Immunopharmacol Immunotoxicol. 2012;34(6):1047–53. doi: 10.3109/08923973.2012.697902. [DOI] [PubMed] [Google Scholar]
- 35.Yalcin AD, Bisgin A. The Relation of s. TRAIL Levels and Quality of Life In Omalizumab Using Severe Persistent Allergic Asthma Patients. Med Sci Monit. 2012;18(8):LE9–10. doi: 10.12659/msm.883249. [DOI] [PubMed] [Google Scholar]


