

Abstract
Using data from the New Immigrant Survey, we examine the religious beliefs and practices of new legal immigrants to the United States. We find that Christian immigrants are more Catholic, more Orthodox, and less Protestant than American Christians, and that those immigrants who are Protestant are more likely to be evangelical. In addition to being more Catholic and more Orthodox than American Christians, the new immigrants are also paradoxically less Christian, with a fifth reporting some other faith. Detailed analysis of reported church attendance at places of origin and in the United States suggest that immigration is a disruptive event that alienates immigrants from religious practice rather than “theologizing” them. In addition, our models clearly show that people who join congregations in the United States are highly selected and unrepresentative of the broader population of immigrants in any faith. In general, congregational members were more observant both before and after emigration, were more educated, had more cumulative experience in the United States, and were more likely to have children present in the household and be homeowners and therefore yield biased representations of all adherents to any faith. The degree of selectivity and hence bias also varies markedly both by religion and nationality.
The United States stands out among developed nations for its high degree of religiosity. Compared with people in other wealthy nations, Americans are far more likely to profess a religion and to attend services regularly (Baker 2004; Hamilton and Form 2003). Historical studies of immigration recognized this fact and explicitly incorporated religion into accounts of immigrant adaptation and assimilation (Handlin 1951). Indeed, Herberg (1960) argued that religious participation was a critical step in the process of becoming American, with churches providing the social structure to support and sustain ethnic communities while facilitating intermarriage within major religious groups (Greeley 1971), yielding Kennedy's (1944) famous “triple melting pot” of Protestant, Catholic, and Jew. Religious participation figured prominently in Gordon's (1964) canonical account of assimilation, with churches acting to facilitate the “structural assimilation” of immigrants and their children. Smith (1978) went further and argued that immigration itself was a “theologizing experience,” with immigrants responding to the challenges of resettlement by turning to religion, yielding benefits in the form of mutual assistance and support.
Oddly enough, in early studies of the new wave of immigrants to the United States, religion did not figure very prominently (Cadge and Ecklund 2007). Studies done in the 1960s ad 1970s generally critiqued the concept of the melting pot (Glazer and Moynihan 1963; Greeley 1971; Novak 1972) and later work done in the 1980s reconsidered assimilation empirically in light of these critiques (Alba 1985; Lieberson and Waters 1988; Portes and Bach 1985). These empirical studies led, in turn, to re-formulations of assimilation theory (Portes and Rumbaut 1990; Alba 1990; Portes and Zhou 1993; Alba and Nee 2003). All the while, immigration scholars paid little attention to religion.
In the early 1990s, however, Kivisto (1992) took the field to task for failing to consider the role of religion in the assimilation process, an omission he found particularly glaring in light of the growing dissimilarity between the religious affiliations of immigrants and natives (see Wuthnow 2008). Sociologists responded by undertaking a series of case studies of immigrant congregations and religious organizations (see Warner and Wittner 1998; Ebaugh and Chafetz 2000; Min and Kim 2002 for anthologies), and these investigations generally confirmed Smith's (1978) view that immigration was indeed a “theologizing experience.” Debate generally focused on whether participation in immigrant congregations yielded a “bridge” promoting immigrant assimilation or a “boundary” inhibiting it (Warner 1997; Cadge and Ecklund 2006).
Whatever one's view, as religion came to be accepted as an important mediator between immigrants and society, sociologists began once more to incorporate it into their thinking and models. Hagan and Ebaugh (2003) offered concrete empirical examples of how religion was used instrumentally by immigrants to advance their interests in the United States, and Hirschman (2004) argued that religion offered immigrants three critical benefits: refuge, resources, and respect. Portes and Rumbaut (2006) viewed religious practice as source of social capital and an important variable determining the path of assimilation within a segmented social structure. Stark and Finke (2000) went so far as to posit the existence of “spiritual capital,” which they defined as “the degree of mastery of and attachment to a particular religious culture” (p. 120). In the context of immigration, spiritual capital has been posited to yield tangible benefits in the form of assistance as well as intangible benefits in the form of faith and forbearance (Ebaugh 2003; Hagan 2008).
Despite enthusiasm for the theologizing hypothesis among immigration researchers, literature from the sociology of religion was more guarded in its assessment of the relationship between migration and faith. On the one hand, Wuthnow and Christiano (1979) argued that migration was inherently disruptive and led to reduced participation after a move. On the other hand, Warner (1998) argued that “the distinctive need of people in a mobile, heterogeneous society to link themselves with others of their own kind” would make religion “more salient” for immigrants.In addition, a large literature suggests that immigrant status is just one of many factors affecting religious participation, including age (Alanezi and Sherkat 2008; Argue, Johnson, and White 1999; Campbell and Curtis 1994; Connor 2008; Firebauch and Harley 1991; Ploch and Hastings 1994; van Tubergen 2006), gender (Abusharaf 1998; Alenazi and Sherkat 2008 George, 1998; Hout and Greeley 1987; Lummis 2004; Miller and Hoffman 1995; Miller and Stark 2002; Min 1992; Stark 2002; van Tubergen 2006;), marital and family status (Alenazi and Sherkat 2008; Campbell and Curtis 1994; Connor 2008; Iannaccone 1990; Kurien 2002; Smith, Sikkink, and Bailey 1998; Tilikainen 2003; Veglery 1998; van Tubergen 2006), education ((Alenazi and Sherkat 2008; Connor 2008; Kelly and De Graaf 1997; Ploch and Hastings 1994; Smith, Sikkink, and Bailey 1998; van Tubergen 2006), and employment (Campbell and Curtis 1994; Edgell 2005; Finke and Stark 1992; Iannaccone 1990; van Tuberen 2006).
Because most of the foregoing independent variables are correlated with the propensity to move as well as the propensity to participate religiously, ideally they should be controlled statistically in multivariate models to isolate the independent effect of immigration. In addition, one other factor that obviously affects participation is the strength of a person's religious beliefs (Ploch and Hastings 1998) and this variable also is associated with the propensity to migrate (Chiswick 2003). Alanezi and Sherkat (2008) found, for example, that European immigrants in the United States are more religious than Europeans in general; and in general people who are more involved in religious activities at home are less likely to move abroad (Myers 2000). In theoretical terms, greater religious involvement at home generates more location-specific religious capital that is not easily transferable, thus deterring out-migration (Myers 200; Chiswick 2003).
Among immigrants, religious participation is also likely to be affected by conditions at the place of destination, including the share of co-religionists, the proportion foreign born, and the diversity of local religious beliefs (Connor 2009a). Although Stark and Iannaccone (1995) argue that religious diversity promotes greater competition for adherents and thus higher rates of participation, evidence on this topic is mixed (Chaves and Gorski 2001) and studies among immigrants generally find a negative relation between religious diversity and participation within areas of destination (Connor 2009a, 2009b; Tubergen 2006). Larger concentrations of foreigners also appear to depress participation by providing other avenues for cultural affirmation and ethnic reproduction besides religion (Alanezi and Sherkat 2008; Kelly and De Graaf 1997; van Tubergen 2006; Connor 2009b). As one might expect, however, a higher concentration of co-religionists in the place of destination increases the degree of religious participation among immigrants (Connor 2009a, 2009b) though overall religiosity at points of destination seems to depress participation (van Tubergen 2006).
Despite many quantitative studies of the determinants of religious participation done by sociologists of religion, most of the evidence marshaled so far on the theologizing hypothesis comes from qualitative studies of particular religious congregations. Locating immigrant subjects through religious congregations carries a significant risk of selection on the dependent variable, however, because people who belong to a congregation tend to be more religious and thus more likely to report faith and practice as central in their lives. According to Ebaugh (2003:237-38), “the major challenge in future projects is to move beyond idiosyncratic cases…to develop generalizations that go beyond endless descriptions… and arrive at conclusions that are testable.” Cadge and Ecklund (2007) echo this sentiment and call for “more research about individuals based on systematic survey data.”
The few studies done to date using representative quantitative data generally do not support the theologizing hypothesis. In his study of immigrants to Quebec, for example, Connor (2008) found a slight decrease in participation before and after arrival, a drop that also prevailed among immigrants to Canada generally (Connor 2009b). Likewise, in his analysis of immigrants to the United States Connor (2009a) found an even larger drop in participation that was robust to a variety of individual and contextual controls. In this paper we build on these analyses by using nationally representative data on legal U.S. immigrants to study shifts in religious participation before and after arrival in the United States, breaking down results by major religion and, where appropriate, by denomination. Multivariate analysis of these data confirm that the most common and immediate response to international migration is a decline, not an increase, in the level of religious participation, in contradiction to the theologizing hypothesis.
Source of Data
The data for our analysis come from the first wave of the New Immigrant Survey, a probability sample of newly arrived legal immigrants who received permanent residence documents during a seven-month period in 2003. The survey's stratified design under-sampled spouses of U.S. citizens (about a third of new legal immigrants) and over-sampled those entering on employment and diversity visas (two categories that are small but in which was much interest). In order to reach sampled individuals as soon as possible after admission, samples were drawn in eight sequential batches, or replicates, with the first and last including a half-month's worth of immigrants and the remaining batches including six full months. The average time between receipt of permanent residence and interview was just 17 weeks and 8,573 respondents were surveyed with a response rate of 69%. Not all those receiving permanent resident status are just arriving in the United States, of course, many are already in the country and are simply “adjusting status” from a temporary to a permanent visa.
In addition to the main sampled immigrant, project investigators also interviewed the spouse if he or she was living in the household (another 4,334 persons) and up to two co-resident children aged 8-12 (1,072 additional subjects). The questionnaire gathered information on virtually every social, economic, and behavioral dimension relevant to immigration and compiled detailed histories of migration, schooling, employment, earnings, language acquisition, and health. To ensure sample coverage and data quality, all respondents were interviewed in the language of their choice, yielding conversations in English, Spanish, Chinese, Russian, French, and Korean, plus 80 other spoken languages as well as sign language.
The NIS was launched with financial support from a variety of sources, including the National Institute of Child Health and Human Development, the National Institute on Aging, the National Science Foundation, the U.S. Department of Health and Human Services, and the U.S. Department of Homeland Security. A special grant from the Pew Charitable Trusts allowed the inclusion of a special module on religious belief and participation that contained standardized questions on religious affiliations and behaviors recommended by the Social Science Research Council. The information analyzed here come from questions that asked respondents about their beliefs and practices before they left for the United States and after becoming legal permanent residents.
Religious Affiliations of Immigrants Versus Natives
Preliminary tabulations revealed no significant shift in religious belief as a result of immigration. Across all religions, 90%-95% of adult respondents reported adhering to the religion in which they were raised and most of the movement was into the “no religion” category and had occurred prior to coming to the United States. Although we neither expected nor found religious beliefs to change because of immigration, the religious distribution of immigrants obviously has important implications for assimilation the extent that it resembles or contrasts with the religious distribution of Americans generally (Wuthnow 2005).
Table 1 thus shows the religious affiliations reported by respondents to the New Immigrant Survey along with those of spouses and children. The latter may not all be immigrants, given that an important pathway to legal immigration is marriage to an American citizen and those adjusting status may have American-born children. We compare these distributions with the distribution of religious affiliations reported by Americans generally, as estimated by the American Religious Identification Survey (see Kosmin, Mayer, and Keysar 2007). Although the NIS data pertain to the year 2003 and the ARIS data to 2001, we do not expect the distribution of American religious beliefs to have changed significantly in just two years. The contrast thus offers a good comparison of the distribution of faiths among immigrants and other residents of the United States.
Table 1.
Current religious affiliation of new adult immigrants to the United States 2003.
| Religious Affiliation | U.S Adults 18+ 2001 | New Immigrant Survey 2003 | ||
|---|---|---|---|---|
| Respondents | Spouses | Children | ||
| Christian | 81.0 | 66.5 | 63.7 | 67.4 |
| Catholic | 25.9 | 41.3 | 38.7 | 43.7 |
| Orthodox | 0.3 | 8.7 | 8.2 | 7.4 |
| Protestant | 54.8 | 16.5 | 16.8 | 16.3 |
| Non-Christian | 4.0 | 20.1 | 20.3 | 17.1 |
| Muslim | 0.6 | 7.0 | 6.2 | 5.6 |
| Jewish | 1.4 | 1.3 | 1.7 | 1.2 |
| Buddhist | 0.6 | 4.3 | 3.6 | 2.8 |
| Hindu | 0.4 | 5.6 | 6.7 | 5.5 |
| Other | 1.0 | 1.9 | 2.1 | 2.0 |
| No Religion | 15.0 | 13.4 | 14.2 | 13.2 |
| N | 196,615 | 8,239 | 6,091 | 5,712 |
As one might expect, the three right-hand columns indicate that spouses and children report essentially the same religious beliefs as adult respondents. The differences we observe are slight. Compared with adult respondents, slightly fewer spouses reported a Christian affiliation and slightly more reported no religion. The children of respondents, meanwhile, were slightly less likely to report themselves as non-Christian; but among both respondents and spouses, the relative number of Orthodox and Protestant adherents was about the same. The relative deficit of Christians in the spouse category stems from a small shortfall in the relative number of Catholics. In general, however, religious differences between spouses, children, and respondents are small and statistically insignificant.
Given this fact, we turn to focus on comparisons between adult immigrant respondents and the U.S. adult population, and here the differences are sharper and indeed statistically quite significant. As can be seen, immigrants are far less likely to be Christian than are Americans; and among those who are Christian, immigrants are far more likely to be Catholic or Orthodox than Protestant. Whereas 81% of adult Americans are Christian and 55% are Protestant, only 67% of new immigrants reported themselves to be Christian and just 17% were Protestant. Likewise, just 0.3% of Americans are Orthodox and 26% Catholic, but among new immigrants the respective figures were 9% and 41%.
Whereas non-Christians together constitute only 4% of the U.S. population, they made up 20% of the 2003 cohort of new immigrants. Thus the representation of non-Christians among arriving immigrants is five times that in the U.S. population. Although Jews are represented at roughly the same level among Americans and new immigrants (1.4% and 1.3%, respectively), Muslims, Buddhists, and Hindus are substantially over-represented compared with the U.S. population. Muslims comprise 7% of new immigrants but just 0.6% of all Americans; and for Buddhists the respective figures are 4.3% for immigrants and 0.6% for Americans, whereas for Hindus the figures are 5.6% for immigrants and 0.4% for Americans.
Although “other” non-Christian religions are also slightly more common among immigrants than among U.S. adults—1.9% compared with 1.0%—those professing no religion are slightly under-represented among new immigrants. Whereas 12% of immigrants said they had no religion, the figure was 15% for adult Americans. Thus today's immigrants are slightly more likely to subscribe to a religious affiliation than most Americans, but the denominations they do affiliate with are quite different from the population generally, with relatively more Catholics, Orthodox Christians, Muslims, Buddhists, and Hindus, and relatively fewer Protestants, but about the same frequency of Jews.
Not only are there relatively few Protestants among new immigrants to the United States, there are few from America's most common Protestant denominations. Table 2 compares the distribution of immigrants and American Protestants by denomination. In the U.S. population generally, the largest Protestant denominations are Baptists (28%) and Methodists (12%), with a relatively large share (37%) located outside of the main denominations and simply classified as “Other Protestants.” Whereas only 8% of adult Americans profess an Evangelical or Pentecostal religion, among new immigrants the figure is 41%, representing by far the largest category of protestant belief. The next closest denomination is Baptists, with 18%, followed by Seventh Day Adventists at 11%. Thus, although as a group Protestants may comprise a relatively small fraction of new immigrants to the United States those Protestants who do come are much more likely to come from the evangelical end of the religious spectrum than American Protestants generally.
Table 2.
Distribution of protestant denominations in the U.S. adult population and the New Immigrant Survey.
| Protestant Denomination | US Adults | NIS Respondents |
|---|---|---|
| Seventh Day Adventist | 0.6 | 11.3 |
| Anglican-Episcopal | 2.8 | 9.5 |
| Baptist | 27.5 | 17.6 |
| Evangelical-Pentecostal | 8.3 | 41.2 |
| Lutheran | 7.8 | 5.6 |
| Methodist | 11.5 | 5.4 |
| Presbyterian-United Church of Christ | 4.5 | 8.4 |
| Other Protestant | 37.0 | 1.0 |
| Total | 100.0 | 100.0 |
Quite clearly, then, the religious preferences of new immigrants to the United States are quite different from those prevailing in the United States generally. A common measure of the degree of difference between two distributions is the index of dissimilarity, which varies from a theoretical minimum of 0, if there were no differences between immigrants and U.S. residents with respect to religion, to a theoretical maximum of 100, which would occur if immigrants and U.S. residents were to have no religion in common (see White 1986). When this index is computed for the immigrant and American distributions shown in Table1 the resulting coefficient is 40.0, which means that 40% of all new immigrants to the United States would have to shift their religious affiliation to have the same distribution as natives.
As one would expect, the distribution of religious beliefs among immigrants varies considerably by their region of origin. Table 3 breaks down the adherents of different religions by region and country. As shown in the top panel, most Christian immigrants come from Latin America. Among immigrants from this region, more than 85% profess a Christian belief—65% are Catholic, 4% Orthodox, and 17% Protestant. According to Jenkins (2002), however, only about a tenth of Latin Americans are Protestant, so this denomination is over-represented among those migrating to the United States. Next in relative importance among Christian immigrants are Africans, among whom 23% said they were Catholic, 10% Orthodox, and 33% Protestant, adding up to around two-thirds of the total. Unlike Latin American immigrants, however, a significant plurality of African immigrants (22%) are Muslim. Immigrants from Europe and Central Asia constitute the third most Christian immigrant stream, with more than 60% of all new permanent residents professing a Christian faith—17% Catholic, 29% Orthodox, and 15% Protestant. Europeans, however, are more likely than Africans or Latin Americans to abjure religion altogether, with 17% professing no faith at all.
Table 3.
Religious affiliation of respondent by country and region of birth.
| Region or Country | Christian | Non-Christian | None | |||||
|---|---|---|---|---|---|---|---|---|
| Catholic | Orthodox | Protestant | Muslim | Jewish | Buddhist | Hindu | ||
| Region of Birth | ||||||||
| Europe and Central Asia | 17.4 | 28.9 | 15.1 | 13.8 | 3.2 | 0.7 | 0.0 | 17.3 |
| Asia and the Pacific | 4.5 | 2.3 | 8.2 | 27.9 | 0.0 | 28.2 | 8.4 | 16.9 |
| Latin America | 64.7 | 3.8 | 17.0 | 0.9 | 0.6 | 0.5 | 3.6 | 5.6 |
| Middle East & N. Africa | 8.0 | 14.0 | 5.4 | 56.0 | 10.1 | 0.0 | 0.0 | 4.2 |
| Sub-Saharan Africa | 22.8 | 10.4 | 33.4 | 22.3 | 0.8 | 0.0 | 2.4 | 4.4 |
| Country of Birth | ||||||||
| Mexico | 81.9 | 3.0 | 6.9 | 0.0 | 0.0 | 0.0 | 0.0 | 4.5 |
| India | 4.2 | 1.1 | 6.3 | 6.2 | 0.0 | 0.5 | 62.7 | 1.2 |
| Philippines | 82.9 | 1.8 | 13.5 | 0.2 | 0.0 | 0.0 | 0.0 | 0.2 |
| China | 2.7 | 3.7 | 7.1 | 0.0 | 0.0 | 13.0 | 0.3 | 72.5 |
| El Salvador | 63.6 | 7.2 | 19.4 | 0.0 | 0.2 | 0.0 | 0.0 | 6.2 |
| Dominican Republic | 81.9 | 2.1 | 10.1 | 0.0 | 0.0 | 0.0 | 0.0 | 3.5 |
| Vietnam | 22.8 | 6.0 | 1.3 | 0.0 | 0.0 | 47.5 | 0.0 | 22.1 |
| Guatemala | 52.2 | 9.3 | 27.2 | 0.0 | 0.0 | 0.0 | 0.0 | 10.4 |
| Russia | 1.5 | 49.3 | 10.3 | 0.0 | 11.4 | 0.0 | 0.0 | 27.3 |
| Jamaica | 8.6 | 9.3 | 60.0 | 0.0 | 0.0 | 0.0 | 0.0 | 15.8 |
| Korea | 13.4 | 7.4 | 61.2 | 0.0 | 0.0 | 7.3 | 0.0 | 10.5 |
| Haiti | 46.1 | 1.5 | 44.5 | 0.0 | 0.0 | 0.0 | 0.0 | 6.2 |
| Ukraine | 8.8 | 48.9 | 18.0 | 0.0 | 7.1 | 0.0 | 0.0 | 16.9 |
| Poland | 96.2 | 0.0 | 0.0 | 0.0 | 0.0 | 0.0 | 0.0 | 3.4 |
Roughly the same share of immigrants from Asia and the Pacific reported no religious preference; but as one would expect, non-Christian religions predominated among those professing a religion, with around 28% being Muslim, the same share Buddhist, and 8% Hindu. Relatively few immigrants from Asia are Christian—with just 5% Catholic, 2% Orthodox, and 8% Protestant. Not surprisingly, the most Muslim of all immigrant streams is from the Middle East and North Africa, where 56% followed the teachings of the Prophet Mohammed. It is also the most Jewish of immigrant steams, however, with 10% professing belief in the God of Abraham. There are also significant numbers of Christians from the Middle East---about 27% overall, with 8% being Catholic, 14% Orthodox, and 5% Protestant. Thus, the flow of immigrants from the Middle East and North Africa is simultaneously more Muslim, more Jewish, and more diverse than flows from other regions.
The bottom panel of Table 2 shows the distribution of religious affiliations among immigrants from selected sending nations. As one would expect, immigrants from Mexico, the Philippines, the Dominican Republic, and Poland are overwhelmingly Catholic, with representations of 82% or greater. In the last several decades, however, Evangelical Protestants have made substantial inroads into traditionally Catholic nations in Central America. Thus 19% of immigrants from El Salvador and 27% of those from Guatemala said they were Protestant. Although the distribution of faiths in Guatemala is not known, El Salvador is presently about 57% Catholic and 24% Protestant (CIA World Factbook 2010), meaning that Salvadoran immigrants roughly reflect the religious composition of the country.
The two most Protestant immigrant streams among the countries shown are from Jamaica and Korea, where 60% and 61% of all immigrants profess a Protestant faith. Whereas a 60% share is roughly comparable to the proportion of Protestants in Jamaica (62%), it is much greater than that in Korea (20%), indicating that Korean immigration to the United States is highly selective of Protestant Christians (CIA World Factbook 2010). Protestants are also over-represented among Haitian immigrants, who are about evenly divided between Catholics (46%) and Protestants (45%), whereas the nation itself is 80% Catholic and 19% Protestant (CIA World Factbook 2010).
The most Buddhist stream comes from Vietnam, where 48% follow teachings of the Bodhisattva. Nonetheless, reflecting its historical colonization by France, nearly a quarter of all Vietnamese immigrants (23%) said they were Catholic. Given that just 9% of all Vietnamese are Buddhist and 7% Catholic whereas 81% profess no religion at all, religious people–whether Christian or Buddhist—are very much over-represented among Vietnamese immigrants to the United States (CIA World Factbook 2010). As one would logically expect, the most Hindu of all immigrant streams is India, with 63% professing this religion, compared with 6% Moslems and around 12% Christians. Despite the large Hindu majority, however, Christians are substantially over-represented among Indian immigrants as only 2% of all Indians profess this belief. In contrast, Moslems are under-represented among Indian immigrants, comprising only 6% of immigrants compared with 13% of the Indian population (CIA World Factbook 2010).
The most Orthodox immigrants come from Russia and the Ukraine, where nearly half (49% in both cases) follow this creed. In the case of Russia, however, the Orthodox are substantially over-represented, as recent estimates put the number of practicing Orthodox at just 15%-20% nationally, whereas among Ukrainian immigrants the Orthodox are under-represented, given that they comprise upwards of 80% of all Ukrainians (CIA World Factbook 2010). Russian immigrants also evince a relatively high share of non-believers (27%), though this is significantly less than the share in Russia as a whole (estimated to be at least 60%); but by far the most irreligious country of all is China, which is officially atheist and where no more than 10% profess a belief in any religion (CIA World Factbook 2010). Nearly three quarters of all immigrants from China (73%) report no religion at all. Nonetheless religious believers are over-represented among immigrants to the United States, with 13% reporting themselves as Buddhists, 7% as Protestants, 4% as Orthodox, and 3% as Catholics. Both Russia and China are former communist nations, of course, and the rate of non-belief is also elevated among immigrants from communist Vietnam, with 22% expressing no religious preference. In no other country did the rate of non-affiliation exceed 17%, and it was exceptionally low among immigrants from the Philippines (0.2%), India (1.2%), Poland (3.4%), and the Dominican Republic (3.5%). With a few notable exceptions, therefore, immigrants to the United States are a religious lot, even though their specific faiths may be quite different than those of most Americans.
Religious Practice Before Immigration
Obviously, in adapting to American society a substantial share of new immigrants must bridge a significant religious divide. The social distance to be traversed depends not only on nominal differences in religious affiliation, however, but also on the intensity of devotion. Religious differences between immigrants and natives are a matter of practice as well as preference. Protestants, Catholics, Muslims, Hindus, and Jews who are relatively secularized and who profess only nominal adherence to the faith of their ancestors may be quite close to one another in terms of values, beliefs, and behaviors. In contrast, those who are devout believers and faithful practitioners of religious rituals may be quite distant from one another, as well as from American natives, in terms of values and behaviors. For this reason, we consider the intensity of religious practice among immigrants both before and after arrival in the United States.
A key determinant of religious practice in the United States is likely to be the devotional behavior already established by immigrants in their countries of origin. In order to measure the strength religious practice before departing for the United States, adult respondents to the New Immigrant Survey were asked about the frequency with which they attended religious services in their country of last residence. Responses to this query are summarized for Christians and non-Christians in Table 4. As can be seen, the response categories range from “never” to “more than once a day.” For ease of presentation, we have grouped them into five broad categories: never, sporadically (less than once a year, 1-2 times a year, or several times a year), regularly (once a month or 2-3 times a month), frequently (nearly every week, every week, or several times a week), and very frequently (every day or more than once a day).
Table 4.
Frequency of attendance at religious services in country of last residence by Christian and non-Christian new immigrants to the United States.
| Frequency | Christians | Non-Christians | Total |
|---|---|---|---|
| Never | 6.4 | 20.9 | 9.7 |
| Sporadically | |||
| Less than once a year | 2.4 | 3.5 | 2.7 |
| 1-2 times a year | 5.8 | 10.4 | 6.8 |
| Several times a year | 7.0 | 12.6 | 8.3 |
| Total | 15.2 | 26.5 | 17.8 |
| Regularly | |||
| Once a month | 7.1 | 9.0 | 7.5 |
| 2-3 times a month | 7.9 | 5.6 | 7.3 |
| Total | 15.0 | 14.6 | 14.8 |
| Frequently | |||
| Nearly every week | 4.4 | 2.7 | 4.0 |
| Every week | 45.8 | 18.4 | 39.6 |
| Several times a week | 10.3 | 4.1 | 8.9 |
| Total | 60.5 | 25.2 | 52.5 |
| Very Frequently | |||
| Every day | 2.8 | 10.7 | 4.6 |
| More than once a day | 0.2 | 2.3 | 0.7 |
| Total | 3.0 | 13.0 | 5.5 |
| Number | 5,420 | 1,616 | 7,036 |
In general, Christian immigrants report a much higher frequency of service attendance than non-Christians. Whereas 21% of those professing a non-Christian faith said they never attended services prior to leaving for the United States, the figure was just 6% for Christians. Likewise, whereas 27% of non-Christians reported sporadic attendance in the home country, the figure was just 15% for Christians. In other words, nearly half (47%) of all non-Christian immigrants did not attend services more than a few times a year, compared with just 21% of Christian immigrants.
This difference in the distribution of religious practice between Christians and non-Christians does not stem from a difference in “regular” service attendance (i.e. multiple times per month), the frequency of which stood at about 15% in both groups. Rather, it reflects a pronounced difference in the commonality of “frequent” attendance (weekly or more). Whereas 61% of Christian immigrants attended services this frequently, the figure was just 25% for non-Christian immigrants. Indeed, nearly half (46%) of Christian immigrants said they attended religious services on a weekly basis, compared with just 18% among non-Christians; and another 10% of Christian immigrants said they went to services more than once a week.
Relatively few Christians, however, admitted to attending services once a day or more—just 3%. In contrast, among non-Christian immigrant, the share attending more than once a day was before emigration was 13%. Thus non-Christians displayed some tendency to concentrate at the extremes of religious practice, with 21% never attending services and 13% at once a day or more, compared with respective figures of only 6% and 3% for Christian immigrants.
Some of the differences in religious practice between Christian and non-Christian immigrants no doubt reflects contrasting expectations about church going across religious traditions, not just individual differences in proclivities toward involvement. Table 5 divides Christian immigrants into three major denominational categories and tabulates the frequency of service attendance separately for Catholic, Orthodox, and Protestant immigrants. The standout Christian denomination is clearly the Orthodox. As a group, Orthodox Christians are much less likely to attend services. Whereas 64% of Catholics and 61% of Protestants said they attended church frequently (that is, nearly every week, every week, or several times a week), only 44% of Orthodox did so. Compared with the other two Christian faiths, the Orthodox were much more likely to attend sporadically (24% compared with 15%-16% for Catholics and Protestants) or not at all (9% compared with just 5% of Catholics).
Table 5.
Frequency of attendance at religious services in country of last residence among new Christian immigrants to the United States.
| Frequency | Catholic | Orthodox | Protestant |
|---|---|---|---|
| Never | 4.8 | 9.1 | 9.0 |
| Sporadically | |||
| Less than once a year | 2.1 | 2.0 | 3.5 |
| 1-2 times a year | 4.7 | 9.6 | 6.4 |
| Several times a year | 6.2 | 12.8 | 5.9 |
| Total | 15.0 | 24.4 | 15.8 |
| Regularly | |||
| Once a month | 8.1 | 8.4 | 3.9 |
| 2-3 times a month | 7.9 | 10.8 | 6.3 |
| Total | 16.0 | 19.2 | 10.2 |
| Frequently | |||
| Nearly every week | 4.3 | 4.2 | 4.8 |
| Every week | 53.9 | 29.5 | 34.5 |
| Several times a week | 5.9 | 9.9 | 21.4 |
| Total | 64.1 | 43.6 | 60.7 |
| Very Frequently | |||
| Every day | 2.2 | 3.7 | 4.0 |
| More than once a day | 0.1 | 0.2 | 0.2 |
| Total | 2.3 | 3.9 | 4.2 |
| Number | 3,358 | 709 | 1,353 |
Table 6 shows the distribution of service attendance among non-Christian groups. Obviously, there is much greater variation in the frequency of attendance among non-Christian than Christian immigrants. Whereas the share of Christians who said they never attended church before coming to the United States ranged from 5% to 9% across denominations, the range for non-Christians went from 9% among Hindus to 33% among Muslims, with Jews and Buddhists in-between at 19% and 21% respectively. At the same time, the share of Christians who said they attended services “frequently” ranged from 44% to 64%, compared with figures of just 9% among Buddhists, 20% among Jews, 27% among Muslims, and 34% among Hindus. In general, non-Christian groups tended to be more evenly spread across frequency categories than Christians, indicating a greater diversity of religious practice among them.
Table 6.
Frequency of attendance at religious services in country of last residence among new non-Christian immigrants to the United States.
| Frequency | Muslim | Jewish | Buddhist | Hindu |
|---|---|---|---|---|
| Never | 32.7 | 18.9 | 21.2 | 9.2 |
| Sporadically | ||||
| Less than once a year | 3.0 | 5.9 | 6.2 | 1.6 |
| 1-2 times a year | 7.4 | 15.6 | 17.7 | 9.3 |
| Several times a year | 9.0 | 15.8 | 22.5 | 12.0 |
| Total | 19.4 | 37.2 | 46.4 | 22.9 |
| Regularly | ||||
| Once a month | 4.0 | 9.2 | 12.7 | 11.5 |
| 2-3 times a month | 3.3 | 3.8 | 7.8 | 6.4 |
| Total | 7.3 | 13.0 | 20.5 | 17.9 |
| Frequently | ||||
| Nearly every week | 2.0 | 1.8 | 1.6 | 4.5 |
| Every week | 21.6 | 14.7 | 6.5 | 22.1 |
| Several times a week | 3.5 | 3.2 | 0.8 | 7.3 |
| Total | 27.1 | 19.7 | 8.9 | 33.9 |
| Very Frequently | ||||
| Every day | 9.6 | 6.8 | 2.3 | 15.1 |
| More than once a day | 3.9 | 4.3 | 0.7 | 1.0 |
| Total | 13.5 | 11.2 | 3.0 | 16.1 |
| Number | 563 | 103 | 348 | 456 |
Religious Practice After Immigration
Given the recency of arrival of most immigrants interviewed by the NIS, it is not possible to assess the frequency of service attendance in the United States using the same question that was used for attendance in countries of origin. Many of the immigrants had been in the country only a few months and were not in a position to assess how many times per year they attended services. In order to assess religious practice after admission to permanent residence, the NIS simply asked each respondent how many times he or she had attended services since receiving their residence visa. We then computed the time elapsed between this visa date and the date of the interview to derive a relative frequency, which we divided into six attendance categories: never, less than once a month, 1-2 times per month, 3 times per month, 4 times per month, and 5+ times per month. The distribution of Christian denominations with respect to these categorizations is shown in Table 7, along with an overall monthly average.
Table 7.
Frequency of attendance at religious services since coming to the United States among new Christian immigrants to the United States.
| Frequency | Catholic | Orthodox | Protestant | All Christians |
|---|---|---|---|---|
| Never | 29.2 | 34.3 | 23.0 | 27.5 |
| < 1 time per month | 9.3 | 11.9 | 8.4 | 9.3 |
| 1-2 times per month | 30.3 | 23.0 | 22.3 | 26.8 |
| 3 times per month | 8.7 | 7.0 | 8.8 | 9.3 |
| 4 times per month | 8.7 | 7.8 | 10.5 | 10.0 |
| 5+ times per month | 13.8 | 16.1 | 27.0 | 17.1 |
| Monthly Average | 2.6 | 3.2 | 4.4 | 3.1 |
| Number | 3,159 | 639 | 1,180 | 4,978 |
Protestants generally attended religious services most frequently in the United States—an average of 4.4 times per month. Indeed, more than a quarter—some 27%—said they went five or more times per month. Another 11% went four times per month and 22% went 1-2 times per month. Some 23% said they had not attended church since coming to the United States. Next in order of devotion were Orthodox Christians, who reported an average of 3.2 church visits per month, followed by Catholics at 2.6 visits per month. Compared with Protestants both groups were less likely to attend services on a monthly basis and were more likely to have never set foot in a church since arriving. Whereas just 23% of Protestants reported no church attendance in the United States, the figure was 34% among the Orthodox and 29% among Catholics.
Table 8 repeats the analysis of post-immigration attendance for non-Christian groups. Whereas the average Christian attended 3.1 religious services per month after achieving permanent resident status, among non-Christians the figure was only 1.8 times per month. These averages understate underlying differences in religious practice, however, because frequencies of service attendance for non-Christians are concentrated at the bottom of the distribution with a long tail extending upward (thus pulling averages higher). In contrast, frequencies among Christian denominations are concentrated in the middle of the distribution. Whereas just 28% of Christians reported no service attendance in the United States, the share was 68% among both Muslims and Buddhists. Jewish immigrants registered the greatest diversity of attendance among non-Christian immigrants, with 43% not going to synagogue or temple at all in the United States, 22% going 4-5 times a month, and 24% going 1-2 times a month.
Table 8.
Frequency of attendance at religious services since coming to the United States among new non-Christian immigrants to the United States.
| Frequency | Muslim | Jewish | Buddhist | Hindu | All Non-Christians |
|---|---|---|---|---|---|
| Never | 67.5 | 43.6 | 68.2 | 34.3 | 53.0 |
| < 1 time per month | 7.8 | 7.0 | 7.8 | 15.7 | 10.4 |
| 1-2 times per month | 11.4 | 23.9 | 14.7 | 31.3 | 20.3 |
| 3 times per month | 3.4 | 3.7 | 3.1 | 3.7 | 4.0 |
| 4 times per month | 3.4 | 5.8 | 1.4 | 6.5 | 4.1 |
| 5+ times per month | 6.5 | 16.0 | 4.8 | 8.4 | 8.2 |
| Monthly Average | 1.3 | 3.5 | 1.0 | 2.0 | 1.8 |
| Number | 592 | 85 | 293 | 569 | 1,663 |
When we compare religious participation before and after admission to permanent residence, it quickly becomes clear that immigration to the United States is generally associated with a reduction in the frequency of service attendance, in contradiction to the theologizing hypothesis. To demonstrate this fact we computed a common metric of the frequency of attendance before and after immigration and plotted it in Figure 1. For each religious group, the clear bar shows the percentage of immigrants who reported attending services at least once a week in the country of origin and the shaded bar shows the percentage who reported attending at least once a week in the United States. Christian groups are arrayed to the left of the graph and non-Christian groups to the right.
Figure 1. Percentage of new immigrants attending services at least once a week before and after immigration to the United States.

Note: Authors' calculations using NIS 2003-1. Population aged 18 and older. Overseas respondents were excluded.
Obviously in each case we observe a sharp decline in the frequency of attendance after coming to the United States, a shift that is most pronounced among Christians, who before immigration displayed the greatest frequency of religious attendance. Among all Christians taken together, the frequency with which respondents reported attending services at least once a week fell from 56% before immigration to 27% afterward. The sharpest drop was observed among Catholics, where the percentage fell from 60% to 23%. In contrast, the drop among Orthodox Christians was only from 39% to 24% whereas Protestants went from 56% to 37%.
Some of these declines in service attendance no doubt reflect reduced access to appropriate religious facilities in the United States. Given the relatively small number of Orthodox Christians in the nation, on average we would expect Orthodox immigrants to live farther away from the nearest church than either Catholics or Protestants. While access to appropriate places of worship may explain the drop in Orthodox attendance after immigration, however, it cannot account for the decline in mass attendance among Roman Catholics, who enjoy access to a well established diocesan system with churches spread throughout the country, especially in regions where Catholic immigrants are prone to settle. For Catholics, and probably Protestants as well, the drop in attendance tells us more about the effect of the move than about access to places of worship.
Non-Christians evinced less of a drop in attendance, to a large extent because they had less to lose given that they were much less likely to attend services frequently before emigrating. Among all non-Christians taken together, the share who attended services at least once a week fell from 23% before immigration to 12% afterward. The drop was greatest for Muslims, who went from 25% before to10% afterward, and Hindus, who went from 29% to 15%. In both cases, the drop could very well reflect a reduced access to appropriate places of worship. However, Buddhists evinced little change before and after immigration, and Jews actually reported a slight increase in the frequency of attendance. Whereas 18% of Jewish immigrants attended temple at least once a week before emigrating, 22% did so afterward.
The influence of relative access to places of worship is probably more likely to be expressed in terms of non-attendance rather than as a drop in the frequency of attendance. After all, if no church or temple exists within one's locality, the frequency of attendance is a moot point. Figure 2 thus depicts the percentage of immigrants who said they never attended religious services before and after immigration. In all cases the share of non-attenders increases, often quite dramatically. Among Christians, the average rate of non-attendance rose from 6% before immigration to 28% afterward. Among Catholics, the increase was from 5% to 29%, among Orthodox from 9% to 34%, and among Protestants from 9% to 23%.
Figure 2. Percentage of immigrants who never attended services before and after immigration to the United States.

Note: Authors' calculations using NIS 2003-1. Population aged 18 and older. Overseas respondents were excluded.
Among non-Christians, the frequency of non-attendance, which was already relatively high before immigration, rose to very high levels in the United States. After immigration, a majority of non-Christian immigrants (54%) never attended religious services, up from 21% in their countries of origin. Roughly two-thirds of Muslims and Buddhists said they had not been to a religious service since arriving in the United States, compared with respective figures of 33% and 21% before departure. Although the shift was not as extreme for Jewish and Hindu immigrants, the frequency of non-attendance nonetheless rose from 19% to 44% among the former and from 9% to 34% among the latter.
Differences in Practice by National Origin
Clearly, in most religions something occurs in the course of migration to the United States that increases the rate of non-attendance and lowers the frequency of church-going among attendees. Below we investigate how attendance varies with time spent in the United States; but in addition to duration, the frequency of religious practice also varies by national origin, as Table 9 indicates. Here we present the number of services attended per month in the United States among Christians from specific nations. The top panel shows frequencies for Catholics from the eight largest Catholic sending nations. The middle panel shows frequencies for Orthodox immigrants from the two most important Orthodox sending nations; and the bottom panel shows attendance frequencies for Protestants from the six leading sources of Protestant immigrants.
Table 9.
Frequency of attendance at religious services since coming to the United States among selected religious and national origin groups asmong new immigrants to the United States.
| Religion and Nationality | Number of Services per Month | Average | |||||
|---|---|---|---|---|---|---|---|
| Never | <1 | 1-2 | 3-4 | 4 | 5+ | ||
| Catholic | |||||||
| Dominican Republic | 49.2 | 9.2 | 26.8 | 5.8 | 4.4 | 4.6 | 1.0 |
| El Salvador | 28.4 | 9.5 | 34.8 | 6.7 | 7.1 | 13.5 | 2.4 |
| Guatemala | 31.5 | 6.2 | 29.6 | 7.8 | 9.7 | 15.3 | 2.7 |
| Haiti | 31.4 | 4.5 | 30.1 | 5.8 | 7.6 | 20.6 | 2.9 |
| Mexico | 29.6 | 9.0 | 32.4 | 8.9 | 7.1 | 13.0 | 2.4 |
| Philippines | 15.8 | 8.8 | 20.3 | 15.1 | 18.4 | 21.6 | 4.7 |
| Poland | 11.1 | 8.9 | 28.8 | 21.0 | 19.9 | 10.3 | 2.7 |
| Vietnam | 8.8 | 1.8 | 23.8 | 18.4 | 22.7 | 24.5 | 6.7 |
| Orthodox | |||||||
| Russia | 52.2 | 12.2 | 16.1 | 0.0 | 3.1 | 16.4 | 5.6 |
| Ukraine | 40.2 | 6.8 | 23.0 | 12.1 | 0.7 | 17.3 | 2.5 |
| Protestant | |||||||
| El Salvador | 23.2 | 6.7 | 20.4 | 4.5 | 9.0 | 36.1 | 6.2 |
| Guatemala | 13.5 | 7.5 | 16.2 | 11.0 | 9.1 | 42.8 | 6.1 |
| Haiti | 17.7 | 2.4 | 20.8 | 20.4 | 18.6 | 20.3 | 3.8 |
| Jamaica | 33.1 | 16.8 | 28.0 | 9.9 | 5.6 | 7.5 | 2.2 |
| Korea | 7.5 | 2.5 | 12.5 | 7.1 | 19.6 | 50.9 | 7.0 |
| Philippines | 14.7 | 8.2 | 30.1 | 12.7 | 10.6 | 23.8 | 4.4 |
These data reveal a remarkable variation of religious practice among people of different nationality who nominally share the same faith. Among Catholics, for example, the average frequency of U.S. church attendance ranges from 1.0 per month for Dominicans to 6.7 times per month for the Vietnamese. Indeed, whereas around half of Vietnamese Catholics said they attended mass at least four times a month, about the same fraction of Dominicans reported never going to mass at all. The average frequency of church attendance was also high among Catholics from the Philippines at 4.7 times per month, with around 40% attending at least once a week. Among Catholics from the remaining nations, attendance was more modest, with the average frequency varying narrowly from 2.4 to 2.9 times per month.
We also find a substantial range in attendance patterns between Russian and Ukrainian Orthodox immigrants. On average, Russians reported attending services 5.6 times per month after arrival in the United States, compared with 2.5 times per month for Ukrainians. In both cases, however, the distribution was skewed toward the top and bottom, rendering averages problematic as representations of “typical” immigrant behavior. The bi-modality of the frequency distribution was especially pronounced among Russians, who either attended church a lot or not at all. Whereas half of all Russians had never attended services after coming to the United States, almost a fifth reported going at least four times per month. A similar, though less extreme, division is observed among Ukrainians.
In keeping with the emerging theme of national origin diversity among Christian denominations, Protestants also display a wide range of attendance frequencies, with the average varying from 2.2 to 7.0 times per month. By far the most dedicated practitioners of Protestant Christianity are the Koreans, 70%??? of whom attended services at least four times a month since arriving in the united States—almost seven times the share (7.5%) who said they never went to church. At the other extreme are Jamaicans, with an average of 2.2 times per month. Only 14% of Jamaicans reported four or more visits to church per month and a third said they never went at all. Haitian Protestants are also frequent practitioners of Protestantism, but with an average frequency of church attendance of 3.8 times per month they are closer to Jamaicans than Koreans. Some 18% of Haitians said they had never been to church since coming to the United States, but 39%??? said they had gone at least four times a month.
Filipino immigrants are next up from the bottom with an average attendance of 4.4 times per month and 34% going at least once a month and 15% not attending at all. Protestants from Guatemala and El Salvador are also relatively devout. With average frequencies of 6.1 and 6.2 times per month, their rate of religious participation nearly equaled that of Koreans; and roughly 45%??? of each group said they went to church at least four times a month. Among Catholics, the relative frequency of church attendance in the United States is mainly a story about the degree to which they were able to hold onto high rates of attendance evinced in countries of origin.
The pattern of change in service attendance is likewise quite diverse. Figure 3, for example, shows the percentage of Catholics from selected countries attending mass at least once a week before and after migrating to the United States. As can be seen, all groups evinced relatively high rates of attendance prior to departure. Between 62% and 75% of Dominicans, Salvadorans, Guatemalans, Mexicans, Poles, and Vietnamese attended mass at least once a week before migrating to the U.S., and among Haitians and Filipinos the frequencies were exceptionally high at 88% and 86%, respectively. Although the frequency of church attendance fell for all groups after coming to the United States, the drop-off was much greater for some national origins than others. The biggest decline in religious attendance was observed among Dominicans. Whereas before departure 65% said they attended mass at least once a week, afterward only 9% evinced this frequency of attendance. The decline in attendance was also quite sharp for Haitians. Although nearly 90% reported attending mass once a week before leaving Haiti, only 28% did so after coming to the United States. Although Filipinos displayed a similar degree of devotion prior to departure, the frequency of weekly mass attendance fell only to 40% in the United States. Across all Catholic origins shown in the figure, the average decline in the share reporting at least weekly mass attendance was 44%.
Figure 3. Percent of Catholics from selected countries who attended mass at least once a week before and after migration to the U.S.

Note: Authors' calculations using NIS 2003-1. Population aged 18 and older. Overseas respondents were excluded.
As seen in Figure 4, for some reason the drop-off in attendance associated with immigration to the United States was not as severe among Orthodox and Protestant groups. Indeed, in several cases the frequency of church attendance actually rose in the United States. Whereas only 15% of Russians reported attending services at least once a week before leaving for the United States, after arrival the share rose to around 20%. Likewise, weekly church attendance by Koreans rose from 61% before migration to 71% afterward and among Ukrainians it showed a slight reduction from 20% to 18% before and after migration.
Figure 4. Percent of Orthodox and Protestant Christians who attended mass at least once a week before and after migration to the U.S.

Note: Authors' calculations using NIS 2003-1. Population aged 18 and older. Overseas respondents were excluded.
The largest declines in church attendance were among Filipino, Haitian, and Jamaican Protestants. Among Protestant immigrants from the Philippines, 82% reported attending services at least once a week before departure compared with 34% afterward. Among Haitians the respective figures were 83% and 39% and among Jamaican 55% and 13%. The decline in frequency was significant but less severe among Salvadorans and Guatemalans, with the shift in weekly attendance going from 58% to 45% among the former and from 64% to 52% among the latter.
Congregational Membership
The regularity of church attendance is only one potential indicator of religious observance in the United States. Beyond mere attendance is actual membership in a specific congregation of worshipers. In addition to asking about the frequency of church attendance since arriving in the United States, the New Immigrant Survey also asked whether respondents were members of a specific church, parish, mosque, temple, or other congregation. The questionnaire did not ask about congregational membership before departure, making before-after comparisons impossible. Figure 5 therefore shows the degree of congregational membership after coming to the United States.
Figure 5. Congregational membership in the United States by religious affiliation.
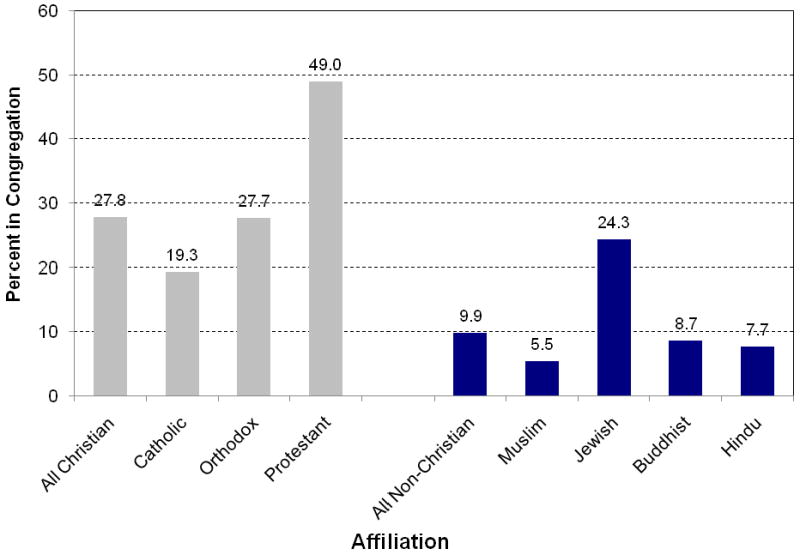
Note: Authors' calculations using NIS 2003-1. Population aged 18 and older. Overseas respondents were excluded.
The left-hand bars show membership rates for major Christian groups. Although Christians on average display a 28% rate of church membership, the rate of belonging varies considerably between denominations, with Catholics displaying the lowest membership rate at 19%, followed by Orthodox Christians at 28% and Protestants at 49%. The lowest rates of congregational membership are thus observed in the two parish-based systems—Catholics and Orthodox—where congregations are in theory assigned geographically, as opposed to most Protestant churches, which congregants choose voluntarily irrespective of where they live (though decisions about where to live may well be influenced by the location of appropriate churches).
The right-hand bars present membership rates for non-Christian religions, whose adherents, as can be seen, were generally much less likely than Christians to belong to a specific congregation. Only 6% of Muslims said they belonged to a mosque, and just 8% of Hindus and 9% of Buddhists belonged to a temple. The greatest rate of membership among non-Christian immigrants was evinced by Jews, 24% of whom said they belonged to a temple or synagogue. Thus non-Christian immigrants not only attend services less frequently than their Christian counterparts; they also belong to congregations at much lower rates.
The fact that across all major religious categories the rate of congregational membership is under 50% illustrates the methodological difficulty in drawing conclusions from congregation-based samples. Across all religions, a minority of immigrant adherents belong to a congregation in the United States, meaning that samples derived from congregation-based surveys are very likely not representative of all immigrants professing any given faith. Sample selectivity is at least 50%, and except for Protestants it is usually 30% or less; and in the case of Muslims, Buddhists, and Hindus the selection factor is under 10%.
Figure 6 shows rates of congregational membership by nationality for the three major Christian denominations. Across all countries, Catholics report low rates of church membership, with Haiti the highest at 34% followed by the Philippines at 22% and Guatemala at 20%. The lowest rate of membership is for Dominicans, 10% of whom said they belonged to a parish, followed by Vietnamese at 14% and Poles, Salvadorans and Mexicans at 16%-18%. Rates of church membership are in the same range for the two principal Orthodox groups. Ukrainians displayed the same membership rate as Haitians (34%) and Russians about the same as Mexicans (19%).
Figure 6. Congregational membership by denomination and nationality.
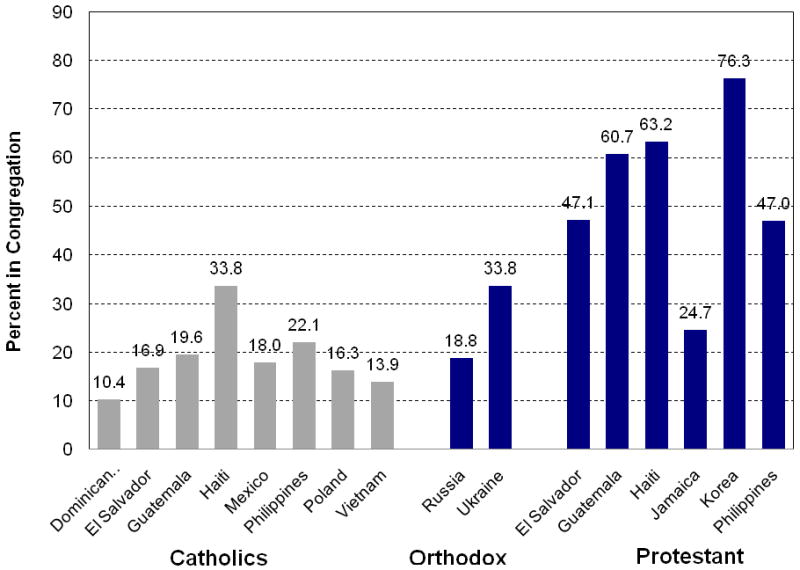
Note: Authors' calculations using NIS 2003-1. Population aged 18 and older. Overseas respondents were excluded.
With the exception of Jamaicans, rates of congregational membership were much higher among Protestants. Whereas only a quarter of Protestant Jamaicans belonged to a church, the figure was 47% for Salvadorans and Filipinos, 61% for Guatemalans, and 63% for Haitians. As with service attendance, the unquestioned champions of religiosity in the United States were Koreans, 76% of whom belonged to a congregation. The fact that the range of membership went from 10% among Salvadorans to 76% among Koreans again illustrates the dangers of congregation-based sampling. Not only is membership always selective, but the degree of selectivity varies by nationality as well as religion, meaning that some congregations are more representative of the whole population of adherents than others.
Determinants of Religious Practice
The foregoing differences in religious practice across denominations and nationalities, of course, do not control for variation between groups with respect to demographic characteristics, socioeconomic status, time since receipt of permanent residence, visa category, or other background variables. To the extent that these factors are themselves associated with differences in religious practice, they may wholly or partly account for intergroup variations in attendance, membership, and religious display, apart from any specific traditions associated with the various religious denominations. Table 10 thus considers differences in religious practice across religions using a multivariate framework that predicts the degree of religious observance not only from a person's professed religious affiliation, but from a host of other background characteristics as well.
Table 10.
Model predicting U.S. church attendance (visits per month) and U.S. congregational membership.
| Independent Variables | U.S. Service Attendance | Congregational Membership | ||
|---|---|---|---|---|
| B | SE | B | SE | |
| Church Attendance in US | ||||
| Visits per Month | ---- | ---- | 0.082*** | 0.008 |
| Religious Affiliation | ||||
| Protestant | ---- | ---- | ---- | ---- |
| Catholic | -1.598*** | 0.303 | -1.256*** | 0.119 |
| Orthodox | -0.141 | 0.443 | -0.868*** | 0.182 |
| Muslim | -2.274*** | 0.483 | -3.343*** | 0.402 |
| Jewish | -1.019 | 0.990 | -1.494*** | 0.490 |
| Buddhist | -2.073*** | 0.638 | -1.512*** | 0.342 |
| Hindu | -2.656*** | 0.460 | -2.513*** | 0.263 |
| Other Religion | 0.985 | 0.779 | -1.339*** | 0.343 |
| No Religion | -3.367*** | 0.428 | -3.878*** | 0.472 |
| Church Attendance at Origin | ||||
| Never | ---- | ---- | ---- | ---- |
| Sporadically | -0.753** | 0.368 | -0.413** | 0.216 |
| Regularly | 0.083 | 0.402 | -0.095 | 0.214 |
| Frequently | 1.632*** | 0.349 | 0.692*** | 0.182 |
| Very Frequently | 5.623*** | 0.618 | 1.116*** | 0.304 |
| Demographic Background | ||||
| Age | -0.006 | 0.011 | -0.004 | 0.005 |
| Gender | 0.116 | 0.233 | 0.036 | 0.111 |
| Married | 0.068 | 0.275 | -0.015 | 0.131 |
| # Children in Household | 0.257*** | 0.094 | 0.170*** | 0.042 |
| Visa Status | ||||
| Rel. of Citizen (Non-Quota) | ---- | ---- | ---- | ---- |
| Rel. of Citizen (Quota) | -0.512 | 0.564 | -0.110 | 0.290 |
| Relative of LPR | -0.750 | 0.642 | 0.363 | 0.280 |
| Employment | 0.953*** | 0.335 | 0.284** | 0.153 |
| Diversity | -0.755** | 0.376 | -0.213 | 0.185 |
| Refugee/Asylee/Parolee | 2.205*** | 0.452 | 0.383* | 0.223 |
| Legalization | 0.314 | 0.461 | 0.092 | 0.197 |
| Other | -0.406 | 0.465 | -0.144 | 0.219 |
| Immigrant Experience | ||||
| Months US Experience | 0.000 | 0.002 | 0.003** | 0.001 |
| Formerly Undocumented | -0.040 | 0.362 | -0.153 | 0.162 |
| Educational | ||||
| < 6 Years | ---- | ---- | ---- | ---- |
| 6-11 years | -0.435 | 0.483 | 0.323 | 0.244 |
| 12 Years | 0.257 | 0.527 | 0.733*** | 0.265 |
| 13-15 years | 0.414 | 0.513 | 0.857*** | 0.257 |
| 16+ Years | 0.275 | 0.515 | 1.080*** | 0.260 |
| Employment | ||||
| Hours Worked Since LPR | -0.001*** | 0.0001 | 0.000 | 0.000 |
| Held Job Before LPR | -1.217*** | 0.333 | 0.067 | 0.157 |
| Occupation | ||||
| Not Working | ---- | ---- | ---- | ---- |
| Laborers | 0.765 | 0.625 | -0.331 | 0.313 |
| Service Workers | 0.712* | 0.395 | 0.092 | 0.179 |
| Operatives | 1.381*** | 0.483 | 0.098 | 0.227 |
| Craft Workers | 1.368*** | 0.551 | -0.155 | 0.261 |
| Administrative Support Workers | 0.313 | 0.527 | 0.077 | 0.242 |
| Sales Workers | 0.697 | 0.520 | 0.122 | 0.246 |
| Technicians | 0.743 | 1.170 | -0.270 | 0.524 |
| Professionals | 1.004** | 0.439 | -0.107 | 0.208 |
| Managerial | 0.297 | 0.555 | -0.343 | 0.263 |
| Economic Status | ||||
| Gross Income (ln) | -0.050 | 0.075 | 0.009 | 0.036 |
| Net Worth | 0.000 | 0.000 | 0.000 | 0.000 |
| Home Owner | 0.059 | 0.243 | 0.277** | 0.111 |
| Intercept | 3.428*** | 1.071 | -2.039*** | 0.524 |
| R Squared | 0.110*** | 0.251*** | ||
| Chi-Squared | ---- | 900.58*** | ||
| Number of Cases | 3,434 | 3,429 | ||
p<.10;
p<.05;
P<.01;
The left-hand columns, for example, use OLS regression to predict the frequency of religious service attendance among immigrants after coming to the United States (measured as the number of visits per month) from a set of dummy variables representing religious affiliation (with Protestants serving as the reference category) while controlling for the frequency of attendance before departure, demographic characteristics (age, gender, marital status, number of children in household), visa status (category of entry), immigrant experience (months of total U.S. experience and whether any of it was undocumented), education, occupation, employment, and economic status (income, net worth, and home ownership). The coefficients associated with each religious affiliation indicates that religion's relative frequency of U.S. service attendance compared with Protestants holding constant the influence of all variables included in the regression equation.
Once background characteristics are controlled in this fashion, the Orthodox and “other” religious groups are found to exhibit the same frequency of service attendance as Protestants in the United States. All other religious groups display significantly lower rates of attendance. Not surprisingly, the lowest frequencies of attendance are reported by immigrants who profess no religious affiliation, who make 3.4 fewer church visits per month than Protestants. Given that the overall frequency for Protestants in the model is also 3.4 visits per month (see the intercept), this means that those professing no religion essentially do not go to church at all, as one might logically expect. The next least likely to attend religious services among those professing a religion are Hindus, who attend 2.7 times fewer per month than Protestants, followed by Muslims (2.3 times fewer), Buddhists (2.1 times fewer), and Catholics (1.6 times fewer).
In addition to religious affiliation, the frequency of service attendance in the United States is related to the frequency with which respondents attended religious services before departure, suggesting a carry-over of religious devotion from origin to destination. Compared with those who said they never attended services in their country of last residence, those who said they went frequently reported 1.6 more visits per month in the United States and those who said they went very frequently reported 5.6 more visits per month. In other words, other things equal, the pattern of religious practice established by immigrants in their home countries prior to departure tended to be replicated in the United States, albeit at a lower level.
Among demographic variables, the only factor that made a difference was the number of children. The more children in the household, the more often adult immigrants attend religious services, consistent with what others have found (Alenazi and Sherkat 2008; Campbell and Curtis 1994; Connor 2008; Iannaccone 1990; van Tubergen 2006). The mode of legal entry also influences the rate of attendance. Compared with immigrants who entered with family visas (spouses, parents, and minor children of U.S. citizens), those who entered with employer-sponsored visas went to church more often (0.95 times per month), as did those who entered as refugees, asylees, or parolees (2.2 times per month). In contrast, those who entered using a diversity visa (allocated randomly by lottery among applicants from qualifying countries) attended services less frequently (0.8 times per month). The relatively high rate of attendance among refugees, asylees, and parolees may reflect the fact that often such immigrants are sponsored by religious organizations and congregations.
The frequency of service attendance was unrelated to total time spent in the United States or to having prior undocumented experience. As one might expect, however, church attendance was negatively related to the total number of hours that respondents had worked since achieving permanent resident status, and was significantly lower for those who had held their main job since before they achieved permanent residence. Apparently the more hours one works and the longer one has held a job, the less time there is for religious participation, illustrating the time tradeoffs faced by immigrants. Holding constant hours worked, higher levels of church attendance were more common among the elite of blue and white collar workers. Thus operatives and craft workers went to services more often than laborers and service workers and professionals went more often than administrative support and sales workers. Apart from these occupational differences, however, the frequency of service attendance was unrelated to socioeconomic characteristics. Neither education, income, nor assets played a significant role in determining church attendance.
The right-hand columns use a logistic regression model to predict whether or not the respondent had joined a church, mosque, or temple by the time of the survey, controlling for the frequency of attendance and the other factors mentioned above. As one would expect, the more frequently an immigrant attends services in the United States, the more likely he or she is to report joining a religious congregation. With each additional visit to services per month, the odds of membership rise by 8.5% (e0.082 = 1.085). Similarly, the more that immigrants attended religious services in their country of origin, the more likely they were to belong to a congregation in the United States. Compared with those who said they never attended services before immigration, the odds of congregational membership were three times greater (e1.116 = 3.053) for those who had attended very frequently before departure. Once again, these results indicate the dangers of generalizing to all immigrants of a particular faith from surveys of congregational members. Simply put, people who join congregations are much more religious than average, as one might logically expect.
Holding the effect of attendance before and after coming to the United States constant, there nonetheless remain clear differences in the propensity toward membership remain between religious groups. Compared with Protestants, all other groups are less likely to become congregational members. Naturally, those reporting no religion are least likely to join (see the negative coefficient of -3.878), but not far behind are Muslims (with a coefficient of -3.434) and Hindus (-2.513). Closest to Protestants in terms of propensity to join a religious congregation are Orthodox Christians (-0.868), followed by Catholics (-1.256), Jews (-1.494, and “other” religions (-1.339). Once again, patterns of religious practice established prior to immigration carry over into the United States. Compared with those immigrants who never attended services in the country of origin, the odds of church membership were two times greater among those who said they attended frequently (e0.692 = 2.00) and three times greater among those who said they attended very frequently (e1.116 = 3.05).
The model also reveals that church membership was more likely for respondents with children. Each additional child raised the odds of membership by about 18% (e0.170 = 1.18). Likewise, the likelihood of church membership was greater for immigrants who entered with employment and diversity visas. Among the former, the odds of membership were 33% greater (e0.284 = 1.33) and among the latter they were 47% greater (e0.383 = 1.47). In contrast to the pattern for service attendance, however, the likelihood of joining a religious congregation increased with time spent in the United States.
A key factor predicting integration is duration of time spent the United States, and as one might expect, with each month of additional U.S. experience the odds of joining a church, mosque, or temple rose by around 0.3% (e0.03 = 1.003). In contrast to the prior model, however, congregational membership was strongly predicted by education. In general, the odds of joining church, mosque, or temple rose steadily with years of education. Compared with an immigrant having less than six years of schooling, a college graduate was 2.9 times more likely to be a church member (e1.080 = 2.94). The likelihood of membership was also greater among home owners but neither employment nor occupation influenced the propensity to join a congregation.
Conclusion
As noted at the outset, the United States is unusual among developed nations for its strength of religious adherence and church membership. It is perhaps not surprising, therefore, that the United States also attracts religious immigrants. Among adult immigrants interviewed by the New Immigrant Survey, 88% reported a religious affiliation compared with 85% in the United States generally. Although the country's new legal immigrants may be just as religious as their native counterparts, however, the specific faiths to which they adhere are quite different. Whereas 55% of all Americans are Protestant and 26% are Catholic, among new immigrants the respective figures are 17% and 41%; and whereas a fraction of one percent of Americans profess Orthodox Christianity, 9% of arriving immigrants do so.
New immigrants to the United States are thus more Catholic, more Orthodox, and less Protestant than Americans in general; and those immigrants who are Protestants generally belong to different denominations than most Americans, displaying a tendency toward evangelical sects. Whereas 41% of Protestant immigrants reported themselves to be Evangelical or Pentecostal, for example, the figure was just 8% among all Americans. Likewise, 11% of Protestant immigrants were Seventh Day Adventists, compared with 0.6% of Americans.
In addition to being more Catholic and more Orthodox than Americans, the new immigrants are also paradoxically less Christian. Whereas only 4% of Americans profess a non-Christian faith, 20% of the new immigrants in our sample did so. Among non-Christian immigrants arriving in the year 2003, 35% were Muslim, 28% were Hindu, 21% were Buddhist, and 6% were Jewish. As one would expect, the distribution of religions reported by adult immigrants corresponds closely to that adhered to by their spouses and children, with only trivial differences. Moreover, the overwhelming majority of new immigrants continue in the religion they were taught as children and there is little evidence of change in the religious composition of immigrant cohorts in recent years.
In contrast to this stability in professed belief over time, we observe great geographic diversity among new immigrants across space. Immigrants from Latin America are by far the most Catholic, with 65% adhering to this faith. Immigrants from Europe and Cental Asia are the most Orthodox at 29% and those from Asia and the Pacific are the most Buddhist (28%) and Hindu (8%). Naturally immigrants from the Middle East and North Africa are the most Muslim (56%), but they are also the most Jewish (10%). Immigrants from Africa display the largest share of Protestants at 33%, but they are also the most diverse in religious terms, with significant numbers of Catholics, Orthodox, Muslims, and even a few Hindus.
There is even greater religious diversity by country than by region. Immigrants from China are notable for their lack or religious belief, with 72% reporting no affiliation at all. Among major immigrant-sending countries, the most Catholic cohorts come from Poland, Mexico, the Philippines, and the Dominican Republic. About half of all immigrants from Russia and the Ukraine are Orthodox; almost half of those from Vietnam are Buddhist; and nearly two thirds of those from India are Hindu. The most Protestant flows are from Korea and Jamaica, where more than 60% all immigrants reported a Protestant denomination. Aside from Israel, the most Jewish flows are from Russia and the Ukraine.
Our detailed analysis of data on religious practice indicated that Protestant Christians stood apart from other immigrants in terms of levels devotion. Even before departing for the United States, they attended religious services far more frequently than other religious groups, Christian or non-Christian. Although the frequency of service attendance fell for all immigrants in the United States, whatever their religion, the decline was generally less pronounced among Protestants. Protestants also displayed a clear lead in the frequency of attendance in the United States and were more likely to become members of a U.S. congregation, differences that generally held up after controlling for background characteristics. Other things equal, all religious groups were less likely than Protestants to report church membership and with the exception of Orthodox Christians and people in the residual “other” religion category, they attended church much less frequently. Thus the immigrants with the smallest social distance to mainstream American culture in terms of nominal affiliation may experience the greatest distance when it comes to devotion. Although Americans may be nominally protestant, the prevailing culture is nonetheless relatively secular and not evangelical.
In contrast to the theologizing hypothesis of Smith (1978), our results are more consistent with what might be called an alienating hypothesis. Although people do not change their religious beliefs when they migrate internationally, they do change their religious behaviors. Settling into a country of destination is necessarily a time-consuming process that involves learning a new language, mastering a strange culture, and working hard to earn money and get ahead economically, activities that necessarily compete with religious practice for the scarce time at immigrants' disposal. In addition, many new immigrants to the United States are not Catholic, Protestant, or Jewish and thus cannot readily participate in America's traditional “triple melting pot” (Kennedy 1944; Herberg 1960) but must grapple with a religious environment where few share their spiritual beliefs and the faith-based institutional landscape is sparsely populated. Just as immigration disrupts childbearing among immigrant women to lower rates of fertility in the years after arrival (Stephen and Bean 1992), so too does immigration disrupt religious practice, at least in the short term.
In addition to supporting an alienating rather than a theologizing model of religious practice following immigration, our analysis also points to the danger of generalizing to all immigrants from congregation-based samples. Our models clearly show that people who join congregations in the United States are highly selected and unrepresentative of the broader population of immigrants in any faith. In general, congregational members were more observant both before and after emigration, were more educated, had more cumulative experience in the United States, and were more likely to have children present in the household and be homeowners They also tended to enter on employment visas or refugee visas, the latter of which are often arranged through religious organizations. Under these circumstances, it is hardly surprising that case studies of congregations reveal the important role of religion in the lives of immigrants.
Not only are congregation-based samples selective and therefore biased representations of all adherents to any faith, the degree of selectivity and hence bias varies markedly both by religion and nationality. Congregational samples are least selective for Protestant Koreans and most selective for Muslims, Buddhists, and Hindus among non-Christians and Dominican and Vietnamese Catholics among Christians. The fact that in general immigrants are not “theologized” by migration to the United States, or that congregational members represent a biased sample of immigrants in general, does not mean that religious participation does not provide significant material and non-material benefits to immigrants, though it does raise thorny issues about whether differences in socioeconomic outcomes stem from religious participation itself or from pre-existing differences.
Footnotes
Publisher's Disclaimer: This is a PDF file of an unedited manuscript that has been accepted for publication. As a service to our customers we are providing this early version of the manuscript. The manuscript will undergo copyediting, typesetting, and review of the resulting proof before it is published in its final citable form. Please note that during the production process errors may be discovered which could affect the content, and all legal disclaimers that apply to the journal pertain.
References
- Abusharaf Rogaia Mustafa. Structural Adaptations in an Immigrant Muslim Congregation in New York. In: Warner R Stephen, Wittner Judity G., editors. Gatherings in the Diaspora: Religions Communities and the New Immigration. Philadelphia, PA: Temple University Press; 1998. pp. 235–64. [Google Scholar]
- Alanezi Fawaz, Sherkat Darren E. The Religious Participation of U.S. Immigrants: Exploring Contextual and Individual Influences. Social Science Research. 2008;37:844–855. [Google Scholar]
- Alba Richard D. Italian Americans: Into the Twilight of Ethnicity. Englewood Cliffs, NJ: Prentice-Hall; 1985. [Google Scholar]
- Alba Richard D. Ethnic Identity: The Transformation of White America. New Haven, CN: Yale University; 1990. [Google Scholar]
- Alba Richard, Nee Victor. Remaking the American Mainstream: Assimilation and Contemporary Immigration. Harvard University Press; 2003. [Google Scholar]
- Argue Amy, Johnson David R, White Kevin. Age and Religiosity: Evidence from a Three-Wave Panel Analysis. Journal for the Scientific Study of Religion. 1999;38:423–35. [Google Scholar]
- Baker Wayne E. America's Crisis of Values: Reality and Perception. Princeton, NJ: Princeton University Press; 2004. [Google Scholar]
- Cadge Wendy, Ecklund Elaine H. Religious Service Attendance among Immigrants: Evidence from the New Immigrant Survey Pilot. American Behavioral Scientist. 2006;49:1574–1595. [Google Scholar]
- Cadge Wendy, Ecklund Elaine Howard. Immigration and Religion. Annual Review of Sociology. 2007;33:359–379. [Google Scholar]
- Campbell Robert A, Curtis James E. Religious Involvement Across Societies: Analyses for Alternative Measures in National Surveys. Journal for the Scientific Study of Religion. 1994;33:215–29. [Google Scholar]
- Chaves Mark, Gorski Philip S. Religious Pluralism and Religious Participation. Annual Review of Sociology. 2001;27:261–81. [Google Scholar]
- Chiswick Carmel U. IZA Discussion Paper 863. Bonn, Germany: Institut zur Zukunft der Arbeit (Institute for the Study of Labor); 2003. Immigration Religious Adjustment: An Economic Approach to Jewish Migrations. [Google Scholar]
- CIA World Factbook. CIA World Factbook. Langley, VA: U.S. Central Intelligence Agency; 2010. [February 27, 2010]. https://www.cia.gov/library/publications/the-world-factbook/ [Google Scholar]
- Connor Phillip. Increase or Decrease? The Impact of the International Migratory Event on Immigrant Religious Participation. Journal for the Scientific Study of Religion. 2008;47:243–57. [Google Scholar]
- Connor Phillip. International Migration and Religious Participation: The Mediating Impact of Individual and Contextual Factors. Sociological Forum. 2009a;24:779–803. [Google Scholar]
- Connor Phillip. Immigrant Religiosity in Canada: Multiple Trajectories. International Migration and Integration. 2009b;10:159–175. [Google Scholar]
- Ebaugh Helen Rose. Religion and the New Immigrants. In: Dillon Michele., editor. Handbook of the Sociology of Religion. Cambridge: Cambridge University Press; 2003. pp. 225–39. [Google Scholar]
- Ebaugh Helen Rose, Janet Chafetz., editors. Religion and the New Immigrants. Walnut Creek, CA: Altamira Press; 2000. [Google Scholar]
- Edgell Penny. Religion and Family: Understanding the Transformation of Linked Institutions. Princeton, NJ: Princeton University Press; 2005. [Google Scholar]
- Finke Roger, Stark Rodney. The Churching of America: Winners and Losers in the Religious Economy. New Brunswick, NJ: Rutgers University Press; 1992. [Google Scholar]
- Firebaugh Glenn, Harley Brian. Trends in U.S. Church Attendance: Secularization and Revival or Merely Lifecycle Effects? Journal for the Scientific Study of Religion. 1991;30:487–500. [Google Scholar]
- Gans Herbert J. Toward a Reconciliation of ‘Assimilation’ and ‘Pluralism:’ The Interplay of Acculturation and Ethnic Retention. In: Hirschman Charles, Ksinitz Phillip K, DeWind Josh., editors. The Handbook of International Migration: The American Experience. New York: Russell Sage Foundation; 1999. pp. 161–171. [PubMed] [Google Scholar]
- George Sheba. Caroling with the Keralites: The Negotiation of Gendered Space in an Indian Immigrant Church. In: Warner R Stephen, Wittner Judity G., editors. Gatherings in the Diaspora: Religions Communities and the New Immigration. Philadelphia, PA: Temple University Press; 1998. pp. 265–94. [Google Scholar]
- Glazer Nathan, Moynihan Daniel Patrick. Beyond the Melting Pot: The Negroes, Puerto Ricans, Jews, Italians, and Irish of New York City. Cambridge, MA: The MIT Press; 1963. [Google Scholar]
- Gordon Milton. Assimilation in American Life: The Role of Race, Religion, and National Origins. New York: Oxford University Press; 1964. [Google Scholar]
- Greeley Andrew M. Why Can't They Be Like Us? America's White Ethnic Groups. New York: E.P. Dutton; 1971. [Google Scholar]
- Hamilton Richard F, Form William H. Categorical Usages and Complex Realities: Race Ethnicity and Religion in the United States. Social Forces. 2003;81:693–714. [Google Scholar]
- Hagan Jacqueline. Migration Miracle: Faith, Hope, and Meaning on the Undocumented Journey. Cambridge, MA: Harvard University Press; 2008. [Google Scholar]
- Hagan Jacqueline, Ebaugh Helen Rose. Calling Upon the Sacred: Migrants' Use of Religion in the Migration Process. International Migration Review. 2003;37:1145–1153. [Google Scholar]
- Handlin Oscar. The Uprooted: The Epic Story of the Great Migrations that Made the American People. Boston: Little Brown; 1951. [Google Scholar]
- Herberg Will. Protestant-Catholic-Jew. Garden City, NY: Anchor Books; 1960. [Google Scholar]
- Hirschman Charles. The Role of Religion in the Origins and Adaptation of Immigrant Groups in the United States. International Migration Review. 2004;28:1206–34. [Google Scholar]
- Hout Michael, Greeley Andrew M. The Center Doesn't Hold: Church Attendance in the United States 1940-1984. American Sociological Review. 1987;52:325–45. [Google Scholar]
- Iannaccone Lawrence R. Religious Practice: A Human Capital Approach. Journal for the Scientific Study of Religion. 1990;29:297–314. [Google Scholar]
- Kelly Jonathan, De Graaf Nan Dird. National Context, Parental Socialization, and Religious Belief: Results from 15 Nations. American Sociological Review. 1997;62:639–59. [Google Scholar]
- Kennedy Ruby JR. Single or Triple Melting-Pot? Intermarriage Trends in New Haven, 1870-1940. American Journal of Sociology. 1944;49:331–39. [Google Scholar]
- Kivisto Peter A. Religion and the New Immigrants. In: Swatos William H., editor. A Future for Religion? New Paradigms for Social Analysis. Newbury Park, CA: Sage Publishing; 1992. pp. 92–108. [Google Scholar]
- Kosmin Barry A, Egon Mayer, Keysar Ariela. The American Religious Identification Survey. Graduate Center City University of New York: 2007. Website: http://www.gc.cuny.edu/faculty/research_briefs/aris/aris_index.htm. [Google Scholar]
- Kurien Prema. We Are Better Hindus Here: Religion and Ethnicity among Indian Americans. In: Min Pyong Gap, Him Jung Ha., editors. Religions in Asian America: Building Faith Communities. Walnut Creek, CA: Altamira Press; 2002. pp. 99–120. [Google Scholar]
- Lieberson Stanley, Waters Mary C. From Many Strands: Ethnic and Racial Groups in Contemporary America. New York: Russell Sage Foundation; 1988. [Google Scholar]
- Lummis Adair T. A Research Note: Real Men and Church Participation. Review of Religious Research. 2004;45:404–14. [Google Scholar]
- Miller Alan S, Hoffman John P. Risk and Religion: An Explanation of Gender Differences in Religiosity. Journal for the Scientific Study of Religion. 1995;34:63–75. [Google Scholar]
- Miller Alan S, Stark Rodney. Gender and Religiousness: Can Socialization Explanations Be Saved? American Journal of Sociology. 2002;107:1399–1423. [Google Scholar]
- Min Pyong Gap. The Structure and Social Functions of Korean Immigrant Churches in the United States. International Migration Review. 1992;26:1370–94. [Google Scholar]
- Min Pyong Gap, Kim Jung Ha. Religions in Asia America: Building Faith Communities. Walnut Creek, CA: AltaMira Press; 2002. [Google Scholar]
- Myers Scott M. The Impact of Religious Involvement on Migration. Social Forces. 2000;79:755–83. [Google Scholar]
- Novak Michael. The Rise of the Unmeltable Ethnics: The New Political Force of the Seventies. New York: Macmillan; 1972. [Google Scholar]
- Ploch Donald R, Hasings Donald W. Effects of Parental Church Attendance, Current Family Status and Religious Salience on Church Attendance. Review of Religious Research. 1998;39:309–320. [Google Scholar]
- Portes Alejandro, Bach Robert. Latin Journey: Cuban and Mexican Immigrants in the United States. Berkeley: University of California Press; 1985. [Google Scholar]
- Portes Alejandro, Rumbaut Ruben G. Immigrant America: A Portrait. 1st. Berkeley: University California Press; 1990. [Google Scholar]
- Portes Alejandro, Rumbaut Ruben B. Immigrant America: A Portrait. 2nd. Berkeley: University California Press; 2006. [Google Scholar]
- Portes Alejandro, Min Zhou. The New Second Generation: Segmented Assimilation and Its Variants. Annals of the American Academy of Political and Social Science. 1993;530:74–96. [Google Scholar]
- Smith Timothy L. Religion and Ethnicity in America. American Historical Review. 1978;83:1115–85. [Google Scholar]
- Smith Christian, Sikkink David, Bailey Jason. Devotion in Dixie and Beyond: A Test of the ‘Shibley Thesis’ on the Effects of Regional Origin and Migration on individual Religiosity. Journal for the Scientific Study of Religion. 1998;37:494–506. [Google Scholar]
- Stark Rodney. Physiology and Faith: Addressing the “Universal” Gender Difference in Religions Commitment. Journal for the Scientific Study of Religion. 2002;41:495–507. [Google Scholar]
- Stark Rodney, Finke Roger. Acts of Faith: Explaining the Human Side of Religion. Berkeley: University of California Press; 2000. [Google Scholar]
- Stark Rodney, Iannaccone Lawrence R. A Supply-Side Reinterpretation of the Secularization of Europe. Journal for the Scientific Study of Religion. 1995;33:230–52. [Google Scholar]
- Stephen Elizabeth H, Bean Frank D. Assimilation, Disruption and the Fertility of Mexican-Origin Women in the United States. International Migration Review. 1992;26:67–88. [Google Scholar]
- Tilikainen Marja. Somali Women and Daily Islam in the Diaspora. Social Compass. 2003;50:59–69. [Google Scholar]
- van Tubergen Frank. Religious Affiliation and Attendance Among Immigrants in Eight Western Countries: Individual and Contextual Effects. Journal for the Scientific Study of Religion. 2006;45:1–22. [Google Scholar]
- Veglery Anna. Differential Social Integration among First Generation Greeks in New York. International Migration Review. 1988;22:627–57. [Google Scholar]
- Warner R Stephen. Religion, Boundaries, and Bridges. Sociology of Religion. 1997;58:217–239. [Google Scholar]
- Warner R Stephen. Religion and Migration in the United States. Social Compass. 1998;45:123–134. [Google Scholar]
- Warner R Stephen, Wittner Judith G., editors. Gatherings in the Diaspora: Religious Communities and the New Immigration. Philadelphia, PA: Temple University Press; 1998. [Google Scholar]
- Waters Mary C. Ethnic Options: Choosing Identities in America. Berkeley: University of California Press; 1990. [Google Scholar]
- White Michael J. Segregation and Diversity: Measures of Population Distribution. Population Index. 1986;52:198–221. [PubMed] [Google Scholar]
- Wuthnow Robert. America and the Challenges of Religious Diversity. Princeton, NJ: Princeton University Press; 2005. [Google Scholar]
- Wuthnow Robert, Christiano Kevin. The Effects of Residential Migration on Church Attendance in the United States. In: Wuthnow Robert., editor. The Religious Dimension: New Directions in Quantitative Research. New York: Academic Press; 1979. pp. 257–276. [Google Scholar]