Abstract
Explosive detonations generate atmospheric pressure changes that produce nonpenetrating blast induced “mild” traumatic brain injury (bTBI). The structural basis for mild bTBI has been extremely controversial. The present study applies matrix-assisted laser desorption/ionization (MALDI) mass spectrometry imaging to track the distribution of gangliosides in mouse brain tissue that were exposed to very low level of explosive detonations (2.5–5.5 psi peak overpressure). We observed major increases of the ganglioside GM2 in the hippocampus, thalamus, and hypothalamus after a single blast exposure. Moreover, these changes were accompanied by depletion of ceramides. No neurological or brain structural signs of injury could be inferred using standard light microscopic techniques. The first source of variability is generated by the Latency between blast and tissue sampling (peak intensity of the blast wave). These findings suggest that subtle molecular changes in intracellular membranes and plasmalemma compartments may be biomarkers for biological responses to mild bTBI. This is also the first report of a GM2 increase in the brains of mature mice from a nongenetic etiology.
Explosive devices used in conflicts have increased the prevalence of blast-induced mild traumatic brain injuries (bTBI) in the U.S. military. It has been estimated that about 20% of deployed personnel have been exposed to at least one episode of bTBI.1,2 Explosive detonations produce shock waves, blast wind and electromagnetic pulses. Primary injury is due to distortion of tissue by propagation of atmospheric pressure (AP) differential between blast overpressure and normal AP, thus compressing soft tissues (lung, GI, ear, brain), followed by reverse negative pressure leading to tearing and shearing of tissue, including veins.3 These AP changes result in nonpenetrating mild bTBI, with physical and psychological consequences. However, behavioral manifestations of mild bTBI are often not associated with discernible structural changes in brain tissue or neurological signs, in either animal models or humans.4−9 Diagnosis is problematic and indeed even the existence of a bTBI syndrome has been debated.10
Ceramide and derived glycosphingolipids form 20% of total lipids of plasmalemma and intracellular organelle membranes.11 Gangliosides constitute 6% by weight of total brain lipids and include four major structural series of species, constructed on a ceramide scaffold with an oligosaccharide chain containing at least one sialic acid moiety. Their formation is catalyzed by membrane-bound glycosyltransfersases in the Golgi apparatus and endoplasmic reticulum. GM1, accounts for approximately 21% of total gangliosides, while GM2, a very minor ganglioside species, constitutes less than 0.5% of total gangliosides or 0.08% of all brain lipids. Concentration ratios of ganglioside species in intracellular membranes (e.g., Golgi apparatus and endoplasmic reticulum) and plasmalemma compartments (components of lipid rafts) appear to be tightly regulated in conjunction with a broad range of cellular functions related to normal intracellular trafficking and cell signaling.11−13 The relative distribution of ganglioside species also varies across brain structures, as shown by MALDI imaging of coronal brain tissue sections.14,15 In control mice, GM2 is found mainly in the lateral and third ventricles’ choroid plexus and to a lesser extent in the hippocampus.
In the current study, we mapped and characterized changes in gangliosides in bTBI brains as compared to control in a mouse model of blast exposures in a realistic “battlefield-like” environment. Additionally, we measured the change in ceramide species between control and bTBI brains. Our analysis shows acute changes in ceramide and ganglioside amounts in brain regions that could be potential biomarkers for the behavioral changes previously described in this mouse open field blast exposure model.7 These time-dependent behavioral changes occur in the absence of gross or histopathological signs of brain injury as previously described.
Results
Initial experiments were conducted to profile and image gangliosides from control and blast exposed animals using LTQ XL mass spectrometer in negative ion mode. The [M – H]− molecular ion for each ganglioside species was used to generate MALDI images. Seven ganglioside species were imaged, each with C18:0 as the fatty acid chain and either sphingenine (d18:1) or eicosasphingenine (d20:1) in the ceramide backbone. Two of the species imaged were acetylated. The seven species imaged were as follows: GM2 (d18:1/C18:0), GM1 (d18:1/C18:0), GM1 (d20:1/C18:0), GD1 (d18:1/C18:0), GD1 (d20:1/C18:0), acetylated GD1 (d18:1/C18:0), and acetylated GD1 (d20:1/C18:0). To confirm our assignments, one brain was imaged at high mass resolution and accuracy using a LTQ XL Orbitrap mass spectrometer and the species above were assigned with mass errors less than 2 ppm. Because of the time constraint of the DHA matrix under vacuum, high mass resolutions, along with high spatial resolution was not possible with the DHA matrix and thus the LTQ XL mass spectrometer was used for all imaging data. Additionally, these ganglioside structural assignments were confirmed using ESI tandem mass spectrometry.15
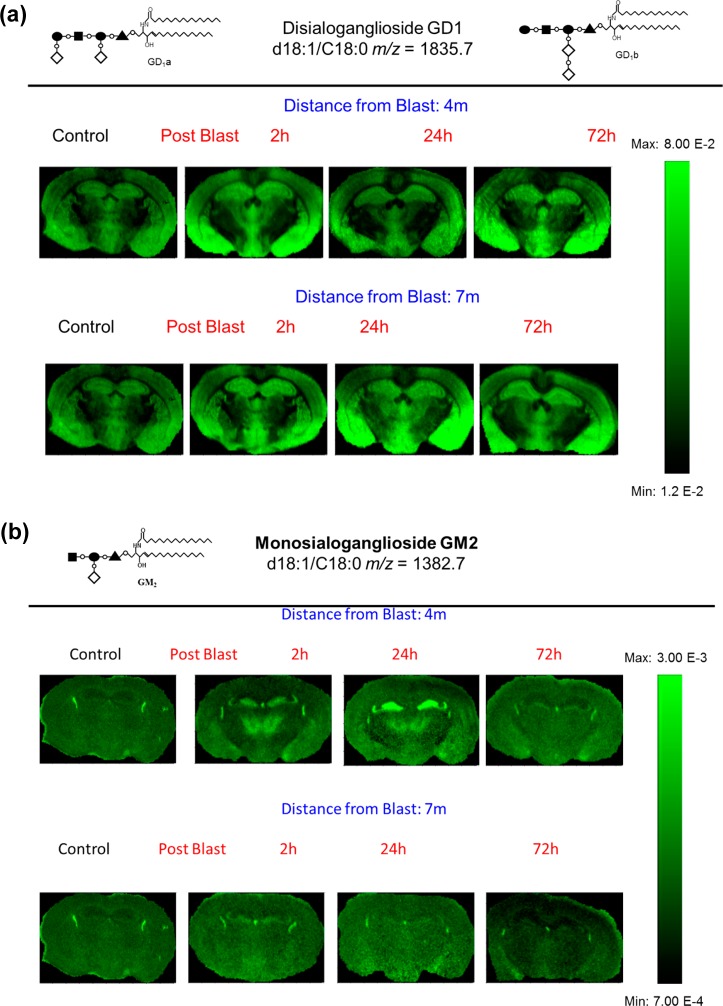
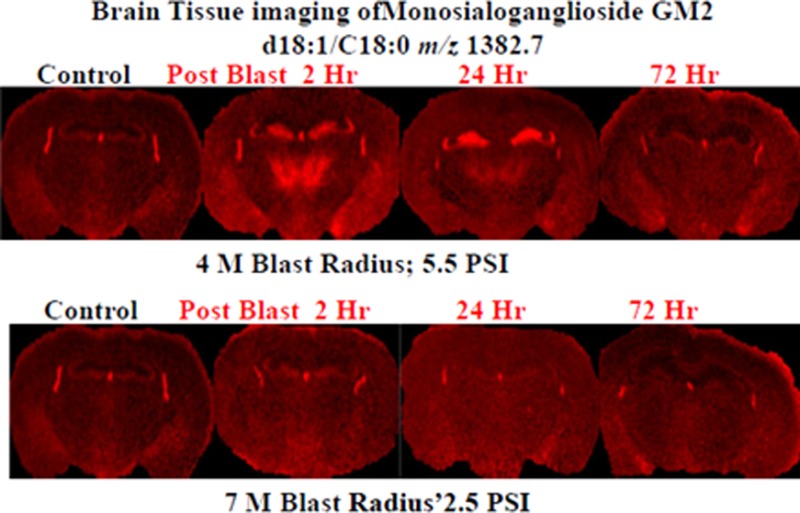
The tissue sections imaged in this study correspond to plate 45 (interaural 2.10 mm, bregma −1.70 mm) of the coronal location from The Mouse Brain Stereotaxic Coordinates (Figure 1).20 Figure 2 contains MALDI images for GD1(d18:1/C 18:0) [m/z = 1835.7] and GM2 (d18:1/C 18:0) [m/z = 1382.7] in control and in the groups sacrificed 2, 24, and 72 h after open field blast exposure at 4 (5.5 psi peak overpressure) and 7 (2.5 psi peak overpressure) m. In Figure 2a, GD1 (d18:1/C18:0) is present mainly in gray matter areas such as the hippocampus, cortex, and hypothalamus and there is no observable change in the distribution of GD1 between control and blast groups. This distribution is in agreement with a previous MALDI imaging study on gangliosides in rat brain.15 Of the other six gangliosides imaged, only GM2 (d18:1/C18:0) showed a significant change in distribution between control and blast exposed groups. The results for GM2 (d18:1/C18:0) are illustrated in Figure 2b. In the control brains, GM2 (d18:1/C18:0) is highly localized in the choroid plexus of the lateral ventricles and the roof of the third ventricle, which is in agreement with our previous study.15 In contrast to control brains, major increases were observed for GM2 (d18:1/C18:0) in the hippocampus subregions of the dentate gyrus (DG) and the hippocampal CA3 field (CA3) and in the thalamus subregions of the thalamic parafascicular/centromedian nuclei and the lateral thalamus post blast exposure, especially for the 4 m 2 and 24 h postblast samples. Additionally, smaller increases of GM2 d18:1/C18:0 were observed in the hypothalamus, more specifically the dorsomedial hypothalamus. However by 72 h post-blast exposure, the distribution of GM2 (d18:1/C18:0) was no different from the distribution observed in control brains, suggesting that this change in GM2 (d18:1/C18:0) is temporary and time-dependent.
Figure 1.
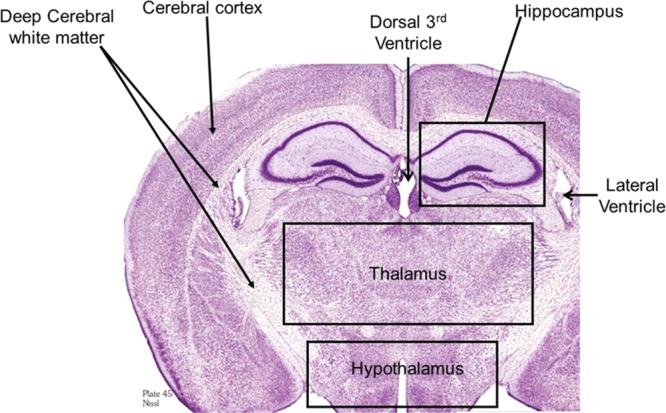
Cresyl violet staining of a rat brain section corresponding to plate 45 (interaural 2.10 mm, bregma −1.70 mm) of the coronal location from The Mouse Brain in Stereotaxic Coordinates.20 This area was used for all the images in this study.
Figure 2.
MALDI imaging mass spectrometry of (a) GD1d18:1/C18:0 and (b) GM2 d18:1/C18:0 in control and in the groups sacrificed 2, 24, and 72 h after open field blast exposure at 4 and 7 m. In panel a, GD1 is present mainly in gray matter areas (hippocampus, cortex, and hypothalamus), and there is no observable change in the distribution of GD1 between control and blast groups. In panel b, for the controls, the GM2 peak was highly localized in the lateral and the dorsal third ventricles while increases were observed in the hippocampus and thalamus for blast exposure, especially for 4 m 2 and 24 h postblast samples.
Ceramides, the scaffold on which gangliosides are built, were also investigated. Experiments to image ceramides with DHA matrix were unsuccessful, so analysis of ceramides were done on extracts from whole brains using ESI-MS. Figure 3a is a negative ion mode mass spectrum of a control brain ceramide extract. The base peak in all spectra was the added internal standard Cer d18:1/C12:0 (m/z = 480.5). Seven native species were identified: Cer d18:1/C16:0 (m/z = 536.5), Cer d18:1/C18:1 or d18:2/C18:0 (m/z = 562.5), Cer d18:1/C20:0 (m/z = 564.5), Cer d18:1/C18:0 or d20:1/C18:0 (m/z = 592.6), Cer d18:1/C24:1(m/z = 646.6). To confirm the assigned structure for ceramides, tandem mass spectrometry was conducted. Figure 3b is a product ion negative ion mode mass spectrum of the ion at m/z = 564.6. Fragment peaks at 534.6, 324.3, 308.3, 282.3, 265.2, and 237.2 Da confirm the structure as Cer d18:1/C18:0 and have been observed in previous ESI-MS/MS studies.21,22 To measure a change in the concentration of ceramides between control and blast-exposure groups, each ceramide was normalized against the internal standard.
Figure 3.
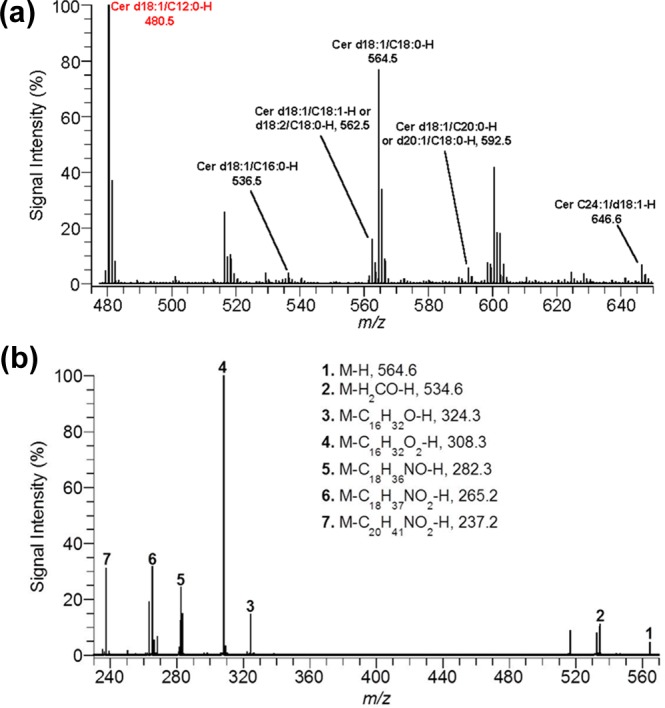
(a) ESI mass spectrum for ceramide extract from control brain in negative ion mode. (b) Product-ion spectrum for ceramide d18:1/C18:0 (m/z = 564.6) in negative ion mode.
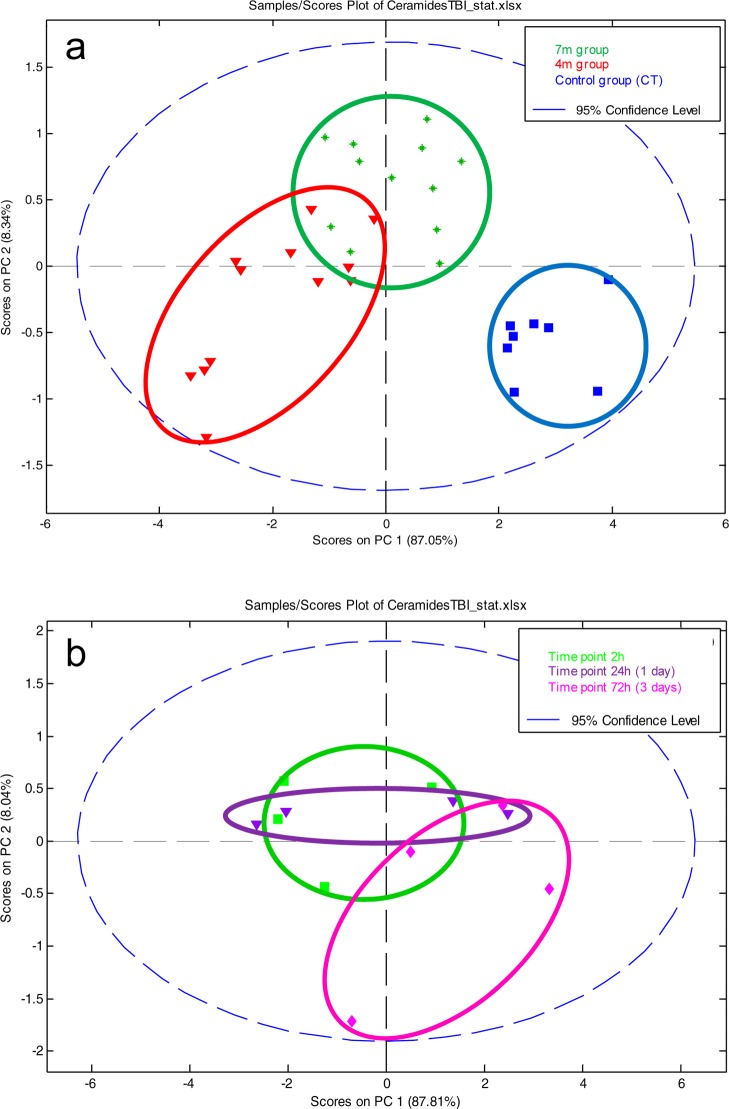
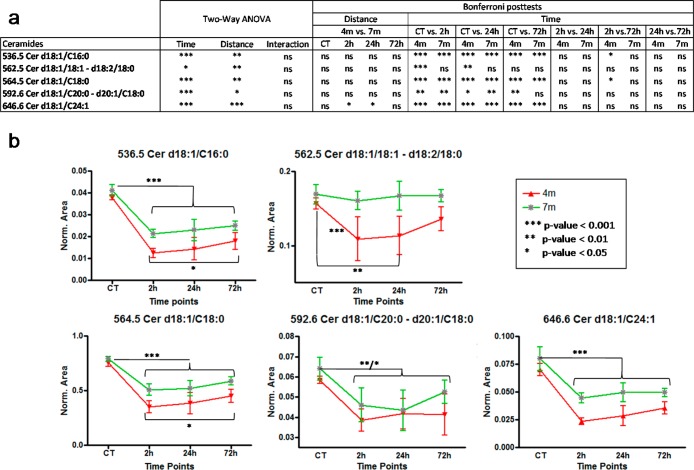
Ceramide concentration changes were investigated with both multivariate and univariate statistics. First, the data set containing all 7 native ceramides normalized against the internal standard was analyzed by principal component analysis PCA, Figure 4. The distribution of samples on the score plot (Figure 4a) clearly shows a separation between control samples and bTBI samples, but also to a lesser extent, between bTBI samples according to the distance from the blast (4 and 7 m). This suggests that the first source of variability a time dependent response to acute blast injury. The second source of variability is the distance from the blast. Two-ways ANOVA and Bonferroni post-tests were performed, to explain the clustering observed. Univariate statistics (Figure 5a) show a high significance for all controls versus other time points Bonferoni posttests (except for m/z = 562.5), highlighting a decrease of all ceramides in the brain after the blast. Results also show less important, but still significant differences between the 4 and the 7 m groups, suggesting that the smaller the distance from the blast, the greater the decrease in ceramide species (Figure 5b).
Figure 4.
(a) Multivariate analysis by PCA of the bTBI ceramide data set: effect of distance. Score plot on PC1 and PC2 for control, 4 m, and 7 m groups. (b) Multivariate analysis by PCA of the bTBI ceramide data set in the 4 m group: effect of time after the blast. Score plot on PC1 and PC2 for 4 m group (controls excluded).
Figure 5.
(a)Two-way ANOVA and Bonferroni posttests results on time and distance for each ceramide. (b) Evolution of ceramide concentrations at 4 and 7 m from the blast between control samples and all time points.
The effect of time after the blast was investigated in the 4 m group samples (Figure 4). Time after the blast is then a less important source of variation compared to the blast itself or the distance from the blast. So control samples were excluded to better highlight the effect of time that could be hidden by the huge difference between controls and bTBI samples. The separation of the samples shows a time effect difference between 72 h samples and the 2 and 24 h samples (Figure 4a). Statistical analyses (Figure 5a) shows a small significance for some 2 vs 72 h Bonferoni post-tests in the 4 m group. Despite this low significance, all graphs show a progressive increase in ceramides postblast exposure (Figure 5b). This pattern is greater in the 4 m group than in the 7 m group. These results suggest that the ceramide concentrations tend to increase after the blast but without reaching the initial concentration after 72 h. This also suggests that the effects of the blast on the brain lasts more than 72 h
Discussion
Relatively little is known about the functional consequences of regulated changes in glycosphingolipid composition of intracellular membranes (e.g., Golgi apparatus and endoplasmic reticulum) and plasmalemma (components of lipid rafts) in specialized types of cells. Although one can argue that glycosphingolipid composition is regulated tightly in conjunction with a broad range of cellular functions related to normal intracellular trafficking and cell signaling, there are no guiding principles for predicting physiological correlates of changes in proportion of specific gangliosides. Primary evidence for functional consequences is derived from multisystem glycosphingolipid storage disorders with genetic bases,13 such as lipogranulomatosis (Farber disease), Nieman–Pick types A–C, Krabbe disease, Gaucher disease (types A and B), GM1 gangliosidosis, and GM2 gangliosidosis (Tay-Sachs (variants B and A/B) and Sandhoff diseases). This is the first report of an increase in GM2 from a nongenetic etiology. Although it is of interest to note that onset times for neurodegenerative phenotypes of genetically based disorders vary from early to decades and can have decades-long progressive time course.13,23 Further interpretation is subject to the caveat that links between the observed changes in ganglioside composition in mice glycolipid storage diseases24 and signs and symptoms of blast-induced mild TBI are observations based on our MALDI imaging measurements.
The 2.5 and 5.5 psi peak blast exposures in this model are below shock tube blast levels (12–14 psi) reported to show no overt tissue injury in rats.6,9 However, they are of similar magnitude to lower level shock wave exposures (1.45–2.9 psi) that showed both behavioral responses and biochemical signs such as TUNEL reactions and cytoskeletal protein proteolysis.4,5,8 Our observed temporal changes in the brain’s GM2 and ceramides profile in mice, suggest that the functional neurochemical effects of a single, low level blast exposure may be far more profound than previously suspected. Our findings support the hypothesis that low level nonpenetrating blasts induce discrete biochemical changes in the CNS, thus representing a true brain disorder. Moreover, noninvasive technology to sample such changes in body fluids may lead to identification of biomarkers critically needed in this area of biomedicine. Thus, our work provides a clear indication of the consequences of changes resulting from blast injury that have been undetectable using other histopathological approaches.
Methods
Blast Trauma Animal Model
Male ICR (Institute for Cancer Research or CD-1) mice, from Harlan Jerusalem, weighing 25–30 g were kept five per cage under a constant 12-h light/dark cycle at room temperature. Food and water were available ad libitum. Each mouse was used for one time point and for each time point in each experimental group, a minimum of 4 mice were used. The ethics committee of the Sackler Faculty of Medicine approved the experimental protocol (M-07-055), in compliance with the guidelines for animal experimentation of the National Institutes of Health.
The blast-induced procedures took place in the experimental site of “Tamar Explosives” and of “Sadwin Consultancy” in central Israel.7 Mice were anesthetized with an i.p. mixture of ketamine (100 mg/kg) and xylazine (10 mg/mL), a combination that induces deep anesthesia and still enables spontaneous respiration. Mice were held in a restricted plastic net in a device clamped to the floor with screws, which fixed their position but did not protect them from the blast. The device was situated at a fixed distance from the explosion. Tied to each device next to the mouse was a gauge, measuring blast levels (in PSI) and temperature. The explosion device was constructed as a cast of 500 g TNT. We used two different distances (4 m, 5.5 psi; 7 m, 2.5 psi) between the explosive device and the animals to get different levels of blast intensity. Sham control (i.e., nonblast) mice were placed in the same device, anesthetized and then subjected to the same analyses described below for blast animals.
Following the blast exposure, a few animals from each group were sacrificed at different time points (2, 24, and 72 h post blast) to look for histological and biochemical evidence of brain pathology. The remaining animals were evaluated for their neurological status 1 h and 24 h post blast. These time points were chosen to approximate the examination times for personnel experiencing blasts. The mice tests examined hind-leg flexion reflex, righting reflex, corneal reflex, secretory signs, strength, and beam balance performance, a beam walking coordination task, exploration, and locomotor activity. As described previously,7 no significant neurological signs were present, paralleling the clinical situation.
Tissue Preparation
Mice brains were removed from the skull and frozen in dry ice chilled isopentane. The brain was attached to the cryostat specimen disc using ice slush made from distilled water. Frozen brain tissue was cut into thin sections (18 μm thickness) using a cryostat (Leica Microsystems CM3050S, Bannockburn, IL) at −25 °C (cryochamber temperature) and −16 °C (specimen cooling temperature). For imaging, coronal tissue slices were directly deposited on the MALDI target plate and brought to room temperature before matrix coating. We used the matrix preparation previously used to image gangliosides in rat brain sections.14,15 2,6-Dihydroxyacetophenone (DHA, Fluka, St. Louis, MO) was prepared as a saturated solution in 50% ethanol with 125 mM ammonium sulfate and 0.05% heptafluorobutyric acid (HFBA). Matrix solution was sprayed on the tissue sections with an artistic airbrush. To improve matrix coating and limit evaporation, spraying was done in a cold room (+4 °C).
Total lipids were extracted from whole brains using a modified Folch extraction method.16 Twenty microliters of a chloroform (CHL)/methanol (MeOH) (2:1 v/v) mixture was added for each 1 mg tissue. The internal standard, ceramide C12:0/d18:1 (Avanti Polar Lipids), was added at 0.3 μg per 1 mg of tissue. The tissue was homogenized, sonicated for 10 min, and vortexed for 30 min. Next, distilled water was added at 4 μL for each 1 mg tissue. Then, the mixture was vortexed for 1 min and centrifuged 10 min at 3000 rpm. The lower phase (organic), containing the ceramides was dried under nitrogen and resuspended in a chloroform volume equal to the amount of CHL/MeOH used for extraction. This lower phase stock solution was stored at −80 °C until further separation.
Total free ceramides were isolated from the lower phase (organic) using LC-NH2 SPE tubes in a method similar to Bodennec et al.17 In this procedure, 1 mL LC-NH2 SPE tubes (SuperClean, Sigma, St. Louis, MO) were conditioned with 2 mL of hexane. Next, 200 μL of the lower phase in chloroform was loaded on the SPE column; followed by 2 mL of diethyl ether to remove diglycerides, triglycerides, and cholesterol. Next, 1.6 mL of CHL/MeOH (23:1 v/v) was added to the SPE tubes to collect the ceramide fraction. This fraction was dried under nitrogen and resuspended in 5 μL chloroform and 200 μL methanol. The ceramide fractions were stored at −80 °C until mass analysis.
Mass Spectrometry
MALDI Imaging
A LTQ XL (Thermo Fisher Scientific, San Jose, CA) with a MALDI source was used to acquire the MALDI imaging data. Samples were ionized with a nitrogen laser (λ = 337 nm, rep. rate = 60 Hz, spot size = 80 × 120 μm). Data was acquired in negative ion mode in m/z range 1100–2000. The imaging parameters were 2 micro scans/step with 10 laser shots and a raster step size of 75 μm. One brain (24 h survival, 5.5 PSI overpressure) was partially imaged (as the matrix sublimed) using a LTQ Orbitrap XL (Thermo Fisher Scientific, San Jose, CA) to obtain high resolution molecular weights to confirm our peak assignments using the LTQ XL instrument. Parameters for this MALDI imaging run were 2 micro scans/step with 4 laser shots, a raster step size of 200 μm, and a mass resolution of 30 000.
The two-dimensional ion density maps (MALDI images) were generated using ImageQuest software (Thermo Scientific). With this software, a m/z range is plotted for signal intensity for each pixel (mass spectrum) across a given area (tissue section). In order to improve the visual quality of the images, the m/z range of interest was normalized by dividing with the total ion current (TIC) for each mass spectrum.15,18 Because of in-source fragmentation of GD1 yielding GM1, the GM1 m/z range was divided by the GD1 m/z range to normalize the effects of this fragmentation.15 This processing was only done for GM1 species.19
Electrospray Ionization of Ceramide Extract
Ceramide extracts were diluted 1/10 (v/v) in methanol prior to analysis. A Q-TOF Global Ultima mass spectrometer (Waters, Milford, MA) was used for electrospray analysis. The mass spectrometer was operated in negative ion mode with a capillary voltage of 3.0 kV, a sampling cone voltage of 200 V, a source temperature of 80 °C, a desolvation temperature of 150 °C, a desolvation gas flow rate of 500 L/Hr, and a sample flow rate of 10 μL/min. In MS/MS mode, collision energy of 30 V was used for fragmentation. ESI-MS mass spectra are the sum of 100 consecutive 1-s scans, while MS/MS spectra are the sum of 50 consecutive 1-s scans.
Statistical Data Analysis
Multivariate analysis was performed using MatLab (MathWorks, Natick, MA) and the PLS toolbox (eigenvector Research Inc., Wenatchee, WA). Statistical analyses were conducted on ceramide extracts using Prism (GraphPad, La Jolla, CA). Two-way ANOVA (analysis of variance) and Bonferroni post-tests were performed to highlight effects of the time and distance from the blast. Molecular concentration means were first compared all together (i.e., in all groups) with the ANOVA and then pairwise with the Bonferroni posttests.
Author Contributions
▼ These authors contributed equally.
This research was supported by the Intramural Research Program of the National Institute on Drug Abuse, NIH, and by the Center for Neuroscience and Regenerative Medicine, Bethesda, MD (Department of Defense) through the Henry M. Jackson Foundation for the Advancement of Military Medicine. The authors thank the Office of National Drug Control Policy (ONDCP) for instrumentation funding, without which this and other projects could not have been accomplished. J.A.S. and C.B. acknowledge funding from SBIR Phase II NIH-NIDA grant 1RC3DA031431.
The views expressed here represent the opinions of the authors and not of the Department of Defense, the Department of Health & Human Services, or the United States Government.
The authors declare no competing financial interest.
Funding Statement
National Institutes of Health, United States
References
- Tanielian T; Jaycox L. H. (2008) Invisible Wounds of War: Psychological and Cognitive Injuries, Their Consequences, and Services to Assist Recovery, MG-720-CCF, Rand Corporation, Santa Monica, CA. [Google Scholar]
- Terrio H.; Brenner L. A.; Ivins B. J.; Cho J. M.; Helmick K.; Schwab K.; Scally K.; Bretthauer R.; Warden D. (2009) Traumatic brain injury screening: Preliminary findings in a US Army Brigade Combat Team. J. Head Trauma Rehabil. 24, 14–23. [DOI] [PubMed] [Google Scholar]
- Taber K. H.; Warden D. L.; Hurley R. A. (2006) Blast-related traumatic brain injury: What is known?. J. Neuropsychiatry Clin. Neurosci. 18, 141–145. [DOI] [PubMed] [Google Scholar]
- Moochhala S. M.; Md S.; Lu J.; Teng C. H.; Greengrass C. (2004) Neuroprotective role of aminoguanidine in behavioral changes after blast injury. J. Trauma 56, 393–403. [DOI] [PubMed] [Google Scholar]
- Park E.; Gottlieb J. J.; Cheung B.; Shek P. N.; Baker A. J. (2011) A model of low-level primary blast brain trauma results in cytoskeletal proteolysis and chronic functional impairment in the absence of lung barotrauma. J. Neurotrauma 28, 343–357. [DOI] [PubMed] [Google Scholar]
- Petras J. M.; Bauman R. A.; Elsayed N. M. (1997) Visual system degeneration induced by blast overpressure. Toxicology 121, 41–49. [DOI] [PubMed] [Google Scholar]
- Rubovitch V.; Ten-Bosch M.; Zohar O.; Harrison C. R.; Tempel-Brami C.; Stein E.; Hoffer B. J.; Balaban C. D.; Schreiber S.; Chiu W. T.; Pick C. G. (2011) A mouse model of blast-induced mild traumatic brain injury. Exp. Neurol. 232, 280–289. [DOI] [PMC free article] [PubMed] [Google Scholar]
- Saljo A.; Svensson B.; Mayorga M.; Hamberger A.; Bolouri H. (2009) Low-level blasts raise intracranial pressure and impair cognitive function in rats. J. Neurotrauma 26, 1345–1352. [DOI] [PubMed] [Google Scholar]
- Vandevord P. J.; Bolander R.; Sajja V. S.; Hay K.; Bir C. (2012) A. Mild neurotrauma indicates a range-specific pressure response to low level shock wave exposure. Ann. Biomed. Eng 40, 227–236. [DOI] [PubMed] [Google Scholar]
- Hoge C. W.; McGurk D.; Thomas J. L.; Cox A. L.; Engel C. C.; Castro C. A. (2008) Mild traumatic brain injury in U.S. Soldiers returning from Iraq. N. Engl. J. Med. 358, 453–463. [DOI] [PubMed] [Google Scholar]
- Holthuis J. C.; Pomorski T.; Raggers R. J.; Sprong H.; Van M. G. (2001) The organizing potential of sphingolipids in intracellular membrane transport. Physiol Rev. 81, 1689–1723. [DOI] [PubMed] [Google Scholar]
- Yu R. K.; Bieberich E.; Xia T.; Zeng G. (2004) Regulation of ganglioside biosynthesis in the nervous system. J. Lipid Res. 45, 783–793. [DOI] [PubMed] [Google Scholar]
- Xu Y. H.; Barnes S.; Sun Y.; Grabowski G. A. (2010) Multi-system disorders of glycosphingolipid and ganglioside metabolism. J. Lipid Res. 51, 1643–1675. [DOI] [PMC free article] [PubMed] [Google Scholar]
- Colsch B.; Woods A. S. (2010) Localization and imaging of sialylated glycosphingolipids in brain tissue sections by MALDI mass spectrometry. Glycobiology 20, 661–66. [DOI] [PMC free article] [PubMed] [Google Scholar]
- Colsch B.; Jackson S. N.; Dutta S.; Woods A. S. (2011) Molecular microscopy of brain gangliosides: Illustrating their distribution in hippocampal cell layers. ACS Chem. Neurosci. 2, 213–222. [DOI] [PMC free article] [PubMed] [Google Scholar]
- Folch J.; Lees M.; Sloane Stanley G. H. (1957) A simple method for the isolation and purification of total lipides from animal tissues. J. Biol. Chem. 226, 497–509. [PubMed] [Google Scholar]
- Bodennec J.; Koul O.; Aguado I.; Brichon G.; Zwingelstein G.; Portoukalian J. A (2000) procedure for fractionation of sphingolipid classes by solid-phase extraction on aminopropyl cartridges. J. Lipid Res. 4, 1524–1531. [PubMed] [Google Scholar]
- Sugiura Y.; Konishi Y.; Zaima N.; Kajihara S.; Nakanishi H.; Taguchi R.; Setou M. (2009) Visualization of the cell-selective distribution of PUFA-containing phosphatidylcholines in mouse brain by imaging mass spectrometry. J. Lipid Res. 50, 1776–1788. [DOI] [PMC free article] [PubMed] [Google Scholar]
- O’Connor P. B.; Mirgorodskaya E.; Costello C. E. (2002) High pressure matrix-assisted laser desorption/ionization Fourier transform mass spectrometry for minimization of ganglioside fragmentation. J. Am. Soc. Mass Spectrom. 13, 402–407. [DOI] [PubMed] [Google Scholar]
- Franklin K; Paxinos G. (2007) The Mouse Brain in Stereotaxic Coordinates, 3rd ed., Academic Press, New York, NY. [Google Scholar]
- Han X. (2002) Characterization and direct quantitation of ceramide molecular species from lipid extracts of biological samples by electrospray ionization tandem mass spectrometry. Anal. Biochem. 302, 199–212. [DOI] [PubMed] [Google Scholar]
- Hsu F. F.; Turk J. (2002) Characterization of ceramides by low energy collisional-activated dissociation tandem mass spectrometry with negative-ion electrospray ionization. J. Am. Soc. Mass Spectrom. 13(5), 558–570. [DOI] [PubMed] [Google Scholar]
- Rosebush P. I.; MacQueen G. M.; Clarke J. T.; Callahan J. W.; Strasberg P. M.; Mazurek M. F. (1995) Late-onset Tay-Sachs disease presenting as catatonic schizophrenia: diagnostic and treatment issues. J. Clin. Psychiatry 56, 347–353. [PubMed] [Google Scholar]
- Argov Z.; Navon R. (1984) Clinical and genetic variations in the syndrome of adult GM2 gangliosidosis resulting from hexosaminidase A deficiency. Ann. Neurol. 16, 14–20. [DOI] [PubMed] [Google Scholar]


