

Abstract
Diverse physiological processes are regulated differentially by Ca2+ oscillations through the common regulatory hub calmodulin. The capacity of calmodulin to combine specificity with promiscuity remains to be resolved. Here we propose a mechanism based on the molecular properties of calmodulin, its two domains with separate Ca2+ binding affinities, and target exchange rates that depend on both target identity and Ca2+ occupancy. The binding dynamics among Ca2+, Mg2+, calmodulin, and its targets were modeled with mass-action differential equations based on experimentally determined protein concentrations and rate constants. The model predicts that the activation of calcineurin and nitric oxide synthase depends nonmonotonically on Ca2+-oscillation frequency. Preferential activation reaches a maximum at a target-specific frequency. Differential activation arises from the accumulation of inactive calmodulin-target intermediate complexes between Ca2+ transients. Their accumulation provides the system with hysteresis and favors activation of some targets at the expense of others. The generality of this result was tested by simulating 60 000 networks with two, four, or eight targets with concentrations and rate constants from experimentally determined ranges. Most networks exhibit differential activation that increases in magnitude with the number of targets. Moreover, differential activation increases with decreasing calmodulin concentration due to competition among targets. The results rationalize calmodulin signaling in terms of the network topology and the molecular properties of calmodulin.
Keywords: Signal transduction, oscillatory dynamics, frequency dependence, ligand binding, cooperativity, tuning, emergent property
A wide variety of external stimuli induce transient elevations in cytoplasmic Ca2+ concentrations, via intake through gated channels or by mobilization of endoplasmic reticulum stores. Ca2+ transients typically occur in series (oscillations) and vary in amplitude, duration, and frequency. Experimental data suggest that the temporal and spatial dynamics of Ca2+ transients contribute to specificity and sensitivity in regulation of a diverse range of physiological processes.1−4 Many Ca2+-regulated processes, for example, cardiac and neuronal rhythms,5 are sensitive to temporal dynamics, including activation of some processes and simultaneous down-regulation of others.5−7 This pattern implies the existence of global mechanisms that transduce the information encoded in the common Ca2+ oscillations into distinct cellular responses. This important question has been addressed by experiments and models that explore mechanisms of frequency-dependent regulation based on local concentration gradients of [Ca2+].3,8−10 These models show that indeed slow diffusion of calcium can result in local microdomains of high [Ca2+]; the higher the frequency of calcium oscillation, the higher the microdomain [Ca2+] and the activity of all targets in the microdomain.
Ca2+-binding proteins, most prominently calmodulin (CaM), regulate downstream functions in response to Ca2+. CaM is a promiscuous regulator with several hundred targets known to date, including kinases, phosphatases, cytoskeletal proteins, synaptic proteins, cell cycle proteins, ion channels, and the buffer proteins that regulate intracellular Ca2+ stores.11−25 The central importance of the molecular structure of CaM is underscored by its identical sequence in all vertebrates,26,27 and the observation that the Drosophila point mutants investigated to date are lethal.28 It has been unclear, however, how the molecular properties of CaM can enable a single regulatory hub to differentially activate targets in response to the common signal of Ca2+ flux.
The molecular properties of CaM appear compatible with a direct role in temporal response to Ca2+ oscillations. Here, a biophysical model is developed that incorporates explicitly CaM ligand-binding dynamics to explore whether the promiscuity of CaM could be rationalized if it were the locus of global regulation. CaM contains four EF-hands, each binding one Ca2+ ion, that are organized as pairs in two globular domains connected by a flexible tether (Figure 1).29,30 Pairing of the EF-hands allows each domain to bind two Ca2+ ions with positive cooperativity;31,32 thus, species with zero, two, or four Ca2+ ions bound dominate over those with one or three Ca2+ (Figure 1D). The domains display distinct ion affinities and kinetics, with approximately 6-fold higher Ca2+ affinity31 and ∼10-fold lower Ca2+ off-rates (24 vs 240 s–1; ref (33)) in the C-terminal domain than in the N-terminal domain at physiological salt concentration. Mg2+ is a potent physiological competitor with Ca2+ for CaM binding despite much lower affinity (KD = 1.5–6 mM for Mg2+ and KD = 0.05–15 μM for Ca2+ depending on ionic strength31,34−36) due to its much higher cytoplasmic concentration (0.5–2 mM34,37). Its opposite domain preference sets up competition at the N-terminal domain that can make Mg2+ dissociation rate-limiting for response to Ca2+. Taking these properties into account and modeling the formation and dissociation of active complex may capture essential biologically important dynamics in the activation of CaM targets.
Figure 1.
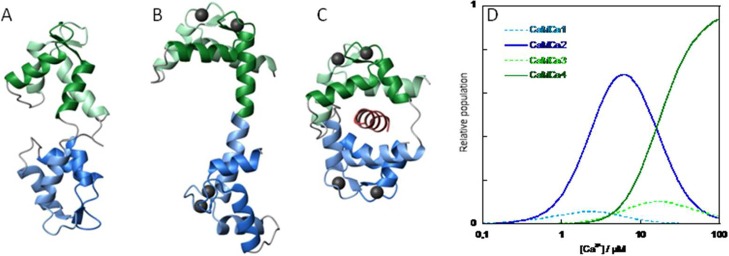
Calmodulin. (A) NMR structure of apo calmodulin (1cfc.pdb), (B) X-ray structure of CaM-Ca4 (1cll.pdb) and (C) crystal structure of CaM-Ca4 peptide complex (1cdl.pdb). Panels A–C were prepared using MOLMOL75 with EF1 in light green, EF2 in green, EF3 in light blue, and EF4 in blue. Ca2+ ions are shown as black balls and the target peptide in red. (D) Fraction of calmodulin with one (light blue, dashed), two (blue), three (light green, dashed), and four (green) Ca2+ bound as a function of free Ca2+ concentration at physiological KCl concentration based on experimental binding constants.31
The two domains of CaM cooperate in target binding38−40 (Figure 1C). Their flexible linkage allows the domains to take many orientations relative to one another,41 as the electrostatic repulsion between the Ca2+-bound domains is largely screened at physiological salt.42−44 The prevalence of methionine side-chains at the hydrophobic pockets allows for optimization of van der Waals and steric interactions with a variety of targets.25,45 These factors equip CaM with a wide substrate tolerance and high affinity.29,30,46 Thus, calmodulin combines high specificity in folding and EF-hand pairing47,48 with a remarkable promiscuity in target recognition. Most CaM targets have highest affinity for, and are activated only by, CaM with four Ca2+ ions bound. Due to thermodynamic linkage, target binding increases the affinity of CaM for Ca2+, but at basal Ca2+ concentrations (∼0.1 μM) a significant fraction of CaM-target complexes have only two bound Ca2+ ions.37 Although CaM is abundant in all eukaryotic cells (∼2–20 μM49,50), the very large number of targets could make it stoichiometrically limiting in some conditions. In the present work, simulation of model networks with experimentally constrained rate constants and concentrations was used to investigate whether ligand binding dynamics in the CaM network can result in frequency-specific CaM target activation.
Results
Network Model
To explore the role of ligand binding dynamics in the CaM network, the binding interactions among Ca2+, CaM, and target proteins were modeled with differential (eqs 1–5) and mass-balance (eqs 6–8) equations. Importantly, eqs 1–5 can account explicitly for the dynamics of formation and dissociation of intermediary species that are commonly neglected. Solving these equations numerically describes the species distribution and rates of conversion among species in response to trains of Ca2+ transients with defined frequency and durations. A first set of simulations modeled a small network with only two targets, containing in total 12 different species (Figure 2). Calcineurin (CN) and nitric oxide synthase (NOS) were chosen as model target proteins because of the availability of experimental rate constants with divergent ranges (Table 1). This small network was used to determine how the distribution of species varies over time in response to defined Ca2+-oscillation profiles differing in frequency and duration of Ca2+ transients in the presence and absence of competing Mg2+ ions.
Figure 2.

Network model. Reactions and species taken into account in the simulations are shown. Calmodulin (CaM) is shown as a dumbbell indicating its two-domain structure, open circles denote unoccupied Ca2+-binding sites, filled black circles are Ca2+ ions, and the gray oval denotes the jth target protein. The subscript 2C indicates two Ca2+ ions in the C-terminal domain of calmodulin, and subscript j indicates the jth target protein. The top line cartoon and reactions indicate stepwise reversible binding of pairs of Ca2+ ions to calmodulin. The bottom line cartoon and reactions indicate stepwise reversible binding of pairs of Ca2+ ions to calmodulin in complex with the jth target protein. The vertical reactions indicate reversible binding of the jth target.
Table 1. Rate Constants for CN and NOSa.
| Ca2+ binding |
target binding |
||||
|---|---|---|---|---|---|
| ka/μM–2 s–1 | kd/s–1 | ka/μM–1 s–1 | kd/s–1 | refs | |
| CaM | k1 = 65 | k2 = 850 | |||
| k3 = 6 | k4 = 12 | (26, 52) | |||
| CaM CN | k11 = 65 | k21 = 425 | k51 = 46 | k61 = 348 | |
| k31 = 6 | k41 = 0.06 | k71 = 46 | k81 = 0.008 | ||
| k91 = 46 | k101 = 0.0012 | (45, 51) | |||
| CaM NOS | k12 = 65 | k22 = 116 | k52 = 0.13 | k62 = 2.1 | |
| k32 = 60 | k42 = 1 | k72 = 0.13 | k82 = 0.0013 | ||
| k92 = 0.13 | k102 = 2.5 × 10⁻⁵ | (42, 43, 52) | |||
The rate constants for CN and NOS are marked with subindices 1 and 2, respectively, and are according to Figure 2. The association rate constants are designated as ka and have units of μM–2 s–1 for the association of Ca2+ ions (which was modeled as trimolecular; for justification, see Supporting Information Figure S4) and μM–1 s–1 for the association of the targets. The dissociation rate constants are designated as kd and have units of s–1. The constants inferred from the thermodynamic cycles in Supporting Information Figure S2 are underlined.
Low versus High Frequency of Ca2+ Transients
Figure 3A shows the results of simulations of networks including CaM, Ca2+, NOS, and CN at two frequencies of Ca2+ transients. Such trains of Ca2+ transients with similar midwidth duration are commonly measured in nonexcitable cells, such as hepatocytes.6 At low frequency (0.04 Hz, Figure 3A, top left panel), the formation and decay of active complexes (i.e., CaM(Ca)4CN and CaM(Ca)4NOS) closely trace the Ca2+ transients. The concentration of active CN complex is greater than that of NOS during each spike, reflecting their differences in affinity, but all spikes result in equivalent extents of activation because the intertransient intervals (25 s) are long enough for all network species to return to their equilibrium concentrations between spikes. In contrast, at high frequency (1 Hz), the intertransient periods are too short (<1 s) to allow for complete relaxation to equilibrium values, and activation of both target proteins becomes hysteretic (Figure 3A, top right panel). The response to the first transient is identical at both frequencies, but the amplitude of response to subsequent Ca2+ spikes differs. CN becomes more activated on each spike (asymptotically approaching a maximum) and NOS becomes less active on each spike (asymptotically approaching a minimum).
Figure 3.

Activation of CN and NOS by Ca2+ oscillations. Concentrations of network species are shown as a function of time under different simulation conditions. The Mg2+ concentration and the midheight duration of Ca2+ transients are given above each set of panels (A–D). Within each set of panels, the top panels show active species with CaM(Ca)4CN in red and CaM(Ca)4NOS in blue; the middle panels show inactive intermediates with CaM(Ca)2CCN in magenta, CaM(Ca)2CNOS in green, CaM(Ca)2C(Mg)2NCN in yellow, and CaM(Ca)2C(Mg)2NNOS in cyan. The bottom panels show the concentration of free Ca2+ (black), oscillating at low frequency (0.04 Hz; left) and at high frequency (1 Hz; right).
This response is found to depend on the extent to which CaM is redistributed among CaM(Ca)2CCN, CaM(Ca)2CNOS, and free CaM during the intertransient period (Figure 3A middle), governed by the association and dissociation rates. Depending on the frequency of transients, inactive intermediate CaM-target complexes with two Ca2+ ions bound may accumulate between transients. Since binding of Ca2+ to the C-domain of free CaM is slow relative to the duration of individual transients,51 activation of CaM target protein Pj is proportional to CaM(Ca)2CPj at the beginning of the Ca2+ transients. Thus, slow redistribution makes the activation of CaM targets dependent on the timing of Ca2+ transients. Differential activation emerges due to the accumulation of inactive intermediate states and the variation among targets in the rate constants for formation and dissociation of these intermediates. Therefore, the introduction of explicit terms for the intermediary states (eqs 1–5) allows capturing important dynamics that are missed by simpler models. The rate constants in the CaM-Ca2+-target protein network thus permit some target complexes to accumulate, leading to sequestration of CaM, suppression of other target(s), and preferential activation. Therefore, increased frequency can also lead to deactivation for some targets, as observed for NOS (Figure 3). This activation mechanism allows for truly differential regulation, not simply monotonically increasing activation with increasing frequency.
Frequency Dependence
To evaluate the frequency dependence of the observed differential regulation over a wider range of frequencies, simulations with 11 transients of 157 ms duration were carried out for the model network including CN and NOS at 28 frequencies ranging from 0.01 to 5 Hz (data up to 4 Hz shown in Figure 4). The concentration of each active species, CaM(Ca)4CN or CaM(Ca)4NOS, at the 11th transient is shown as a function of frequency in Figure 4, left, and the ratio of the concentrations the two active forms in Figure 4, right. There is not a discrete frequency at which behavior switches from equal response to each transient to altered response to subsequent transients. Rather there is a progressive change in behavior starting already in the very low frequency end (compare first two points in Figure 4). However, around 0.5 Hz, the discrimination between CN and NOS reaches a maximum. This optimum reflects the largest amplification of CN activation and largest suppression of NOS activation around 0.5 Hz. This difference is maintained in the presence of physiological concentrations of Mg2+, although its magnitude diminishes (Figure 4, right) and the peak shifts very slightly to lower frequency values. At frequencies above ∼3 Hz, no difference in the ratio of active species is detected because transients are too rapid to permit species redistribution between spikes. These results suggest that the level of differential activation is largest when the frequency of Ca2+ oscillations is tuned to rates in the system that allow for efficient resonance with the frequency.
Figure 4.
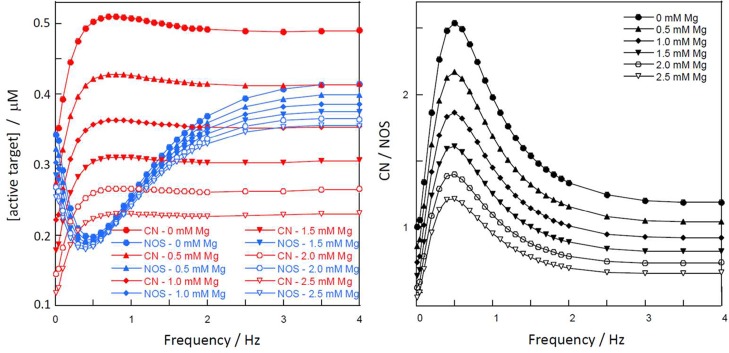
Frequency dependence of CN and NOS activity. (Left) Concentration of active target CN (CaM(Ca)4CN in red) and NOS (CaM(Ca)4NOS in blue) and (right) ratio of concentrations of active species (CaM(Ca)4CN over CaM(Ca)4NOS) on the 11th transient as a function of Ca2+ frequency. Data at the following Mg2+ concentrations are shown: 0 mM (filled circle), 0.5 mM (filled upward triangle), 1.0 mM (filled diamond), 1.5 mM (filled downward triangle), 2.0 mM (open circle), and 2.5 mM (open triangle).
Duration of Ca2+ Transients
Typical durations of transients range from a few milliseconds in excitable cells to around 1 s.6,52 Networks including CaM, Ca2+, NOS, and CN were simulated with two durations of the Ca2+ transients (midheight duration 57 or 157 ms) at frequencies of 0.04 and 1 Hz. As expected, longer transients (midheight duration 157 ms, Figure 3A) result in longer durations of activation for both CN and NOS as compared to shorter transients (57 ms, Figure 3B). Shorter transients lead to a lower level of formation of active species during the transient, and lower intermediate concentration between transients. However, the amplitudes of activation for CN and NOS respond differentially to the change in duration of Ca2+ transients. This is seen mainly at the higher frequency (compare Figure 3A and B, top right panels). Decreasing the duration decreases the amplitude of activation of CN while slightly increasing the amplitude of NOS activation. This reduction is seen mainly for the more slowly dissociating CaM(Ca)2CCN that gives CN less chance to suppress NOS with short transients and the competition is reduced.
Wider Range of Rate Constants
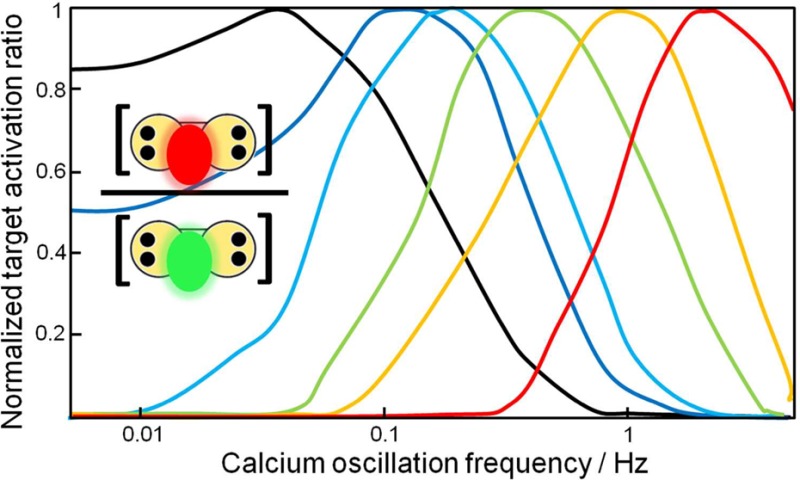
Other combinations of rate constants besides those estimated from experiment for CN and NOS were evaluated to determine the range of values that could lead to target discrimination and a frequency optimum. A set of 2500 hypothetical networks of two targets was generated by picking at random rate constants within the ranges given in Table 2 and protein concentrations in the range 1–100 μM as observed experimentally.14 The tabulated rate constants span many orders of magnitude and encompass all values estimated for the CaM targets that have been studied experimentally, representing affinity variations over 7–9 orders of magnitude. Simulation of each of the 2500 networks was performed with 11 Ca2+ transients of 157 ms duration at 28 frequencies between 0.005 and 5 Hz. Figure 5 shows results for the first 50 networks, which are representative of the simulated set. The ratio of the concentrations of the two active species, CaM(Ca)4P1 and CaM(Ca)4P2, at the 11th transient is normalized to facilitate comparison. For almost all pairs, the data reveal differential regulation and distinct frequency dependence with an optimum within the studied frequency range. Furthermore, the optimum frequency varies considerably among pairs of hypothetical targets. This behavior indicates that if several targets are part of the same network, activation of different groups of targets may occur at different frequencies.
Table 2. Rate Constant Limits for Generic Target Proteinsa.
| Ca2+ binding |
target binding |
|||
|---|---|---|---|---|
| ka/μM–2 s–1 | kd/s–1 | ka/μM–1 s–1 | kd/s–1 | |
| lower limit | k1j = 1 | k2j = 1 | k5j = 0.1 | k6j = 1 × 10⁻⁴ |
| k3j = 0.1 | k4j = 0.001 | k7j = 0.1 | k8j = 1 × 10⁻⁴ | |
| k9j = 0.1 | k10j = 1 × 10⁻⁶ | |||
| upper limit | k1j = 1000 | k2j = 1000 | k5j = 100 | k6j = 100 |
| k3j = 100 | k4j = 10 | k7j = 100 | k8j = 1 | |
| k9j = 100 | k10j = 0.1 | |||
Figure 5.
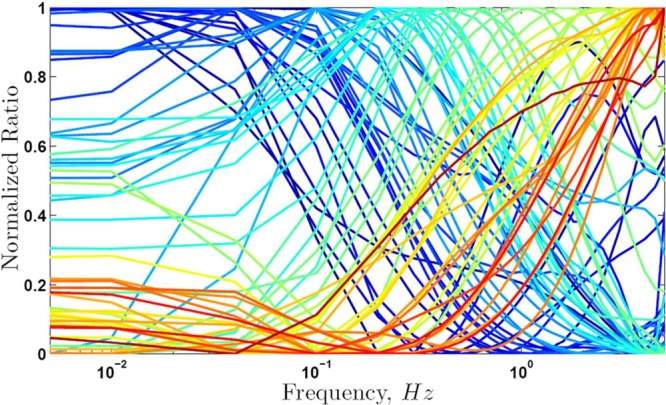
Frequency dependence in generalized networks. Ratio of active targets in a network of two targets using parameters picked randomly within the ranges in Table 2, and calmodulin concentration in the range 1–100 μM. The Ca2+ train consisted of 11 transients with 157 ms midheight duration and simulations were performed at Ca2+ oscillation frequency ranging from 0.005 to 5 Hz. Each curve represents one pair of targets and the different colors are used only to facilitate viewing of the curves.
Networks with Higher Numbers of Targets
To evaluate the effect of increasing the number of targets in a network, simulations were carried out for three sizes of hypothetical networks containing two, four, or eight targets. Protein concentrations were picked at random within the experimentally observed range 1–100 μM,14 and rate constants were varied over 3–6 orders of magnitude within the ranges given in Table 2 to generate 10 000 parameter sets for each network size. All networks were simulated at frequencies of 0.04 and 1 Hz with Ca2+ trains of 11 transients with midheight duration of 157 ms. To compare the level of differential target activation between networks with different numbers of targets, two metrics, ΔPj and ΔA, are introduced. ΔPj measures the fold change in activation of one target at two frequencies. ΔA averages ΔPj over all targets in the network (see eqs 13 and 14 in the Methods section).
For networks of two targets, 92% of the simulated networks yield frequency-dependent activation of target proteins as judged by ΔA values (Figure 6A). For the remaining 8% of parameter sets, ΔA is close to 1, implying no frequency dependence. The fraction of parameter sets yielding frequency-dependent activation (frequency dependence of both ΔPj and ΔA) increases with the number of targets, and already with four targets this fraction is >99%. This behavior is also evident in Figure 6A as distributions shifted toward higher ΔA values when more targets are present in the networks. The networks with 2, 4, and 8 targets proteins have mean ΔA values of 1.58, 2.0, and 2.4, respectively. This trend suggests that inclusion of even more targets will lead to further increase in ΔA. The dispersion of the distribution also decreases with the number of targets. The shifting and narrowing indicate that the number of parameter combinations yielding higher ΔA values is larger when more targets are present in the network. This effect reflects the fact that with more targets, the likelihood is higher that some will have rate constants supporting differential activation between 0.04 and 1 Hz oscillations, that is, having rate constants that allow efficient coupling with the frequency in this range.
Figure 6.
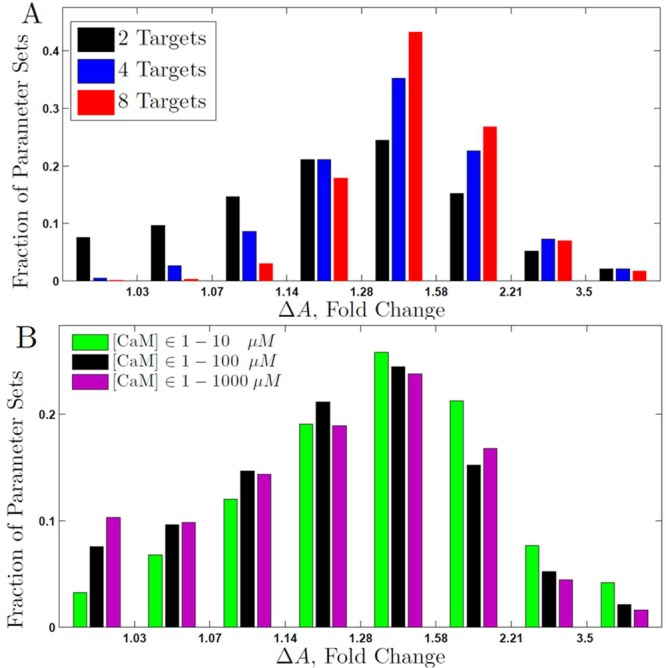
Differential activation in generalized networks. Distribution of ΔA values among 10 000 simulations for generalized networks with rate constants generated at random within the ranges given in Table 2. ΔA is calculated comparing 1 and 0.04 Hz oscillations, and the fractions of simulations yielding the indicated ranges of ΔA values are shown. The simulations used trains of 11 Ca2+ transients with 157 ms midheight duration without Mg2+. (A) Effect of number of targets. ΔA distributions for networks of two (black), four (blue), or eight (red) targets. The calmodulin concentration was chosen randomly in the range 1–100 μM, and the total target concentration in the range 1–100 μM. (B) Effect of limiting calmodulin concentration. Distribution of ΔA values for networks containing two targets and calmodulin concentration sampled in the ranges 1–10 μM (green), 1–100 μM (black), or 1–1000 μM (magenta).
Replotting the graph in Figure 6A for a randomly chosen subset of 6000 simulated parameters from each set shows convergence to the same distribution of ΔA (not shown), indicating that the number of simulated sets is large enough to be representative of calmodulin network behavior over the studied ranges of rate constants. The 100 sets of rate constants that resulted in the smallest or largest differential responses (lowest or highest ΔA values, respectively) are distributed over the whole parameter space (Supporting Information Figure S1). Thus, differential activation of CaM targets depends on the frequency of Ca2+ oscillations for a very wide range of rate constant values.
Competition from Mg2+
Even though binding of Mg2+ to CaM does not lead directly to target activation, Mg2+ competes with Ca2+ for binding to CaM and, thus, influences target activation.35 Mg2+ has opposite domain preferences for CaM, and the complexes CaM(Ca)2C(Mg)2NPj may influence target activation since dissociation of Mg2+ may be slower than the association of Ca2+.35 The role of Mg2+ was investigated by repeating the simulations of the networks containing CN and NOS at 28 different frequencies ranging from 0.01 to 5 Hz in the presence of 0.5, 1, 1.5, 2, or 2.5 mM Mg2+. Inclusion of Mg2+ expands the network from 12 to 19 species and adds four new rate constants. The new species are Mg2+, CaM(Mg)2N, CaM(Mg)4, CaM(Ca)2C(Mg)2NNOS, CaM(Ca)2C(Mg)2NCN, CaM(Mg)4NOS, and CaM(Mg)4CN, whereas CaM(Mg)2C(Ca)2NCN and CaM(Mg)2C(Ca)2NNOS are omitted, as their concentrations will under all circumstances be negligible due to opposite ion preferences of the domains.
Examples of simulations at 0.04 and 1 Hz are shown in Figure 3 at 0.5 mM Mg2+ (Figure 3C) and 2 mM Mg2+ (Figure 3D). The inclusion of Mg2+ affects the level of activated CN much more than NOS over the entire frequency range (data up to 4 Hz shown in Figure 4). The concentration of CaM(Ca)4CN at the 11th transient is reduced in the presence of Mg2+ and shows an almost linear dependence on Mg2+ concentration, whereas the concentration of CaM(Ca)4NOS is largely independent of Mg2+ concentration (Figure 4A). In the presence of 1–2.5 mM Mg2+, CN is more activated than NOS around 0.5 Hz, whereas at both lower and higher frequencies NOS is more activated than CN. Suppression of CN reduces the ratio of CaM(Ca)4CN to CaM(Ca)4NOS over the whole frequency range. Still, the ratio shows a peak around 0.5 Hz at all Mg2+ concentrations tested (Figure 4B), indicating a frequency-dependent difference in activation of the targets in the presence of biologically relevant concentrations of Mg2+.
Calmodulin Concentration
The role of CaM concentration was first evaluated by performing a series of single simulations with 10 μM NOS and 10 μM CN and the CaM concentration set to 1, 2, 5, 10, 20, 50, or 100 μM. When the CaM concentration is lower than the total target concentration, these simulations show a higher level of differential activation with suppression of NOS (data not shown), suggesting sequestration of CaM in CaM(Ca)4CN complexes. Thus, competition for limited CaM leads simultaneously to preferential activation of one target and suppression of the other, implying a mechanism for truly differential regulation, rather than monotonically increasing activation.
The role of CaM concentration was further evaluated by generating 10 000 networks of two targets for each of three concentration ranges of CaM (1–10, 1–100, and 1–1000 μM). Rate constants were selected randomly within the ranges given in Table 2, and concentrations of target proteins in the range 1–100 μM. Figure 6B shows the ΔA distributions for the three CaM concentration ranges. A shift of the distribution to higher ΔA values is seen for networks with CaM concentrations sampled in the range 1–10 μM compared to 1–100 μM, and there is a small shift in the same direction also when 1–100 μM is compared to 1–1000 μM. This indicates that the frequency dependence increases as the CaM concentration range becomes more limited. Although differential activation is maintained even when the concentration of CaM exceeds the total concentration of all targets, it is strongest when CaM is stoichiometrically limiting, as is thought to be the case in vivo.14
Sensitivity Analysis
A sensitivity analysis was carried out for networks with two targets to investigate which parameters are most critical for the appearance of differential activation and to evaluate potential interdependence of parameters. Partial correlations between ΔA and each parameter and between ΔA and each pair of parameters (not shown) were computed based on 10 000 generated networks with protein concentrations in the range 1–100 μM and rate constants in the ranges given in Table 2. The absolute value of each partial correlation is proportional to the influence of the corresponding parameter on ΔA, and its sign indicates whether the influence is negative or positive (see Methods). A negative partial correlation is found between ΔA and the CaM concentration (Figure 7), in agreement with the finding that low CaM concentrations are associated with increased competition between targets. Consistent with the interpretation of the results in Figure 3, the rate constants for association and dissociation of Ca2+ at the C-terminal domain of target-bound CaM, k3j and k4j, have the strongest influence on ΔA, with low values for these rate constants associated with high values of ΔA. This is seen as a negative partial correlation between ΔA and these rate constants (Figure 7). Target proteins for which these rate constants are low have slowly evolving intermediate complexes, leading to enhanced differential activation. Other association rate constants are more weakly correlated with ΔA, either positively (k1j and k9j) or negatively (k7j) except for k5j that is uncorrelated. All dissociation rate constants except k8j are negatively correlated with ΔA, meaning that on average low dissociation rate constants favor high ΔA. The results of the sensitivity analysis thus imply that differences in rates among the intermediate complexes provide the network with frequency dependence and lead to differential activation of targets. The pairwise sensitivity analysis points to a number of interdependencies (data not shown). For example, a synergistic effect is seen between k7j and k8j, suggesting that ΔA increases with the rate of exchange between free target and target bound to CaM with a Ca2+-saturated C-terminal domain. The finding that nearly all rate constants display partial correlation to ΔA and thus contribute to differential regulation suggests that the observed differential activation is an emergent property of the whole network rather than a property arising from the superposition of a few individual interactions.
Figure 7.

Sensitivity analysis. Partial correlation coefficient between ΔA and each varied parameter for 10 000 simulations of networks having two targets and no magnesium. The rate constants kij (indicated by their indices i) are displayed as upward triangle (association rate constants) or downward triangle (dissociation rate constants) and concentrations as filled circles (C1 = total calmodulin concentration, C2 = target concentration).
Discussion
The mechanism described here makes it possible, based on temporal dynamics alone, for a Ca2+-calmodulin signaling network to decode the information in spike timing to distinguish among different cellular pathways that use Ca2+ as a common second messenger. The calmodulin signaling network is thus a striking example of the importance of kinetic discrimination in a system of multiple competing interactions. Both the relative rates of different reactions and the rates of the reactions relative to the timing of the signaling event set up the selectivity among branches of the network. The network is dynamically driven if the intertransient intervals are shorter than the time required for equilibration of the slowest steps in the network. Therefore, the activation of CaM targets is determined by kinetics rather than by affinities except at very low Ca2+ oscillation frequencies.
Kinetic Discrimination
Kinetic competition may arise from differences in association and/or dissociation rates. Association rate differences have, for example, been invoked to explain competition in DNA binding,53 whereas protein folding may rely on longer average lifetime of native relative to non-native contacts.54 For the calmodulin signaling network, differences in both association and dissociation rate constants are found to contribute to differential activation. Differential activation requires that the rates of some binding reactions are low relative to the frequency of the Ca2+ signaling event. Low dissociation rates of some complexes lead to accumulation of intermediates between transients, leading both to fast activation of those targets and suppressed activation of other targets. With intermediates at low concentrations association rates may become slow and rate limiting. High association rates of some targets can deplete CaM and limit association rates of other reactions.
Role of Intermediates
One mechanism for differential activation found here relies on the buildup of the CaM(Ca)2CPj species between transients. Most targets in complexes with CaM having only two Ca2+ ions bound are inactive, and the slow dissociation of CaM(Ca)2CPj reflects the high stability of such complexes. Many Ca2+-activated CaM targets, such as CaN, NOS, myosin light-chain kinase, CaM kinase II, and Ca-ATPase are indeed known to form very stable complexes with Ca2–CaM (KD = k10j/k9j < 100 pM),10,37,55−57 and the isolated C-terminal domain fragment of CaM also has very high affinity for many targets (KD < 1 nM).32 With such high affinities, even the highest measured association rate constants (ka = 108 M–1 s–132,56) imply relatively low dissociation rate constants, koff = KD/ka< 0.1 s–1. The importance of intermediates is underscored by comparing the simulations at high Ca2+ oscillation frequency with those at very low frequency allowing dissociation of the intermediates between transients, under which conditions the level of differential activation is reduced (Figure 3). In some exceptional cases, such as the plasma membrane calcium pump, targets are activated by CaM(Ca)2C,58−60 but can, in competition with targets activated by CaM(Ca)4, be regulated differentially by the kinetic mechanism described here, because dynamics in the CaM signaling network affect species having two Ca2+ ions bound.
Role of Calmodulin Concentration
The mechanism described here for differential activation does not depend directly on the stoichiometry between CaM and target protein. Thus, this mechanism can be responsible for differential activation even when there is a single target protein, as reflected in the frequency dependence of ΔPj. However, the frequency dependence of the accumulation and depletion of intermediate species is enhanced by competition between targets for CaM. Competition is intensified by decreasing concentrations of CaM. Thus limiting CaM concentration enhances differential activation without being necessary for it.
Calmodulin Domain Structure
The results underscore the intricate optimization of CaM structure and function. The basis for hysteretic behavior in the network is the covalent coupling of two domains that bind Ca2+ sequentially, but with cooperativity in each domain, and that cooperate in target binding. The importance of paired sites in each domain is illustrated by the perturbation of target activation by mutations that deteriorate single EF-hands.61 An important contribution to the essential hysteresis underlying the differential response is that CaM-target complexes with two Ca2+ ions bound may persist between transients but only complexes with four Ca2+ ions are active. This effect differs fundamentally from hysteresis due to accumulation of Ca2+ because of slow diffusion. Ca2+ accumulation can only increase the level of target activation, whereas accumulation of intermediates can also decrease the activation of some targets as illustrated by NOS. The high affinity and slow kinetics of Ca2+ binding to the C-terminal domain37 explains why the CaM(Ca)2CPj species play a pivotal role in activation of target proteins. The much higher affinity for Ca2+ compared to the more abundant Mg2+, and the opposite domain preferences of Mg2+ and Ca2+, are also critical and allow differential activation even at physiological Mg2+ concentrations.
Advantages of a Central Hub
The results underscore the many advantages of having the calmodulin signaling network centered on a common hub, calmodulin, as opposed to a signaling network composed of many Ca2+-binding target proteins. A hub network facilitates coupling among network species by linking reactions involving different targets, making the whole network sensitive to the range of temporal dynamics of its most sensitive members. Distributed control would not allow the activation of some targets to suppress other ones one in a frequency sensitive manner, because they would not compete for the same activator. A network centered on one common hub provides a mechanism for the cell to use Ca2+-spike frequency to select which Ca2+-regulated activities should be switched on at elevated Ca2+ concentration, as has indeed been found experimentally62−64 and theoretically.65
Number of Targets
Increasing the number of target types increases the range of temporal dynamics the network can transduce into differential regulation. In the large-scale simulations, this is seen as a shift in the ΔA distribution toward higher values as the number of target types increases. The effects reported here have not saturated in networks with eight targets. Considering the large number of CaM target proteins found in eukaryotic cells,11−23 the reported results are likely to underestimate the level of differential regulation in vivo. Importantly, the mechanism found here for differential activation would permit selective activation even of targets present in very low copy number, as the defining parameters are the rate constants. While association rate depends also on concentration, dissociation rate does not; thus even low copy number targets may build up a high fraction of inactive intermediates between transients.
Temporal versus Spatial Dynamics
The present study considers only temporal and not spatial dynamics in Ca2+ concentration. Slow diffusion of Ca2+ has been explored extensively as a mechanism for nonlinear activation of Ca2+-dependent processes.66 The low spatial resolution of experimental measurements, together with cytoplasmic heterogeneity, are obstacles for accurate modeling of spatial dynamics. However, for CaM target proteins that move slowly relative to the temporal dynamics of Ca2+, such as immobilized or tethered targets or those that are part of large multiprotein complexes, spatial heterogeneity means that CaM targets in different locations experience different temporal dynamics. Thus, the different frequencies in the present simulations serve as a proxy for different locations. The kinetic mechanism described here is fully compatible with and may coexist with other mechanisms for signal modulation, such as alternative splicing of target proteins67,68 and accumulation of Ca2+ in local microdomains.9
Stochasticity
The differential equations used here assume continuous concentrations, whereas the numbers of protein molecules and calcium ions are discrete and potentially small. A typical mammalian cell has a volume of 1 pL, which at the protein concentrations used in the simulations represents 6 × 10⁵–6 × 10⁸ molecules per cell. A simple measure of the effect of stochasticity is the counting error estimated as the coefficient of variation (CV) of Poisson distributions whose expectation values are in the range 6 × 10⁵–6 × 10⁸. At the low end of this range, CV is 0.001, and at the high end it is 4 × 10⁻⁵. These values indicate that the continuous assumption underlying the use of differential equations is reasonable for the binding interactions modeled here.
Amplification from Opposing Activities
Some CaM targets have mutually opposing activities (e.g., adenylate cyclase and cAMP phosphodiesterases) or inhibit each other (e.g., CN and CaMK II). In such cases, modest ΔA values may be amplified by the dynamics of reciprocal inhibition and contribute to differential signal transduction. If CN activity is higher than CaMK II activity, CN will suppress CaMK II activation while at the same time relieving the inhibition of its own activation. Amplification may even result in bistable responses, such as the induction of long-term synaptic potentiation (LTP) and depression (LTD).
Conclusions
Differential target activation in the calmodulin signaling network can be regulated by the Ca2+ oscillation frequency. Differential activation increases with increasing numbers of targets and with decreasing CaM concentration. The underlying mechanism relies on the two-domain structure of CaM, the opposite binding preferences of the two domains for Ca2+ and Mg2+, and differences in association and dissociation rates among target-CaM complexes. Given the generality of the model, it may be relevant to other oscillatory dynamics in signal transduction and transcriptional regulation.69,70.
Methods
Network Model
The network model (Figure 2) includes free Ca2+, free target proteins, calmodulin (CaM) with zero, two or four Ca2+ bound, as well as target-bound CaM with zero, two, or four Ca2+ bound. With one target protein, the network thus contains 8 species (Ca2+, CaM, CaM(Ca)2C, CaM(Ca)4, Pj, CaMPj, CaM(Ca)2CPj, CaM(Ca)4Pj) and 14 rate constants (Figure 2). Each additional target adds 4 species (Pj, CaMPj, CaM(Ca)2CPj, CaM(Ca)4Pj) and 10 rate constants to the network. Due to positive cooperativity of Ca2+ binding within each domain,31 complexes of CaM with one or three Ca2+ ions bound will have much lower concentration (Figure 1D) and only those with zero, two or four Ca2+ ions bound are considered in the model. The lower affinity and faster dissociation of Ca2+ from the N-terminal domain make the concentrations of CaM(Ca)2N and CaM(Ca)2NPj insignificant (37) and these species were not included in the model. In the initial simulations with two targets, the total concentrations of CaM and targets were all fixed at 5 μM. In larger-scale simulations with networks of two, four, or eight hypothetical targets, target concentrations were sampled from the range 1–100 μM, and CaM concentration in the ranges 1–10, 1–100, or 1–1000 μM.
Rate Equations
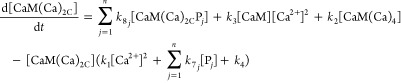
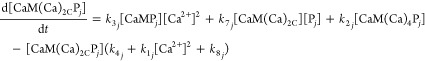
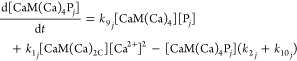
Differential mass-action equations (eq 1–5) and mass-balance equations (eq 6–8) describe the rates of conversion between species and species distribution. Each differential equation describes the rate of change in the concentration of one species and contains production terms accounting for the reactions that generate the species, and degradation terms accounting for the reactions that consume the species. The equations are written in a general form for the jth target protein (Pj) to model networks containing any number of targets. For n targets there are 2 + 3n differential equations and 1 + 2n mass balance equations.
| 1 |
 |
2 |
| 3 |
 |
4 |
 |
5 |
| 6 |
| 7 |
| 8 |
where [Ca2+] denotes free Ca2+ concentration, [CaM] the free CaM concentration, [CaM(Ca)2C] the concentration of CaM with two Ca2+ ions bound to its C-terminal domain, [Pj] the free concentration of the jth target protein, and [CaM(Ca)iPj] the concentration of the complex of CaM and the jth target protein having i Ca2+ ions bound.
Rate Constants
The binding of Ca2+ to CaM is described by four rate constants (k1, k2, k3, and k4; Figure 2) with values that have been reported by multiple laboratories (Table 1). Using eqs 9–12, two rate constants (k2j and k4j) were expressed in terms of the remaining eight rate constants. For nitric oxide synthase and calcineurin, some equilibrium and rate constants have been estimated experimentally;10,55−57,71−73 their values and the sources of the rate constants are listed in Table 1. The association rate constants for Ca2+ binding to CaM complexed to these targets are unknown but could be calculated from the other values using eqs 11 and 12. These rate constants are listed in Table 1 as inferred. Equations 9 and 10 describe the thermodynamic cycles by which the binding reactions are linked; ΔGC and ΔGP,C are the free energy of Ca2+ binding to free and target-bound CaM, respectively, and ΔGP and ΔGC,P are the free energy of target binding to free and Ca2+-bound CaM, respectively.
| 9 |
| 10 |
| 11 |
| 12 |
In larger scale simulations with generalized networks of two, four, or eight targets, the sets of rate constants for each target were sampled randomly from the log-scale ranges established by the upper and lower limits presented in Table 2. These limits were chosen to encompass the highest and the lowest values reported in the literature.52,55 Each set of parameters was generated as follows. Each unknown rate constant, except k2j and k4j, was sampled randomly from the log range for its values, and the sampled values were used to compute k2j and k4j. Sets of rate constants were discarded if they correspond to target proteins with target affinity for CaM(Ca)4 lower than that for CaM(Ca)2; target affinity for CaM(Ca)2 weaker than 105 M–1 (KD > 10 μM); or Ca2+ affinity of the N-terminal CaM domain in target complexes greater than 107 M–1 (KD < 0.1 μM).32 Such targets cannot be regulated by Ca2+ transients because CaM-target complexes would be more than half-saturated even at basal concentrations of free Ca2+ (∼0.1 μM).
Ca2+-Concentration Profile
A train of Ca2+ spikes was generated as a piece-wise continuous function as follows.
τ(i) is the start position of the ith transient in the train. This yields trains of identical Ca2+ transients with peak [Ca2+] = 1 μM separated by intertransient periods with [Ca2+] = 0.1 μM, closely resembling the experimentally measured profiles.5,6 Each transient lasted for one-half-period of the sine wave, and the midheight duration is t1/2 = 2ω–1[arcsin(1) – arcsin (2–1/n)]. This work used ω = 10 and n = 2 yielding t1/2 = 157 ms, or ω = 20 and n = 4 yielding t1/2 = 57 ms.
Simulations
To investigate the activation of CaM target proteins in response to the train of Ca2+ transients, the evolution of the different species in the network was calculated using eqs 1–8. The system of coupled differential equations was integrated using numerical and backward differentiation formulas74 with adaptive time steps ranging from 10 fs to 10 ms. In test simulations of networks with two target proteins, the numerical integration was performed with a modified Rosenbrock formula of order 2 (ref (74)) and gave the same results, indicating numerical convergence and to the absence of large systematic errors.
Including Mg2+
The binding of Mg2+ was modeled in analogy with the binding of Ca2+. The Ca2+ and Mg2+ networks are coupled by the following elementary reactions involving mixed species with both Ca2+ and Mg2+.
Dissociation of Mg2+ from the N-terminal sites may be rate limiting for binding of Ca2+, and is described by the combination of elementary reactions. The species CaM(Mg)2C and CaM(Mg)2C(Ca)2NPj were not included because Mg2+ has opposite preference for the two domains of CaM compared to Ca2+ and competes for the N-terminal domain only. As found experimentally, the binding of Mg2+ to one CaM domain does not change the affinity of the other domain for Ca2+ or the affinity of CaM for target protein.35 By thermodynamic linkage, the presence of targets does not alter the affinity of CaM for Mg2+. Thus, the rate constants for binding of a target are assumed to be unaffected by Mg2+ binding, and the rate constants for the binding of Mg2+ to one domain are not altered by the binding Ca2+ to the other domain or by the binding of targets. These assumptions reduce to four the number of new rate constants needed to include Mg2+. The values used for these four constants are found in Table 3.
Table 3. Rate Constants for Mg2+a.
| ka/mM–1s–1 | kd/s–1 |
|---|---|
| k1m = 172 | k2m = 380 |
| k3m = 127 | k4m = 1635 |
Rate constants for association and dissociation of Mg2+ from ref (34 and 35). For notation see Supporting Information Figure S3.
Metrics for Differential Activation
Two metrics ΔPj (eq 13) and ΔA (eq 14) are defined to quantify differential activation in the large-scale simulations. Two oscillations are compared that have eleven identical Ca2+ transients and differ only in the time intervals between successive Ca2+ transients.
| 13 |
| 14 |
ΔPj quantifies the fold increase in the activation of the jth target protein (Pj) as a function of the intertransient periods T1 and T2. ΔA is the arithmetic average of the absolute values of ΔPj for all CaM target proteins included in the simulation. CjT1, CjT2, and CjB are the concentrations of active complexes, CaM(Ca)4Pj, during transients with periods T1 and T2, and at basal [Ca2+] = 0.1 μM, and n is the number of target proteins in the network. t1 and t2 are the durations of the trains of transients (oscillations) with frequencies 1/T1 and 1/T2, respectively. t1T1= t2T2, that is, the number of Ca2+ transients, is the same for both frequencies.
Sensitivity Analysis
Partial correlations were calculated between ΔA and each parameter (α1) for the 10 rate constants k1j–k10j and the total concentrations of CaM (C1) and target proteins (C2), as well as between ΔA and each pair of parameters (α2):
| 15 |
| 16 |
P is a matrix in which each column corresponds to a parameter and each row is a simulated set of parameters. dA is a vector with the corresponding values of differential activation. Each column of P contains the Z-scores of one parameter, meaning the simulated values of that parameter normalized to have zero mean and unit variance to permit comparison on the same scale of parameters with orders-of-magnitude differences in their dynamic ranges. Similar to P, Q is a matrix containing all pairwise products of parameters, for example, the first column is the Z-score (normalized to zero mean and unit variance) of the element-wise product of the first and second columns of P, the second column of Q is the Z-score of the pairwise product of the first and the third columns in P and so on. This overdetermined linear system (in the least-squares sense) is solved for ε1 and ε2, the vectors of partial correlations. The interdependence between a pair of parameters (say, i and j) is measured by the difference between the ε2 element corresponding to i and j and the product of ε1 elements corresponding to i and j. This approach is a simplification that decomposes a nonlinear dependence into a set of component functions (second order polynomials), which approximate the influence of each parameter on the level of differential activation.
Acknowledgments
We thank R. J. P. Williams, R.H. Kretsinger, and Ned Wingreen for their insightful comments on the manuscript. The help with typing by Ingrid Hughes is gratefully acknowledged.
Supporting Information Available
Additional figures as described in the text. This material is available free of charge via the Internet at http://pubs.acs.org.
Author Present Address
∥ N.S.: Massachusetts Institute of Technology, Cambridge, MA 02139, USA.
This work was supported by the Crafoord Foundation, Lund (S.L.), Swedish Research Foundation (S.L.), and the Linneaus Centre Organizing Molecular Matter (S.L., J.C.).
The authors declare no competing financial interest.
This paper was published on the Web on February 5, 2013, with a missing operator from the last term in eq 2. The corrected version was reposted on February 12, 2013.
Supplementary Material
References
- Kupzig S.; Walker S. A.; Cullen P. J. (2005) The frequencies of calcium oscillations are optimized for efficient calcium-mediated activation of ras and the ERK/MAPK cascade. Proc. Natl. Acad. Sci. U.S.A. 102, 7577–7582. [DOI] [PMC free article] [PubMed] [Google Scholar]
- Dolmetsch R. E.; Xu K.; Lewis R. S. (1998) Calcium oscillations increase the efficiency and specificity of gene expression. Nature 392, 933–936. [DOI] [PubMed] [Google Scholar]
- Saucerman J. J.; Bers D. M. (2008) Calmodulin mediates differential sensitivity of CaMKII and calcineurin to local Ca2+ in cardiac myocytes. Biophys. J. 95, 4597–4612. [DOI] [PMC free article] [PubMed] [Google Scholar]
- Berridge M. J. (2012) Calcium signalling remodelling and disease,,. Biochem. Soc. Trans. 40, 297–309. [DOI] [PubMed] [Google Scholar]
- Berridge M. J.; Bootman M. D.; Roderick H. L. (2003) Calcium signalling: dynamics, homeostasis and remodelling. Nat. Rev. Mol. Cell. Biol. 4, 517–529. [DOI] [PubMed] [Google Scholar]
- Berridge M. J. (2005) Unlocking the secrets of cell signaling. Annu. Rev. Physiol. 67, 1–21. [DOI] [PubMed] [Google Scholar]
- Ng C. K.; McAinsh M. R. (2003) Encoding specificity in plant calcium signalling: hot-spotting the ups and downs and waves. Ann. Bot. 92, 477–485. [DOI] [PMC free article] [PubMed] [Google Scholar]
- Tran Q. K.; Black D. J.; Persechini A. (2005) Dominant affectors in the calmodulin network shape the time courses of target responses in the cell. Cell Calcium 37, 541–553. [DOI] [PubMed] [Google Scholar]
- Naoki H.; Sakumura Y.; Ishii S. (2005) Local signaling with molecular diffusion as a decoder of Ca2+ signals in synaptic plasticity. Mol. Syst. Biol. 1, 2005.0027. [DOI] [PMC free article] [PubMed] [Google Scholar]
- Stefan M. I.; Edelstein S. J.; Le Novère N. (2008) An allosteric model of calmodulin explains differential activation of PP2B and CaMKII. Proc. Natl. Acad. Sci. U.S.A. 105, 10768–10773. [DOI] [PMC free article] [PubMed] [Google Scholar]
- Yap K. L.; Kim J.; Truong K.; Sherman M.; Yuan T.; Ikura M. (2000) Calmodulin target database. J. Struct. Funct. Genomics 1, 8–14. [DOI] [PubMed] [Google Scholar]
- Zhu H.; Bilgin M.; Bangham R.; Hall D.; Casamayor A.; Bertone P.; Lan N.; Jansen R.; Bidlingsmaier S.; Houfek T.; Mitchell T.; Miller P.; Dean R. A.; Gerstein M.; Snyder M. (2001) Global analysis of protein activities using proteome chips. Science 293, 2101–2105. [DOI] [PubMed] [Google Scholar]
- Ikura M.; Osawa M.; Ames J. B. (2002) The role of calcium-binding proteins in the control of transcription: structure to function. Bioessays 24, 625–636. [DOI] [PubMed] [Google Scholar]
- Kahl C. R.; Means A. R. (2003) Regulation of cell cycle progression by calcium/calmodulin-dependent pathways. Endocr. Rev. 24, 719–736. [DOI] [PubMed] [Google Scholar]
- Shen X.; Valencia C. A.; Szostak J. W.; Dong B.; Liu R. (2005) Scanning the human proteome for calmodulin-binding proteins. Proc. Natl. Acad. Sci. U. S. A. 102, 5969–5974. [DOI] [PMC free article] [PubMed] [Google Scholar]
- Xia Z.; Storm D. R. (2005) The role of calmodulin as a signal integrator for synaptic plasticity. Nat. Rev. Neurosci. 6, 267–276. [DOI] [PubMed] [Google Scholar]
- Berggård T.; Arrigoni G.; Olsson O.; Fex M.; Linse S.; James P. (2006) 140 mouse brain proteins identified by Ca2+-calmodulin affinity chromatography and tandem mass spectrometry. J. Proteome Res. 5, 669–687. [DOI] [PubMed] [Google Scholar]
- Clapham D. E. (2007) Calcium Signaling. Cell 131, 1047–1058. [DOI] [PubMed] [Google Scholar]
- Popescu S. C.; Popescu G. V.; Bachan S.; Zhang Z.; Seay M.; Gerstein M.; Snyder M.; Dinesh-Kumar S. P. (2007) Differential binding of calmodulin-related proteins to their targets revealed through high-density Arabidopsis protein microarrays. Proc. Natl. Acad. Sci. U.S.A. 104, 4730–4735. [DOI] [PMC free article] [PubMed] [Google Scholar]
- Calabria L. K.; Garcia Hernandez L.; Teixeira R. R.; Valle de Souza M.; Espindola F. S. (2008) Identification of calmodulin-binding proteins in brain of worker bees. Comp. Biochem. Physiol., Part B: Biochem. Mol. Biol. 15, 41–45. [DOI] [PubMed] [Google Scholar]
- Bauer M. C.; O’Connell D.; Cahill D. J.; Linse S. (2008) Calmodulin binding to the polybasic C-termini of STIM proteins involved in store-operated calcium entry. Biochemistry 47, 6089–6091. [DOI] [PubMed] [Google Scholar]
- Shen X.; Valencia C. A.; Gao W.; Cotten S. W.; Dong B.; HUang B. C.; Liu R. (2008) Ca2+/Calmodulin binding proteins from the C. elegans proteome. Cell Calcium 43, 444–456. [DOI] [PubMed] [Google Scholar]
- O’Connell D. J.; Bauer M. C.; O’Brien J.; Johnson W. M.; Divizio C. A.; O’Kane S. L.; Berggård T.; Merino A.; Åkerfeldt K. S.; Linse S.; Cahill D. J. (2010) Integrated protein array screening and high throughput validation of 70 novel neural calmodulin-binding proteins. Mol. Cell Proteomics 9, 1118–1132. [DOI] [PMC free article] [PubMed] [Google Scholar]
- O’Connell D. J. Bauer M., Marshall C., Ikura M., and Linse S. (2013) Calmodulin. In Encylopedia of Metalloproteins (Kretsinger, Uversky, and Permyakov, Eds.), Springer. [Google Scholar]
- Hoeflich K. P.; Ikura M. (2002) Calmodulin in action: diversity in target recognition and activation mechanisms. Cell 108, 739–742. [DOI] [PubMed] [Google Scholar]
- Kawasaki H.; Nakayama S.; Kretsinger R. H. (1998) Classification and evolution of EF-hand proteins. Biometals 11, 277–295. [DOI] [PubMed] [Google Scholar]
- Moncrief N. D.; Kretsinger R. H.; Goodman M. (1990) Evolution of EF-hand calcium-modulated proteins. I. Relationships based on amino acid sequences. J. Mol. Evol. 30, 522–562. [DOI] [PubMed] [Google Scholar]
- Wang B.; Martin S. R.; Newman R. A.; Hamilton S. L.; Shea M. A.; Bayley P. M.; Beckingham K. M. (2004) Biochemical properties of V91G calmodulin: A calmodulin point mutation that deregulates muscle contraction in Drosophila. Protein Sci. 13, 3285–3297. [DOI] [PMC free article] [PubMed] [Google Scholar]
- Persechini A.; Kretsinger R. H. (1998) The central helix of calmodulin functions as a flexible tether. J. Biol. Chem. 263, 12175–12178. [PubMed] [Google Scholar]
- Chou J. J.; Li S.; Klee C. B.; Bax A. (2001) Solution structure of Ca(2+)-calmodulin reveals flexible hand-like properties of its domains. Nat. Struct. Biol. 8, 990–997. [DOI] [PubMed] [Google Scholar]
- Linse S.; Helmersson A.; Forsén S. (1991) Calcium binding to calmodulin and its globular domains. J. Biol. Chem. 266, 8050–8054. [PubMed] [Google Scholar]
- Peersen O. B.; Madsen T. S.; Falke J. J. (1997) Intermolecular tuning of calmodulin by target peptides and proteins: Differential effects on Ca+2 binding and implications for kinase activation. Protein Sci. 6, 794–807. [DOI] [PMC free article] [PubMed] [Google Scholar]
- Martin S. R.; Andersson Teleman A.; Bayley P. M.; Drakenberg T.; Forsén S. (1985) Kinetics of calcium dissociation from calmodulin and its tryptic fragments. A stopped-flow fluorescence study using Quin 2 reveals a two-domain structure. Eur. J. Biochem. 151, 543–550. [DOI] [PubMed] [Google Scholar]
- Malmendal A.; Evenäs J.; Thulin E.; Gippert G. P.; Drakenberg T.; Forsén S. (1998) When Size Is Important. J. Biol. Chem. 273, 28994–29001. [DOI] [PubMed] [Google Scholar]
- Martin S. R.; Masino L.; Bayley P. M. (2000) Enhancement by Mg2+ of domain specificity in Ca?+-dependent interactions of calmodulin with target sequences. Protein Sci. 9, 2477–2488. [DOI] [PMC free article] [PubMed] [Google Scholar]
- Malmendal A.; Linse S.; Evenäs J.; Forsén S.; Drakenberg T. (1999) Battle for the EF-hands: Magnesium-Calcium Interference in Calmodulin. Biochemistry 38, 11844–11850. [DOI] [PubMed] [Google Scholar]
- Bayley P. M.; Findlay W. A.; Martin S. R. (1996) Target recognition by calmodulin: Dissecting the kinetics and affinity of interaction using short peptide sequences. Protein Sci. 5, 1215–1228. [DOI] [PMC free article] [PubMed] [Google Scholar]
- Linse S.; Drakenberg T.; Forsén S. (1986) Mastoparan binding induces a structural change affecting both the N-terminal and C-terminal domains of calmodulin. A 113Cd-NMR study. FEBS Lett. 199, 28–32. [DOI] [PubMed] [Google Scholar]
- Ikura M.; Clore G. M.; Gronenborn A. M.; Zhu G.; Klee C. B.; Bax A. (1992) Solution structure of a calmodulin-target peptide complex by multidimensional NMR. Science 256, 632–638. [DOI] [PubMed] [Google Scholar]
- Meador W. E.; Means A. R.; Quiocho F. A. (1992) Target enzyme recognition by calmodulin: 2.4 A structure of a calmodulin-peptide complex. Science 257, 1251–1255. [DOI] [PubMed] [Google Scholar]
- Stigler J.; Ziegler F.; Gieseke A.; Gebhardt J. C.; Rief M. (2011) The complex folding network of single calmodulin molecules. Science 334, 512–516. [DOI] [PubMed] [Google Scholar]
- André I.; Kesvatera T.; Jönsson B.; Åkerfeldt K. S.; Linse S. (2004) The role of electrostatic interactions in calmodulin-peptide complex formation. Biophys. J. 87, 1929–1938. [DOI] [PMC free article] [PubMed] [Google Scholar]
- André I.; Kesvatera T.; Jönsson B.; Linse S. (2006) Salt enhances calmodulin-target binding. Biophys. J. 90, 2903–2910. [DOI] [PMC free article] [PubMed] [Google Scholar]
- Hellstrand E., Kukora S., Shuman C. F., Steenbergen S., Thulin E., Kohli A., Krouse B., Linse S., and Åkerfeldt K. S.. FRET studies of calmodulin produced by native protein ligation reveal inter-domain electrostatic repulsion. Submitted. [DOI] [PubMed]
- Yamniuk A. P.; Vogel H. J. (2004) Calmodulin’s flexibility allows for promiscuity in its interactions with target proteins and peptides. Mol. Biotechnol. 27, 33–57. [DOI] [PubMed] [Google Scholar]
- Osawa M.; Swindells M. B.; Tanikawa J.; Tanaka T.; Mase T.; Furuya T.; Ikura M. (1998) Solution structure of calmodulin-W-7 complex: the basis of diversity in molecular recognition. J. Mol. Biol. 276, 165–176. [DOI] [PubMed] [Google Scholar]
- Linse S.; Voorhies M.; Norström E.; Schultz D. A. (2000) An EF-hand phage display study of calmodulin subdomain pairing. J. Mol. Biol. 296, 473–486. [DOI] [PubMed] [Google Scholar]
- Shuman C.; Jiji R.; Åkerfeldt K. S.; Linse S. (2006) Reconstitution of calmodulin from domains and subdomains: Influence of target peptide. J. Mol. Biol. 358, 870–881. [DOI] [PubMed] [Google Scholar]
- Chin D.; Means A. R. (2000) Calmodulin: a prototypical calcium sensor. Trends Cell Biol. 10, 322–328. [DOI] [PubMed] [Google Scholar]
- Kakiuchi S.; Yasuda S.; Yamazaki R.; Teshima Y.; Kanda K.; Kakiuchi R.; Sobue K. (1982) Quantitative determinations of calmodulin in the supernatant and particulate fractions of mammalian tissues. J. Biochem. 92, 1041–1048. [DOI] [PubMed] [Google Scholar]
- Bhalla U. S. (2002) Biochemical Signaling Networks Decode Temporal Patterns of Synaptic Input. J. Comput. Neurosci. 13, 49–62. [DOI] [PubMed] [Google Scholar]
- Rubin J. E.; Gerkin R. C.; Bi G. Q.; Chow C. C. (2005) Calcium Time Course as a Signal for Spike-Timing–Dependent Plasticity. J. Neurophysiol. 93, 2600–2613. [DOI] [PubMed] [Google Scholar]
- Nordell P.; Westerlund F.; Wilhelmsson L. M.; Nordén B.; Lincoln P. (2007) Kinetic recognition of AT-rich DNA by Ruthenium Complexes. Angew. Chem., Int. Ed. 46, 2203–2206. [DOI] [PubMed] [Google Scholar]
- Linse S.; Linse B. (2007) Protein folding through kinetic discrimination. J. Am. Chem. Soc. 129, 8481–8486. [DOI] [PubMed] [Google Scholar]
- Zhang M.; Vogel H. J. (1994) Characterization of the calmodulin-binding domain of rat cerebellar nitric oxide synthase. J. Biol. Chem. 269, 981–985. [PubMed] [Google Scholar]
- Waxham M. N.; Tsai A. L.; Putkey J. A. (1998) A mechanism for calmodulin (CaM) trapping by cam-kinase ii defined by a family of cam-binding peptides. J. Biol. Chem. 273, 17579–17584. [DOI] [PubMed] [Google Scholar]
- Quintana A. R.; Wang D.; Forbes J. E.; Waxham M. N. (2005) Kinetics of calmodulin binding to calcineurin. Biochem. Biophys. Res. Commun. 334, 674–680. [DOI] [PubMed] [Google Scholar]
- Guerini D.; Krebs J.; Carafoli E. (1984) Stimulation of the purified erythrocyte Ca2+-ATPase by tryptic fragments of calmodulin. J. Biol. Chem. 259, 15172–15177. [PubMed] [Google Scholar]
- Elshorst B.; Hennig M.; Försterling H.; Diener A.; Maurer M.; Schulte P.; Schwalbe H.; Griesinger C.; Krebs J.; Schmid H.; Vorherr T.; Carafoli E. (1999) NMR solution structure of a complex of calmodulin with a binding peptide of the Ca2+ pump. Biochemistry 38, 12320–12332. [DOI] [PubMed] [Google Scholar]
- Bayer K. U.; De Koninck P.; Schulman H. (2002) Alternative splicing modulates the frequency-dependent response of CaMKII to Ca(2+) oscillations. EMBO J. 21, 3590–3597. [DOI] [PMC free article] [PubMed] [Google Scholar]
- Gao Z. H.; Krebs J.; VanBerkum M. F.; Tang W. J.; Maune J. F.; Means A. R.; Stull J. T.; Beckingham K. (1993) Activation of four enzymes by two series of calmodulin mutants with point mutations in individual Ca2+ binding sites. J. Biol. Chem. 268, 20096–20104. [PubMed] [Google Scholar]
- De Koninck P.; Schulman H. (1998) Sensitivity of CaM kinase II to the frequency of Ca2+ oscillations. Science 279, 227–230. [DOI] [PubMed] [Google Scholar]
- Dupont G.; Houart G.; De Koninck P. (2003) Sensitivity of CaM kinase ii to the frequency of CaM oscillations: a simple model. Cell. Calcium 34, 485–497. [DOI] [PubMed] [Google Scholar]
- Bradshaw J. M.; Kubota Y.; Meyer T.; Schulman H. (2003) An ultrasensitive Ca2+/calmodulin-dependent protein kinase Il protein phosphatase 1 switch facilitates specificity in postsynaptic calcium signaling. Proc. Natl. Acad. Sci. U.S.A. 100, 10512–10517. [DOI] [PMC free article] [PubMed] [Google Scholar]
- Gall D.; Baus E.; Dupont G. (2000) Activation of the liver glycogen phosphorylase by Ca2+ oscillations: a theoretical study. J. Theor. Biol. 207, 445–454. [DOI] [PubMed] [Google Scholar]
- Naoki H.; Sakumura Y.; Ishii S. (2005) Local signaling with molecular diffusion as a decoder of Ca2+ signals in synaptic plasticity. Mol. Syst. Biol. 1, 2005.0027. [DOI] [PMC free article] [PubMed] [Google Scholar]
- Strehler E. E.; Zacharias D. A. (2001) Role of alternative splicing in generating isoform diversity among plasma membrane calcium pumps. Physiol. Rev. 81, 21–50. [DOI] [PubMed] [Google Scholar]
- Brini M. (2009) Plasma membrane Ca(2+)-ATPase: from a housekeeping function to a versatile signaling role. Pflugers Arch. 457, 657–664. [DOI] [PubMed] [Google Scholar]
- Hao N.; O’Shea E. K. (2012) Signal-dependent dynamics of transcription factor translocation controls gene expression. Nat. Struct. Mol. Biol. 19, 31–39. [DOI] [PMC free article] [PubMed] [Google Scholar]
- Slavov N.; Macinskas J.; Caudy A.; Botstein D. (2011) Metabolic cycling without cell division cycling in respiring yeast. Proc. Natl. Acad. Sci. U. S. A. 108, 19090–19095. [DOI] [PMC free article] [PubMed] [Google Scholar]
- Hashimoto Y.; Soderling T. (1989) Regulation of calcineurin by phosphorylation. Identification of the regulatory site phosphorylated by Ca+2/calmodulin-dependent protein kinase II and protein kinase C. J. Biol. Chem. 264, 16524–16529. [PubMed] [Google Scholar]
- Perrino B. A.; Ng L. Y.; Soderling T. R. (1995) Calcium regulation of calcineurin phosphatase activity by its B subunit and calmodulin. J. Biol. Chem. 270, 340–346. [DOI] [PubMed] [Google Scholar]
- Persechini A.; White H. D.; Gansz K. J. (1996) Different mechanisms for Ca2+ dissociation from complexes of calmodulin with nitric oxide synthase or myosin light chain kinase. J. Biol. Chem. 271, 62–67. [DOI] [PubMed] [Google Scholar]
- Shampine F. L.; Reichelt M. W. (1997) The MATLAB ODE Suite. SIAM J. Sci. Comput. 18, 1–22. [Google Scholar]
- Koradi R.; Billeter M.; Wüthrich K. (1996) MOLMOL: a program for display and analysis of macromolecular structures. J. Mol. Graphics 14, 29–32. [DOI] [PubMed] [Google Scholar]
Associated Data
This section collects any data citations, data availability statements, or supplementary materials included in this article.