

Abstract
Objectives
To determine whether a hypocaloric diet higher in protein can prevent the loss of lean mass that is commonly associated with weight loss.
Design
An intervention study comparing a hypocaloric diet moderately high in protein to one lower in protein.
Setting
Study measurements were taken at the Wake Forest University General Clinical Research Center (GCRC) and Geriatric Research Center (GRC).
Participants
Twenty-four post-menopausal, obese women (mean age = 58 ± 6.6 yrs; mean BMI = 33.0 ± 3.6 kg/m2).
Intervention
Two 20-week hypocaloric diets (both reduced by 2800 kcal/wk) were compared: one maintaining dietary protein intake at 30% of total energy intake (1.2-1.5 g/kg/d; HI PROT), and the other maintaining dietary protein intake at 15% of total energy (0.5-0.7 g/kg/d; LO PROT). The GCRC metabolic kitchen provided lunch and dinner meals which the women picked up 3 days per week and ate outside of the clinic.
Measurements
Body composition, including total body mass, total lean mass, total fat mass, and appendicular lean mass, assessed by dual energy x-ray absorptiometry, was measured before and after the diet interventions.
Results
The HI PROT group lost 8.4 ± 4.5 kg and the LO PROT group lost 11.4 ± 3.8 kg of body weight (p = 0.11). The mean percentage of total mass lost as lean mass was 17.3% ± 27.8% and 37.5% ± 14.6%, respectively (p = 0.03).
Conclusion
Maintaining adequate protein intake may reduce lean mass losses associated with voluntary weight loss in older women.
Keywords: Hypocaloric diet, protein intake, lean mass, elderly
Introduction
The prevalence of overweight and obesity is increasing in older adults (1), with a concomitant decrease in quality of life (2). In addition, overweight and obesity are associated with multiple health problems common in older adults, including heart disease, diabetes, cancer, lung disease, osteoarthritis, stroke, and gall bladder disease (3-5). Despite the high prevalence and health complications of obesity, there has been a reluctance of the medical community to advocate that older adults voluntarily lose weight. Aging is associated with a progressive loss of skeletal muscle mass (sarcopenia) that is associated with functional impairment and may reduce the ability to withstand acute illness episodes (6). Weight loss from hypocaloric diets leads to the loss of muscle mass, along with fat mass, and thus the net benefit of weight reduction in older adults is uncertain, as the loss of lean tissue may lead to increased risk of physical function impairments and mortality (7, 8).
While there are overall decreases in lean mass with weight loss, the percentage of total body mass lost as lean mass during hypocaloric dieting varies widely (0-50%), indicating the potential presence of factors that may modify the degree of lean mass loss (9-11). Given the high prevalence of obesity and its complications in the elderly and concerns about sarcopenia, determining the potentially modifiable factors that play a role in determining the loss of muscle mass during weight loss is an area of investigation with important clinical relevance.
Variation in dietary protein intake may be one of the factors contributing to individual differences in the amount of lean body mass lost during voluntary weight loss. The current Recommended Dietary Allowance (RDA) for protein for all adults is 0.8 g/kg/d. This intake level may be inadequate to maintain muscle mass for adults who are intentionally restricting caloric intake for weight loss. For example, in adult women, a higher protein (1.6 g/kg/d) diet (1700 kcal/d) alone, and combined with resistance/aerobic exercise, resulted in significantly greater total weight loss and fat mass loss than a similar diet containing lower protein (0.8 g/kg/d) alone and combined with exercise (12); however, loss of lean mass was greatest in those consuming 0.8 g protein/kg/d (12). Thus, addition of more dietary protein may help maintain lean mass in adults who are also restricting caloric intake in an effort to lose weight. Therefore, the purpose of this study was to determine if a protein intake of >1.2 g/kg/d (1.5 times the RDA) during hypocaloric feeding reduces the loss of lean body mass compared to a lower protein, hypocaloric diet (<0.8 g/kg/d) in older, overweight or obese women.
Methods
Subjects
Women were recruited from Forsyth County and surrounding areas in North Carolina to participate in a 20-week study comparing two hypocaloric diets: a lower protein diet (LO PROT) vs. a higher protein diet (HI PROT). Women were enrolled in the study based on the following inclusion/exclusion criteria: 1) overweight or obese (BMI = 25–40 kg/m2, waist circumference > 36 in), 2) older (age = 50–70 yrs), 3) postmenopausal (no menses) for at least 1 year, 4) nonsmoking, 5) not on hormone replacement therapy, 6) sedentary (< 15 min exercise two times/wk) in the past 6 months, and 7) weight stable (< 5% weight change) for at least 6 months prior to enrollment. All women provided informed consent to participate in the study according to the guidelines set forth by the Wake Forest University Institutional Review Board for Human Research.
Initial screening included a review of medical history, a physical exam, and fasting blood samples. Those with evidence of untreated hypertension (blood pressure > 160/90 mmHg); hypertriglyceridemia (triglycerides > 400 mg/dl); insulin-dependent diabetes; active cancer; liver, renal or hematological disease; or other medical disorders were excluded. Women on the low protein diet (n = 15) were a subset of women enrolled in the diet-only group of an on-going clinical trial designed to examine the metabolic effects of a hypocaloric diet with or without exercise. Twelve additional women were recruited as a comparison group to examine the effects of a higher protein hypocaloric diet on body composition.
Study design
Baseline measurements of body composition and body fat distribution were performed after at least two weeks of weight stability and at least two weeks prior to the beginning of the intervention. The participants were asked not to alter their sedentary lifestyle during the study. After the 20-week intervention, the women were retested in the same manner as at baseline.
Study interventions
Individual diets were developed for each participant to elicit an approximate 400 kcal/d energy deficit. Individual energy needs were calculated from each woman’s measured resting metabolic rate (RMR) using a MedGraphics CCM/D cart and Breeze 6.2 software for indirect calorimetry following an overnight fast and an activity factor based on self-reported daily activity (1.2 to 1.4). During the 20-week intervention, all women were provided daily lunch, dinner, and snack meals from the Wake Forest University Health Sciences General Clinical Research Center (GCRC) metabolic kitchen. These meals were prepared based on each woman’s choices from a menu designed by a registered dietitian (RD). Participants prepared their own breakfast daily from a menu also developed by the RD. All women were allowed to consume as many non-caloric beverages as they liked as well as controlled amounts of very low calorie foods such as condiments and raw vegetables. They were also allowed two free days per month during which they were given guidelines for diet intake not provided by the study and asked to report all food/beverage intake on these days. To insure adequate intake of calcium and vitamin D, a supplement providing 1000 mg calcium and 200 IU Vitamin D daily was provided to all women. Adequacy of other nutrients was dependent on participants’ daily menu choices, and use of other vitamin/mineral supplements was permitted.
The macronutrient content of the lower protein study was designed to include approximately 25-30% fat, 15-20% protein, and 50-60% carbohydrate. Because of the hypocaloric nature of the diet, this macronutrient breakdown resulted in an absolute protein intake of 0.5-0.7 g/kg/d. The higher protein diet was designed to provide 30% of energy as protein (1.2-1.5 g/kg/d). All women picked up their food three times weekly and were asked to keep a log of everything they ate or drank. The records were monitored weekly by the dietitian to verify compliance to the diet. The average daily calorie intake recorded by women in the LO PROT group was 99.4% ± 0.3% of the prescribed calorie level and 99.7% ± 0.7% in the HI PROT group.
In addition to the meals described above, each woman in the HI PROT group was provided with a daily protein supplement and recipe options for preparing the supplement. The supplement (Syntrax®, S103, Inc.), a well-accepted, artificially sweetened whey protein isolate powder that mixes easily into liquids, provides 90 calories as 23 g protein per 27 g serving. It was selected for its palatability, ease of use, and absence of other calorie sources. This additional daily beverage was the only significant difference in eating pattern between the two groups, with the remaining increase in protein being distributed across the meals for the HI PROT group. A sample of a day’s menu for each of the two groups is shown in Table 1.
Table 1.
Sample 1300-calorie intervention daily menu for both groups
| LO PROT | HI PROT | |
|---|---|---|
| Breakfast | ¾ c. whole grain oat cereal ¾ c. skim milk 1 small banana Black coffee |
¾ c. whole grain oat cereal ½ c. skim milk 1 medium soft-boiled egg Black coffee |
| Lunch | 50 g roast beef on 2 slices whole wheat bread with 28 g low-fat mayonnaise 95 g low-fat potato salad 113 g juice-packed pineapple Diet soda |
50 g roast beef on 2 slices whole wheat bread 95 g low-fat potato salad 113 g juice-packed pineapple Diet soda |
| Supper | 95 g roast turkey breast 100 g prepared stuffing 75 g glazed carrots 30 g cranberry sauce 55 g fat-free chocolate pudding Unsweetened tea |
145 g roast turkey breast 70 g prepared stuffing 100 g steamed carrots 40 g cranberry sauce 55 g fat-free chocolate pudding Unsweetened tea |
| Snack | 4 saltine crackers with 18 g reduced-fat peanut butter 1 c. carrot, celery, and bell pepper strips |
32 g protein powder in 8 fl.oz. orange juice 1 c. carrot, celery, and bell pepper strips |
Body Composition
Height and weight were measured with shoes and jackets or outer garments removed. Percent body fat, lean body mass and total body mass were measured by dual energy x-ray absorptiometry (DXA, Hologic Delphi QDR; Bedford, MA, software Version 11.2). Appendicular lean mass, lean mass in the arms and legs, was calculated as the sum of non-bone lean mass in arms and legs.
Statistics
Statistical analyses were performed using SAS software, version 9.1 (SAS Institute, Cary, NC). Descriptive statistics were calculated and values are reported as means ± SDs or frequencies. The two-sample t-test was used to calculate the differences between the LO PROT and the HI PROT groups. An alpha level of 0.05 was used as the nominal type I error rate. Analysis of covariance was used to evaluate the effect of group on loss of lean mass adjusting for changes in total fat mass. Because the two groups differed with respect to some baseline characteristics we used analysis of covariance to identify other significant predictors of lean mass change for inclusion in a model. Due to the small sample size we used a forward selection strategy to identify potentially important variables based on their ability to predict changes in total lean mass. The p-value for retention in the model was 0.10. The variables evaluated were: baseline lean mass, baseline resting metabolic rate, baseline total mass, goal daily energy intake and age. None met the entry criterion.
Results
Subject characteristics
Twenty-four (LO PROT: n = 15, HI PROT: n = 9) of the initial 27 women completed the interventions. Three women withdrew from the study for the following reasons: 1) moved out of town, 2) long term treatment of mental health issues 3) no longer wanted to be on the diet because of its restrictions.
Table 2 shows the baseline characteristics of the women by diet group. The mean age, racial mixture, BMI, and percent body fat was similar between the HI PROT and LO PROT groups, but women in the HI PROT group had, on average, a lower total body mass and total amount of lean mass than the LO PROT group. Resting metabolic rate was higher in the HI PROT compared to the LO PROT group at baseline.
Table 2.
Baseline Characteristics: Means (SD) or Percent
| Characteristic | HI PROT (n = 9) |
LO PROT (n = 15) |
|---|---|---|
| Age (yrs) | 57.1 (6.1) | 58.7 (6.8) |
| African American (%) | 33.3 | 40.0 |
| Body Mass Index (kg/m2) | 31.7 (2.9) | 33.8 (3.9) |
| Total Body Mass (kg) | 85.5 (9.3) | 93.5 (8.2)* |
| Total Lean Mass (kg) | 47.2 (4.1) | 51.4 (3.4)* |
| Total Fat Mass (kg) | 36.3 (5.9) | 39.8 (6.7) |
| Appendicular Lean Mass (kg) | 21.6 (1.9) | 22.8 (2.2) |
| Body Fat (%) | 42.2 (3.2) | 42.4 (4.1) |
| Resting Metabolic Rate (kcal/d) | 1435 (116) | 1303 (146)* |
p< 0.05
Dietary intake during study interventions
The average recorded total daily calorie and macronutrient intakes of the HI PROT and LO PROT groups are shown in Table 3. Because of the lower RMR of the LO PROT group, total caloric intake was less in this group. By design, the absolute and relative protein intakes of the HI PROT group were greater than the LO PROT group. The higher protein intake of the HI PROT group was off-set by a lower carbohydrate intake.
Table 3.
Nutrient Content of Actual Dietary Intake for Both Groups: Means (SD)
| Nutrient | HI PROT (n = 9) | LO PROT (n = 15) |
|---|---|---|
| Energy (kcal/d) | 1501 (122) | 1222 (152)** |
| Protein (g/d) | 111.0 (8.2) | 54.0 (4.0) ** |
| Protein (g/kg/d) | 1.3 (0.2) | 0.6 (0.1)** |
| Protein (% of energy) | 29.7 (0.5) | 17.7 (0.9)** |
| Carbohydrate (g/d) | 167.9 (13.1) | 165.7 (21.2) |
| Carbohydrate (% of energy) | 44.8 (0.2) | 54.2 (0.8)** |
| Fat (g/d) | 42.7 (4.3) | 38.3 (6.0) |
| Fat (% of energy) | 25.6 (0.7) | 28.1 (1.2)* |
p< 0.01;
p< 0.0001
Effects of the study interventions on body composition
Figure 1 shows body composition changes in response to the 20-week intervention on a high protein or low protein hypocaloric diet. The absolute amount of total body mass lost was slightly, but not significantly, greater in the LO PROT group (p = 0.12). Based on the available sample size and observed pooled variance, the study had 80% power to detect a difference in total mass loss of 5.2 kg based on an alpha error rate of 0.05 using a two-tailed test. However, the relative amount of total body mass lost was similar between groups (HI PROT= 9.7% ± 4.7%; LO PROT = 10.5% ± 3.3%; p = NS). The amount of fat mass loss was similar between groups (p = 0.55).
Figure 1.
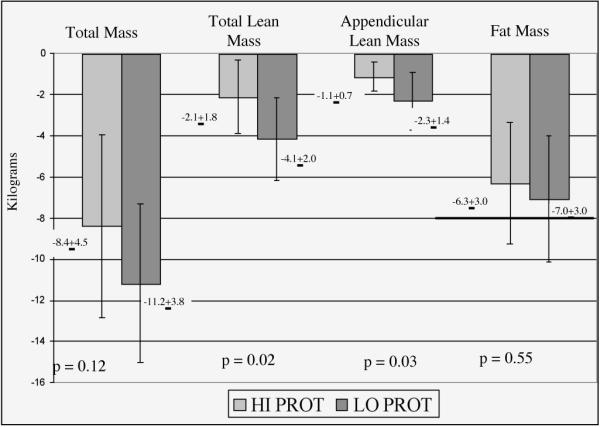
Body composition changes in response to the 20-week intervention on a high protein or low protein hypocaloric diet
The LO PROT group lost approximately twice the absolute amount of total lean mass and appendicular lean mass than the HI PROT group (4.1 ± 2.0 kg and 2.3 ± 1.4 kg vs. 2.1 ± 1.8 kg and 1.1 ± 0.7 kg, respectively, p< 0.05 for both). One participant in the LO PROT group lost over 9 kg of lean mass, an amount 2.5 standard deviations above the group mean’s average loss. Group differences remained statistically significant when this person was omitted from the analysis (p = 0.02 for both total lean and appendicular lean mass group differences). When the loss of lean mass was expressed as a percentage of total mass lost, the relative loss of lean mass in the group difference). the HI PROT group was substantially less than in the LO PROT group (17.3% ± 27.8% versus 37.7% ± 14.6%; p = 0.03).
Figure 2 shows the lean mass loss plotted against the fat mass loss for each participant. The figure shows that the higher protein diet was associated with retained lean mass across the range of fat loss. Women on the higher protein hypocaloric diet lost less total lean mass (p = 0.03), as well as less appendicular lean mass (p = 0.04), than women on the low protein hypocaloric diet, adjusting for the degree of fat mass loss based on a linear model. The least squares means for lean mass loss adjusted for fat mass loss were 2.2 ± 0.6 kg for the HI PROT group and 4.1 ± 0.5 kg for the LO PROT group (p = 0.03 for the group difference).
Figure 2.
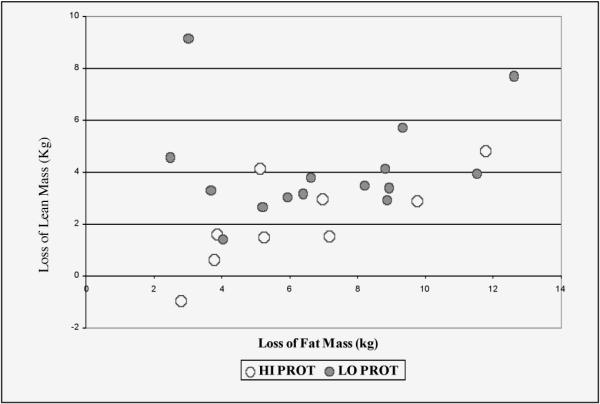
Lean mass loss plotted against fat mass loss for individual participants. Loss of lean (kg) = 0.74 + 0.22*loss of fat (kg) + 1.8 kg if in Low Protein group. Overall F(2,21) = 4.41, p = 0.015; R2 = 0.32. P-value for group effect = 0.03
Discussion
Hypocaloric dieting for the treatment of obesity is often not advocated in older persons, in part, because it causes loss of lean body mass in addition to fat mass. The loss of lean body mass in older adults is of concern, as it is associated with decreased function, impaired quality of life, and increased mortality (13, 14). Therefore, the retention of lean body mass during voluntary weight loss is an important intervention goal in older adults. The results of the current study show that the amount of dietary protein intake is an important modifiable factor modulating the degree of lean body mass during voluntary weight loss.
This study investigated whether post-menopausal women consuming a higher protein (1.2–1.5 g/kg/d) hypocaloric diet would lose less lean body mass than women consuming a lower protein (< 0.8 g/kg/d) hypocaloric diet. The diet consumed by the high protein group was not a “fad diet.” The distribution of intake across macronutrients is consistent with current dietary recommendations. However, providing adequate protein in hypocaloric diets fixing protein to 15-20% of calories becomes increasingly difficult as the number of calories prescribed decreases. The ratio of protein to total calories will need to increase significantly in order to meet protein needs (0.8-1.2 g/kg/d) with lower caloric intake, and cannot always be met with food alone. In order to achieve the desired levels of protein in the context of a balanced, palatable hypocaloric diet in the HI PROT group, a protein supplement was employed. None of the study subjects consumed protein in the range of 0.8–1.2 g/kg/d, and it may be that the differences observed here are not linear across this range. While such diets may be more easily formulated without the need for supplements, this goal may still be difficult to achieve in obese sedentary older persons because of their low total energy needs and the difficulty in providing an adequate variety of low-calorie protein sources for long-term acceptability.
A significant proportion of older adults report the intention to lose weight (15). This group is at risk for insufficient protein intake especially if the caloric reduction is achieved by reducing overall portion sizes. Protein requirements are determined by body size and not caloric intake, and if protein intake is fixed as a percentage of energy intake, the total amount of protein intake may become insufficient as total energy drops. Our data suggest that the failure to maintain total protein intake during weight loss can lead to unnecessarily large changes in lean body mass, which from previous observational studies, can increase risk for mortality and disability (7, 8).
Previous studies have shown up to 50% of weight loss to be in the form of lean muscle mass (16). However, few of these studies have been done in older adults. Data from the Health ABC study, an observational study of older adults aged 70-79 showed that among women, the percentage of total mass lost as lean mass was 39% for those losing > 3% of their body weight over 4 years (17). Our data in the lower protein group are consistent with these findings, showing a relative lean mass loss of 37%.
Although the higher protein diet was unable to prevent the loss of lean mass, it was successful in attenuating the loss of lean body mass in this group. On average, the lower protein group lost twice as much total lean mass despite a similar degree of fat loss. There are few studies with which to directly compare the current results. The few available studies with long term follow up did not examine the effect of manipulating protein on the partitioning of body mass loss in older populations (18). Furthermore, studies are heterogeneous with respect to dietary protein levels selected, degree of calorie restriction and duration. Layman et al. (19) compared two hypocaloric diets containing either 1.5 g/kg/d or 0.8 g/kg/d as protein in a 10-week intervention study of 40-56 year old women. They found that the two groups achieved a similar degree of fat loss but that the higher protein group retained significantly more lean body mass and that the ratio of fat: lean loss was twice as high in the lower protein group. In a 12-week study of women (ages 20-65 years), Noakes et al. (20) found that women consuming a hypocaloric diet containing approximately 0.64 g/kg/d of protein lost ~31% of their total body mass as lean mass compared to ~21% in women consuming a diet with approximately 0.88 g/kg/d. A recent meta-analysis by Krieger et al. (18) has summarized the findings of 87 studies examining the effects protein and carbohydrate intake on body mass and body composition in weight loss studies. This analysis showed that protein intake was a significant predictor of fat free mass retention. In studies lasting greater than 12 weeks, a protein intake above 1.05 g/kg/d was associated with 1.21 kg greater retention in fat free mass (p = 0.005) compared to studies below this intake level.
Our study has several strengths including high compliance with a diet largely provided by the GCRC metabolic kitchen, good participant retention, and long term follow-up. The lack of random assignment is a limitation of the study, though women in the two groups were recruited using similar entry and exclusion criteria, and our evaluation identifies important covariates among variables imbalanced between the groups at baseline. Thus, while the data support the idea that modulating dietary protein in hypocaloric diets may be a useful strategy for addressing the problem of obesity in older adults, the effect needs to be pursued in larger randomized studies. Additional work is needed to determine whether the amount of dietary protein required to maximize lean mass retention is linear across the range of diets that would be sustainable for long-term interventions.
Acknowledgements
We are grateful to the study coordinators, dietary staff, and clinical personnel of the Section of Gerontology and Geriatric Medicine, and the General Clinical Research Center at Wake Forest University School of Medicine for their assistance in the conduct of this study. We also thank all women who voluntarily participated in this study. This study was supported by NIH Grant R01-AG/DK20583, Wake Forest University Claude D. Pepper Older Americans Independence Center (P30-AG21332), and Wake Forest University General Clinical Research Center (M01-RR07122).
Footnotes
Financial disclosure: none of the authors had any financial interest or support for this paper.
References
- 1.Ogden CL, Carroll MD, Curtin LR, McDowell MA, Tabak CJ, Flegal KM. Prevalence of overweight and obesity in the United States, 1999-2004. JAMA. 2006;295:1549–55. doi: 10.1001/jama.295.13.1549. [DOI] [PubMed] [Google Scholar]
- 2.Livingston EH, Ko CY. Use of the health and activities limitation index as a measure of quality of life in obesity. Obes Res. 2002;10:824–32. doi: 10.1038/oby.2002.111. [DOI] [PubMed] [Google Scholar]
- 3.Harris TB, Launer LJ, Madans J, Feldman JJ. Cohort study of effect of being overweight and change in weight on risk of coronary heart disease in old age. BMJ. 1997;314:1791–4. doi: 10.1136/bmj.314.7097.1791. [DOI] [PMC free article] [PubMed] [Google Scholar]
- 4.Sahyoun NR, Hochberg MC, Helmick CG, Harris T, Pamuk ER. Body mass index, weight change, and incidence of self-reported physician-diagnosed arthritis among women. Am J Public Health. 1999;89:391–4. doi: 10.2105/ajph.89.3.391. [DOI] [PMC free article] [PubMed] [Google Scholar]
- 5.Gallagher S. Bariatrics: considering mobility, patient safety and caregiver injury. CRC Press; New York: 2004. [Google Scholar]
- 6.Janssen I, Ross R. Linking age-related changes in skeletal muscle mass and composition with metabolism and disease. J Nutr Health Aging. 2005 Nov-Dec;9(6):408–19. [PubMed] [Google Scholar]
- 7.Newman AB, Lee JS, Visser M, et al. Weight change and the conservation of lean mass in old age: the Health, Aging and Body Composition Study. Am J Clin Nutr. 2005;82:872–8. doi: 10.1093/ajcn/82.4.872. [DOI] [PubMed] [Google Scholar]
- 8.Forbes GB. Body fat content influences the body composition response to nutrition and exercise. Ann N Y Acad Sci. 2000;904:359–65. doi: 10.1111/j.1749-6632.2000.tb06482.x. [DOI] [PubMed] [Google Scholar]
- 9.Volek JS, Sharman MJ, Love DM, et al. Body composition and hormonal responses to a carbohydrate-restricted diet. Metabolism. 2002;51:864–70. doi: 10.1053/meta.2002.32037. [DOI] [PubMed] [Google Scholar]
- 10.Meckling KA, Gauthier M, Grubb R, Sanford J. Effects of a hypocaloric, low-carbohydrate diet on weight loss, blood lipids, blood pressure, glucose tolerance, and body composition in free-living overweight women. Can J Physiol Pharmacol. 2002;80:1095–105. doi: 10.1139/y02-140. [DOI] [PubMed] [Google Scholar]
- 11.Young CM, Scanlan SS, Im HS, Lutwak L. Effect of body composition and other parameters in obese young men of carbohydrate level of reduction diet. Am J Clin Nutr. 1971;24:290–6. doi: 10.1093/ajcn/24.3.290. [DOI] [PubMed] [Google Scholar]
- 12.Layman DK, Evans E, Baum JI, Seyler J, Erickson DJ, Boileau RA. Dietary protein and exercise have additive effects on body composition during weight loss in adult women. J Nutr. 2005;135:1903–10. doi: 10.1093/jn/135.8.1903. [DOI] [PubMed] [Google Scholar]
- 13.Roubenoff R. Sarcopenia: effects on body composition and function. J Gerontol A Biol Sci Med Sci. 2003;58:1012–7. doi: 10.1093/gerona/58.11.m1012. [DOI] [PubMed] [Google Scholar]
- 14.Baumgartner RN, Waters DL, Gallagher D, Morley JE, Gary PJ. Predictors of skeletal muscle mass in elderly men and women. Mec Ageing Dev. 1999;107:123–36. doi: 10.1016/s0047-6374(98)00130-4. [DOI] [PubMed] [Google Scholar]
- 15.Lee JS, Kritchevsky SB, Tylavsky F, Harris T, Simonsick EM, Rubin SM, Newman AB, Health ABC Study Weight change, weight change intention, and the incidence of mobility limitation in well-functioning community-dwelling older adults. J Gerontol A Biol Sci Med Sci. 2005 Aug;60(8) doi: 10.1093/gerona/60.8.1007. [DOI] [PubMed] [Google Scholar]
- 16.Ballor DL, Poehlman ET. Exercise training enhances fat-free mass preservation during diet-induced weight loss: a meta-analytical finding. Int J Obes Relat Metab Disord. 1994;18:35–40. [PubMed] [Google Scholar]
- 17.Newman AB, Lee JS, Visser M, Goodpaster BH, Kritchevsky SB, Tylavsky FA, Nevitt M, Harris TB. Weight change and the conservation of lean mass in old age: the Health, Aging and Body Composition Study. Am J Clin Nutr. 2005 Oct;82(4):872–8. doi: 10.1093/ajcn/82.4.872. [DOI] [PubMed] [Google Scholar]
- 18.Krieger JW, Sitren HS, Daniels MJ, Langkamp-Henken Bl. Effects of variation in protein and carbohydrate intake on body mass and composition during energy restriction: a meta-regression 1. Am J Clin Nutr. 2006 Feb;83(2):260–74. doi: 10.1093/ajcn/83.2.260. [DOI] [PubMed] [Google Scholar]
- 19.Layman DK, Boileau RA, Erickson DJ, Painter JE, Shiue H, Sather C, Christou DD. A reduced ratio of dietary carbohydrate to protein improves body composition and blood lipid profiles during weight loss in adult women. J Nutr. 2003 Feb;133(2):411–7. doi: 10.1093/jn/133.2.411. [DOI] [PubMed] [Google Scholar]
- 20.Noakes M, Keogh JB, Foster PR, Clifton PM. Effect of an energy-restricted, high-protein, low-fat diet relative to a conventional high-carbohydrate, low-fat diet on weight loss, body composition, nutritional status, and markers of cardiovascular health in obese women. Am J Clin Nutr. 2005 Jun;81(6) doi: 10.1093/ajcn/81.6.1298. [DOI] [PubMed] [Google Scholar]