Abstract
This work describes the synthesis of few-layer graphene sheets embedded with various amounts of gold nanoparticles (Gr-Au-x) over an Aux/MgO catalytic system (where × = 1, 2, or 3 wt%). The sheet-like morphology of the Gr-Au-x nanostructures was confirmed by transmission electron microscopy and high resolution transmission electron microscopy, which also demonstrated that the number of layers within the sheets varied from two to seven. The sample with the highest percentage of gold nanoparticles embedded within the graphitic layers (Gr-Au-3) showed the highest degree of crystallinity. This distinct feature, along with the large number of edge-planes seen in high resolution transmission electron microscopic images, has a crucial effect on the electrocatalytic properties of this material. The reaction yields (40%–50%) and the final purity (96%–98%) of the Gr-Au-x composites were obtained by thermogravimetric analysis. The Gr-Au-x composites were used to modify platinum substrates and subsequently to detect adenine, one of the DNA bases. For the bare electrode, no oxidation signal was recorded. In contrast, all of the modified electrodes showed a strong electrocatalytic effect, and a clear peak for adenine oxidation was recorded at approximately +1.05 V. The highest increase in the electrochemical signal was obtained using a platinum/Gr-Au-3-modified electrode. In addition, this modified electrode had an exchange current density (I0, obtained from the Tafel plot) one order of magnitude higher than that of the bare platinum electrode, which also confirmed that the transfer of electrons took place more readily at the Gr-Au-3-modified electrode.
Keywords: graphene, gold nanoparticles, chemical vapor deposition, oxidation of adenine
Introduction
Graphene-based electrochemical sensors have recently received a great deal of attention due to their excellent analytical performance in the detection of organic molecules.1–3 As a result of its large surface area and the high mobility of its charge carriers (200,000 cm2/V/sec),4 graphene enhances the electron transfer process. In addition, its two-dimensional structure is an extremely attractive support for the attachment of metal nanoparticles.5–7 Such composite material has shown great versatility for the fabrication of electrochemical sensors and biosensors. Lightcap et al8 reported the use of reduced graphene oxide as a two-dimensional substrate for the selective attachment of a semiconductor (TiO2) as well as metal (silver) nanoparticles. The electrons generated after ultraviolet irradiation of the semiconducting nanoparticles were proposed to be transported across reduced graphene oxide and the metal nanoparticles, at a position different from that of the TiO2 attachment sites. This finding highlighted the ability of reduced graphene oxide to serve as a catalytic material and transfer electrons to the desired ionic species.
Song et al9 have previously described the efficient electrodeposition of cobalt nanoparticles (with a diameter varying from 10 nm to 30 nm) onto the surface of a graphene-modified glassy carbon electrode. Atomic force microscopy studies indicated that the cobalt nanoparticles were relatively uniformly dispersed over the graphene/glassy carbon electrode surfaces. The authors studied the complex electrochemical behavior as well as the electrocatalytic performance of the cobalt nanoparticle/graphene-modified electrodes towards the oxidation of two amino acids, ie, cysteine and N-acetyl cysteine. The results indicated the excellent electrocatalytic activity and high sensitivity of these nanostructural systems, indicating that such a cobalt nanoparticle/graphene/glassy carbon electrode composite could act as a promising electrode for the construction of a sensitive nonenzymatic sensor.
More recently, Fan et al10 have reported modification of a glassy carbon electrode with a film composed of Nafion® (DuPont, Boston, MA) and a TiO2-graphene nanocomposite. Its voltammetric response towards the amino acids L-tryptophan and L-tyrosine was also presented. Interestingly, the presence of TiO2 nanoparticles was shown to improve the electrocatalytic activity and voltammetric response significantly when compared with electrodes modified with Nafion/graphene only. The electrode modified by Nafion/TiO2-graphene was used further to detect the two amino acids, with a reported detection limit of 0.7 μM and 2.3 μM and sensitivity of 75.9 μA/mM and 22.8 μA/mM for L-tryptophan and L-tyrosine, respectively.
Detection of biological systems down to the level of a single molecule is one of the most sought after technological developments. The scientific community is currently devoted to achieving this goal in a reliable and controllable manner. Such capability would make it possible to detect complex biological systems, including viruses, bacteria, and various types of markers for complex diseases, with an extremely positive impact on the detection, control, and treatment of various medical conditions. In our current studies, adenine is used as a model biological system. A number of technological approaches have been proposed for detection of adenine, including electrochemical,11 surface-enhanced Raman scattering,12 and molecular approaches.13
This work, which is a continuation of our earlier study,6 demonstrates for the first time, to our best knowledge, that the electrocatalytic properties of a graphene-modified platinum electrode are strongly influenced by the amount of gold nanoparticles embedded within the graphene sheets. For this study, graphene structures containing various amounts of gold nanoparticles, denoted as Gr-Au-x (where × = 1, 2, or 3) were prepared using the radiofrequency catalytic chemical vapor deposition method and then used to modify the platinum electrodes currently employed in an electrochemical cell. The gold nanoparticles were found to be encased between the graphitic sheets and to have spherical shapes, with sizes ranging from 10 nm to 25 nm. We used this modified electrode for accurate detection of adenine (C5H5N5) which, along with guanine, is a purine nucleobase forming the nucleic acids.14 Moreover, the electrochemical behavior of these multicomponent graphene-gold nanoparticle materials was found to be highly dependent on the crystallinity of the sample and the amount of gold embedded within the graphitic layers. This analysis allows new physical insight into the complex nature of the electron transfer processes occurring within the adenine oxidation system.
Materials and methods
Preparation of Aux/MgO catalysts and Gr-Au-x nanocomposites
Three samples of Au/MgO catalyst, calculated as Au 1 wt%, Au 2 wt%, and Au 3 wt% (denoted as Aux/MgO, where × = 1, 2, and 3 wt%, respectively) in the final catalyst, were prepared by deposition-precipitation with urea.15 An appropriate amount of aqueous HAuCl4 solution was added to a mixture containing 100 mL of distilled water, 3 g of MgO, and 5 g of urea. The solution was stirred continuously at 80°C overnight, followed by filtration and washing with distilled water until no chlorine was detected (ie, the AgNO3 test). The sample was finally dried at room temperature for 24 hours and then in an oven at 100°C for 3 hours. The catalyst precursor was then calcined in air at 250°C for 4 hours. Magnesia support was prepared by precipitation of Mg(NO3) × 6H2O with a 1 M solution of Na2CO3, followed by washing with distilled water and calcining in air at 650°C for 2 hours.
Graphene structures with various amounts of gold nanoparticles embedded (denoted as Gr-Au-x, where × = 1, 2, or 3, corresponding to each catalyst used) were prepared using the radiofrequency catalytic chemical vapor deposition method, as previously described.16 To summarize, about 50 mg of Aux/MgO catalyst was uniformly distributed on the flat bottom of a graphite crucible and then introduced into the middle of a quartz reactor (3 cm inner diameter and 50 cm long). Subsequently, the reactor was placed in the middle of a water-cooled copper coil connected to a high-frequency generator (1.2 MHz, 5 kW) for heating of the graphite crucible.6 After sealing the reactor, argon gas was allowed to flow (300 mL per minute) for 10 minutes, and the sample was then heated at 500°C for 5 minutes. Next, the reactor temperature was increased to 1000°C (synthesis temperature), and methane gas was allowed to flow for 60 minutes (flow rate 80 mL per minute). Throughout the synthesis period, the temperature was monitored with an infrared thermometer (Impac IGA 8 Pro®, LumaSense Technologies Inc, Santa Clara, CA, USA). At the end of each synthesis, the methane flow and radiofrequency generator were turned off, and the reactor was allowed to cool in argon gas.
Purification of the reaction product and removal of MgO was performed by sonication in HCl (1:1) for 30 minutes at room temperature, washing with deionized water to neutral pH, and drying at 120°C overnight. After the Gr-Au-x nanocomposites were prepared, their morphological and structural properties were characterized; the nanocomposites were then used to modify a platinum substrate for electrochemical analysis of adenine.
Structural characterization of Gr-Au-x nanocomposites
The morphological and structural characteristics of the Gr-Au-x nanocomposites were investigated by scanning and transmission electron microscopy (JSM7000F and JEM2100F, respectively, JEOL, USA, Peabody, MA, USA), Raman spectroscopy, thermogravimetric analysis, x-ray powder diffraction, and ultraviolet visible spectroscopy.
Raman analysis was performed at room temperature using a spectrophotometer (NRS 3300, Jasco, Easton, MD, USA) arranged in a back-scattering geometry and equipped with a charge-coupled device detector (−69°C) which uses a 600 l/mm grid allowing a spectral resolution of 1.45 cm−1. The laser incident beam (approximate size 1 μm2) was focused on the sample surface through an Olympus microscope with a 100× objective. The instrument was calibrated based on the Si 521 cm−1 peak. Laser excitation was conducted using a 514 nm argon ion laser, and the power at the surface of the sample was maintained at 1.5 mW.
Thermogravimetric analysis was performed using a SDT Q600 instrument (TA Instruments, New Castle, DE, USA) in an airflow of 100 mL per minute and a temperature range of 25°C–800°C, with a heating rate of 5°C per minute.
X-ray diffraction data were collected in the 2θ = 5°–85° angular domain using a D8 Advance diffractometer (Bruker, Billerica, MA, USA) and Cu Kα1 radiation (λ = 1.5406 Å). In order to increase the resolution, a Ge (111) monochromator in the incident beam was used to eliminate Kα2 radiation.
An ultraviolet-visible spectrophotometer (V-570, Jasco) was used to investigate the optical properties of adenine (10−5 M in 0.2 M phosphate-buffered solution, pH 6) and the Gr-Au-x suspensions (0.03 mg/mL in 0.2 M phosphate-buffered solution, pH 6), as well as their interaction after mixing the two solutions.
Platinum electrode modified with Gr-Au-x nanocomposites
Before modification with the Gr-Au-x nanocomposite, the platinum electrode was electrochemically cleaned in 0.5 M H2SO4 solution by cyclic voltammetry (50 cycles from −0.25 to +1.6 V versus Ag/AgCl, at a scan rate of 50 mV per second). The electrode was next thoroughly cleaned ultrasonically in both ethanol and deionized water several times for 3 minutes each. Next, 20 μL of colloidal Gr-Au-x suspension in dimethylformamide 0.5 mg/mL was deposited onto the platinum substrate and dried at room temperature for about one hour.
Linear sweep voltammetry analysis was conducted using an Autolab 302N potentiostat/galvanostat (Eco Chemie, Utrecht, The Netherlands) connected to a three-electrode cell and controlled by Nova 1.8 software. The surface area of the working electrode was 0.07 cm2; as a counter, we used a platinum electrode with a larger area (approximately 2 cm2). The reference was an Ag/AgCl electrode. Linear sweep voltammetry measurements were typically recorded between +0.2 V and +1.35 V versus Ag/AgCl at a scan rate of 50 mV per second. Tafel plots were analyzed from cyclic voltammograms recorded at 5 mV per second.
Reagents and solutions
All reagents used for the experiments were of analytical grade or better. Pure adenine sulfate dehydrate was purchased from Tokyo Chemical Industry Co, Ltd (Tokyo, Japan). A stock solution of 10−3 M adenine was prepared in 0.2 M phosphate-buffered solution (pH 6) and used subsequently to prepare solutions of lower concentrations (down to 10−6 M).
Results and discussion
Morphological and structural characterization of Gr-Au-x composites
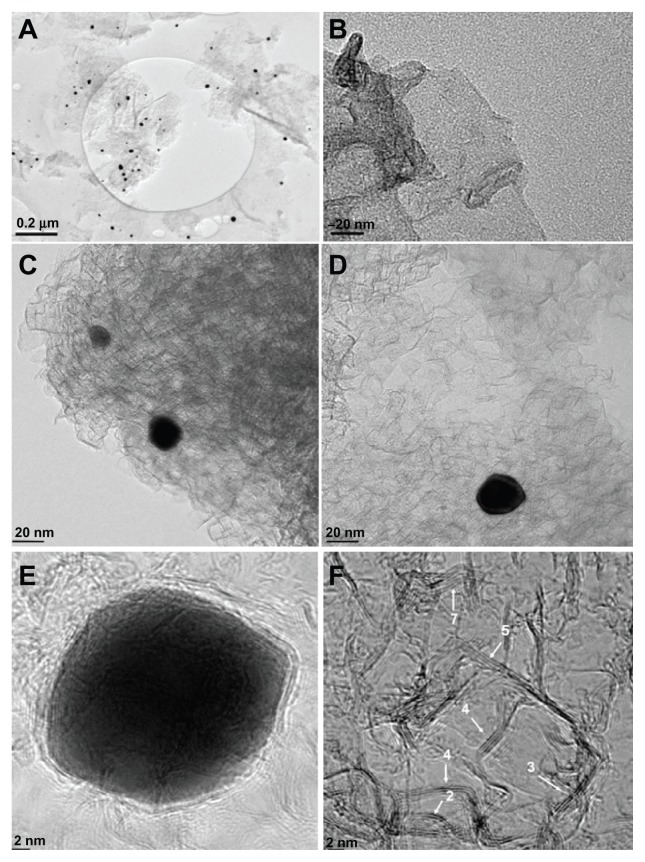
Figure 1 shows representative transmission electron microscopic images, at low magnification for the Gr-Au-3 sample (Figure 1A) and higher magnification for the Gr-Au-1 (Figure 1B), Gr-Au-2 (Figure 1C), and Gr-Au-3 samples (Figure 1D), as well as two high resolution transmission electron microscopic images for the Gr-Au-3 samples (Figure 1E and F). All images are characteristic of few-layer graphene structures with gold nanoparticles embedded (seen as black points in Figure 1A). The presence of the gold nanoparticles was confirmed by scanning transmission electron microscopic analysis (data not shown).6 The irregularly shaped graphitic layers with dimensions on the order of hundreds of nanometers and many wrinkles are in good agreement with previous reports.17,18
Figure 1.
Representative transmission electron microscopic images of graphene structures obtained at low magnification for Gr-Au-3 (A) and high magnification for Gr-Au-1 (B), Gr-Au-2 (C), and Gr-Au-3 (D); and high resolution transmission electron microscopic images for Gr-Au-3 samples (E and F).
Note: Scale bar 2 nm.
The gold nanoparticles encased between the graphitic sheets had quasi-spherical shapes with some edges and with sizes ranging from 10 nm to 25 nm (in a sample of 50 particles, about 85% were 12–17 nm in size). A representative image of a particle with a diameter of about 25 nm is clearly shown in Figure 1E. The nanoparticle is surrounded by a few graphitic layers with the distance between layers being about 0.36 nm. A high resolution transmission electron microscopic image (Figure 1F) shows the edges of many graphitic sheets. (The edges and number of layers within the sheets are indicated in this image.) One can see that the number of layers varies from two to seven. By analyzing more high resolution transmission electron microscopic images, we estimated that about 80% of the graphene sheets were composed of 4–7 layers, with the distance between the layers varying from 0.33 nm to 0.36 nm. Rarely, graphitic sheets with a larger number of layers (8–9) were observed.
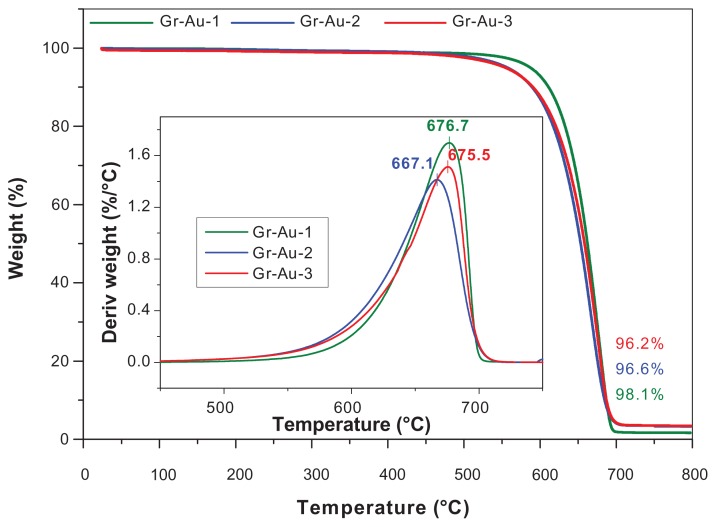
Next, thermogravimetric analysis was used to obtain information about the thermal stability of the Gr-Au-x nanocomposites and to determine whether amorphous carbon was present in our samples. Figure 2 shows the thermogravimetric analysis curves for the purified Gr-Au-x samples. The corresponding differential thermal analysis curves are shown in the inset, with the peak temperature indicating the thermal decomposition of carbonaceous structures.19,20 For our samples, these temperatures were within a range of 660°C–677°C, which corresponds to carbonaceous products with multilayers (eg, multi-walled carbon nanotubes).21
Figure 2.
Thermogravimetric curves corresponding to Gr-Au-1 (green line), Gr-Au-2 (blue line), Gr-Au-3 (red line), and differential thermal analysis for purified Gr-Au-x composites (inset).
It is important to mention that all curves exhibit a single mass-loss profile, as is characteristic of materials containing only one type of carbonaceous product. No mass loss was observed within the temperature range of 200°C–400°C, so the presence of amorphous carbon was not detected in our samples.22,23 The reaction yields (40%–50%) and the final purity (96%–98%) of the Gr-Au-x composites were obtained based on thermogravimetric analysis after sample purification.
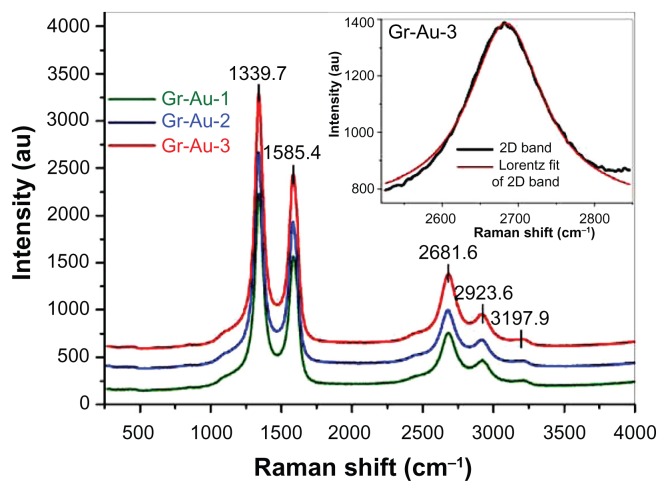
Figure 3 presents the Raman spectra for the Gr-Au-x samples, and the inset shows the deconvolution of the corresponding two-dimensional band into a Lorentzian curve for Gr-Au-3. The Raman spectra shown in Figure 3 indicate the presence of all the bands characteristic of graphene structures, having few layers and structural defects.18,24 Three strong bands are present at 1340–1350 cm−1 (D band), 1580–1590 cm−1 (G band), and at about 2684 cm−1 (a two-dimensional band). The G band is characteristic of all sp2-based materials,24 while the D band can be associated with the presence of structural defects. Its intensity is significantly influenced by the number of graphitic layers. The intensity ratio (IG/ID) may be associated with the number of defects present within the graphene sheets,24–26 as well as with the inplane crystallite size (La), where La (nm) = 560/E14 (IG/ID)27 (El is the laser energy, in eV). For our samples, the value of the integrated intensity ratio (IG/ID) is 0.67, which leads to La = 11 nm, regardless of the type of catalyst.27
Figure 3.
Raman spectra for Gr-Au-x composites (514 nm laser excitation); the inset represents the deconvolution of the corresponding two-dimensional band into a Lorentzian curve for the Gr-Au-3 sample.
The two-dimensional band is generally very sensitive to the number of graphitic layers that compose the graphene sheets when this number is smaller than four. For numbers higher than four, the two-dimensional band has a Lorentzian shape, with the width at half height of 85 cm−1 for graphene synthesized by arc discharge,28 90 cm−1 for samples grown by the chemical vapor deposition method,29 and about 100 cm−1 for multilayer graphene synthesized by the radiofrequency catalytic chemical vapor deposition method using gold/hydroxyapatite catalysts.5
As shown in Figure 3 (inset), the shape of the two-dimensional band is that of a single Lorentzian curve and has a width at half-height of 100 cm−1 (Gr-Au-3 sample). Therefore, this analysis correlates well with the transmission electron microscopic studies, which clearly indicate the presence of graphitic structures with 2–7 layers. The relatively high value of the width at half-height can be explained based on the presence of gold nanoparticles embedded within the graphitic structures. This can be further correlated with earlier studies demonstrating that the presence of gold, silver, or platinum nanoparticles over the graphene sheets is responsible for the widening of all of the graphene-characteristic Raman bands.30
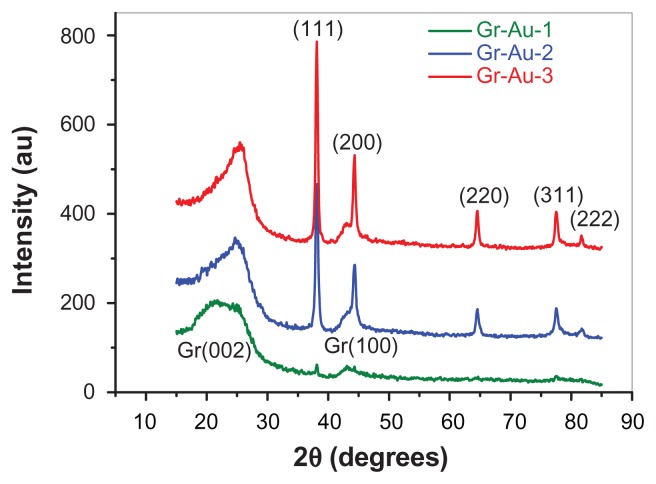
The x-ray diffraction technique was used to assess the crystallinity of graphene sheets with various amounts of gold nanoparticles embedded. The x-ray diffraction patterns for the Gr-Au-x nanocomposites show the diffraction lines of both graphene and gold (see Figure 4). The Gr(002) and Gr(100) diffraction lines are characteristic of graphene structures, as previously reported.31 The Gr(002) peak centered at 25 degrees can be correlated with the interlayer spacing (d-spacing) between the graphitic layers.31 Its position may vary from sample to sample depending on the number of layers comprising the graphene sheet.32 Using Bragg’s law, we estimated the value of the d-spacing as 0.349 nm for Gr-Au-3, 0.358 nm for Gr-Au-2, and 0.361 for Gr-Au-1. These values are in good agreement with those obtained from the analysis of edge-planes in the high resolution transmission electron microscopic images. The mean value of the crystalline domain, perpendicular to the Gr(002) crystallographic plane, was obtained using the Scherrer equation. This value is approximately 2.2 nm, which corresponds to about 5–6 graphitic layers (for the Gr-Au-3 sample). This is in excellent agreement with the shape of the two-dimensional band from the Raman spectra (Figure 3 inset).
Figure 4.
X-ray diffraction patterns of the Gr-Au-x nanocomposites showing several distinct diffraction peaks, both for graphene and gold.
It is important to emphasize that an increase in gold concentration leads to an increase in the degree of crystallinity for the Gr-Au-x samples. This is evidenced by the Gr(002) diffraction peak which became less broad with increasing gold concentration. Miller indices for the peaks corresponding to the gold phase are shown in Figure 4. The gold crystallite size was also determined using the Scherrer formula, and the corresponding values were as follows: 20 nm for Gr-Au-1, 21 nm for Gr-Au-2, and 23 nm for Gr-Au-3. Because the intensity of the Au(111) reflection peak depends on the amount of gold in the samples, we can conclude that the number of gold nanoparticles embedded within the graphitic layers increases in the following order: Gr-Au-1 < Gr-Au-2 < Gr-Au-3. This finding could result in significant electrochemical differences between the various samples, because of the increased amount of embedded gold nanoparticles.
Ultraviolet-visible analysis of interactions between adenine and Gr-Au-x nanocomposites
It is well known that the four bases of DNA (adenine, guanine, thymine, cytosine) are stacked within the double-helix structure and that the π-π stacking interaction leads to a significant decrease in the ultraviolet-visible absorption band (hypochromism) compared with a mixture of monomers (free bases).33 Gr-Au-x nanocomposites also have a large π conjugated system, which can interact with various aromatic molecules (in our case, adenine), mainly by π-π stacking interactions.
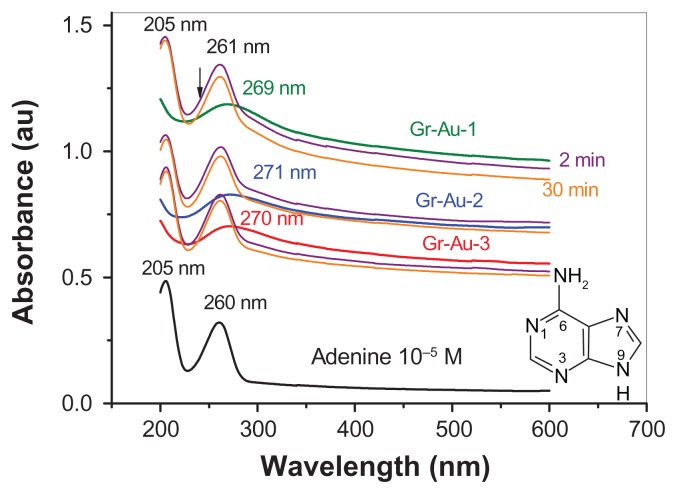
Figure 5 shows the ultraviolet-visible absorption spectra of adenine (black line) and the Gr-Au-x suspensions (green 1, blue 2, and red 3), as well as the spectra when mixed in 0.2 M phosphate-buffered solution (pH 6) recorded at various times (2 and 30 minutes, respectively). All of the Gr-Au-x suspensions showed a broad absorption band at around 270 nm, which confirms that, after the synthesis and purification steps, the reduced form of graphene was obtained. This is in good agreement with a previous study showing that the absorption peak of graphene oxide shifted from 230 nm to 270 nm after its chemical reduction with hydrazine.34 It is worth mentioning that the absorbance of Gr-Au-x nanocomposites decreases with increasing gold concentration in the following order: Gr-Au-1 < Gr-Au-2 < Gr-Au-3. This is also in excellent agreement with x-ray diffraction measurements and demonstrates the increasing amount of gold nanoparticles embedded within the graphitic sheets in these composites.
Figure 5.
Ultraviolet-visible absorption spectra of adenine (black line), Gr-Au-x nanocomposites (green, blue and red lines), as well as their mixed solutions in 0.2 M phosphate-buffered solution (pH 6) recorded at various times (purple 2 minutes; orange 30 minutes).
The absorption peak (around 270 nm) of Gr-Au-x suspensions is characteristic of the π-π* transition commonly seen in molecules with homogenous or heterogenous double bonds. Because gold nanoparticles are encased between graphitic sheets during the synthesis process, a plasmonic absorption band from 540 nm does not appear.34
The adenine spectrum showed two well-defined absorption bands at 205 nm and 260 nm. The band at 205 nm may be attributed to π-π* transitions, while the one at 260 nm may be due to n-π* transition, where n represents the unbound electrons from the heteroatom.
After mixing the Gr-Au-x suspensions with adenine (cyan and orange lines), strong hypochromism was observed, which can be attributed primarily to the π-π stacking force between the aromatic groups of the two compounds. This interaction may favor orientation of the adenine molecule in such a way that transfer of electrons from adenine to the Gr-Au-x surface can occur easily. The electrocatalytic effect of the Gr-Au-x nanocomposites was demonstrated using an electrochemical technique Linear Sweep Voltammetry (LCV).
Electrochemical oxidation of adenine
As was recently reported by Güell et al,35 multiple layers of stacked graphene have a larger proportion of edge-plane sites than single-layer graphene and consequently show improved heterogeneous electron transfer kinetics. They reported that single-layer graphene has the lowest electrochemical activity, but this increases systematically with the number of layers. (When the sheets have more than seven layers, the electron transfer process becomes nearly reversible.) Therefore, multilayer graphene exhibits superior performance in the electroanalysis of small biomolecules (eg, adenine).
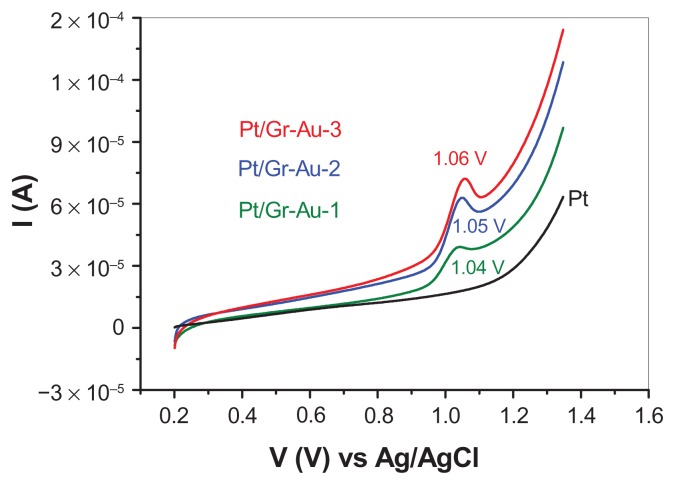
Figure 6 shows the LCVs obtained with a bare platinum electrode and with electrodes modified by the same amount of Gr-Au-x nanocomposite in 0.2 M phosphate-buffered solution (pH 6) containing 10−4 M adenine. It is interesting to note that no oxidation signal was recorded from the bare electrode. In contrast, all of the electrodes modified with Gr-Au-x nanocomposites showed a strong electrocatalytic effect, and a clear peak for adenine oxidation was recorded at approximately +1.05 V. The highest increase in the electrochemical signal was obtained with the electrode modified by Gr-Au-3. This behavior may be attributed to the structural and morphological characteristics of the Gr-Au-3 nanocomposite, which has a high crystalline structure in addition to many edge-planes.
Figure 6.
LCVs recorded with bare platinum and modified platinum electrode with Gr-Au-x nanocomposite: bare platinum (black line), platinum/Gr-Au-1 (green line), platinum/Gr-Au-2 (blue line), and platinum/Gr-Au-3 (red line).
Notes: In all cases, the electrolyte contained 10−4 M adenine in 0.2 M phosphate-buffered solution (pH 6). The scanning rate was 50 mV per second.
As is well known, an important parameter of an electrode material is its density of electronic states (DOS). Gold typically has a DOS of 0.28 states atom/eV, while highly ordered pyrolytic graphite has a DOS of around 0.0022 states atom/eV, which is about 0.8% that of gold.36 Generally, a material with a high DOS shows an increased heterogeneous electron transfer rate, due to the fact that there are more electrons available for transfer to electroactive species in solution. Recent studies have reported that the basal plane of pristine graphene has a DOS of 0 at the Fermi level, but this increases with edge-plane defects.37 Thus, pristine graphene with no defects shows a poor electrochemical signal, while graphene with a high degree of defects exhibits a considerably increased electrochemical rate constant.
In the case of our composite materials, we cannot say that gold nanoparticles are actively involved in the redox process, given that they are generally covered by several graphene layers (2–7 layers, see Figure 1F). However, we observed a high density of edge-planes surrounding the gold nanoparticles (Figure 1E). Given that edge-planes can be associated with defects in a graphene network (as well as with high DOS), we suggest that the presence of nanoparticles is highly beneficial for increasing the electrochemical rate constant. This is also in excellent agreement with the work of Gonçalves et al38 and Li et al,39 who studied the oxidation of adenine on a number of electrode surfaces, ie, gold, platinum, boron-doped diamond, basal-plane pyrolytic graphite, and edge-plane pyrolytic graphite. On carbon-based electrodes, the oxidation of adenine molecules was far better resolved, with the edge-plane pyrolytic graphite electrode having the highest peak current. They suggested that the edge-plane sites are the dominant electroactive sites for the oxidation of adenine, as is the case for guanine.
It is also important to emphasize that, because of their hydrophobic and π-conjugation system, graphene sheets are adsorbed onto the platinum electrode as isolated islands rather than as a uniform monolayer, which significantly increases the specific area of the electrode. Consequently, this also leads to an increase in the electrochemical signal.
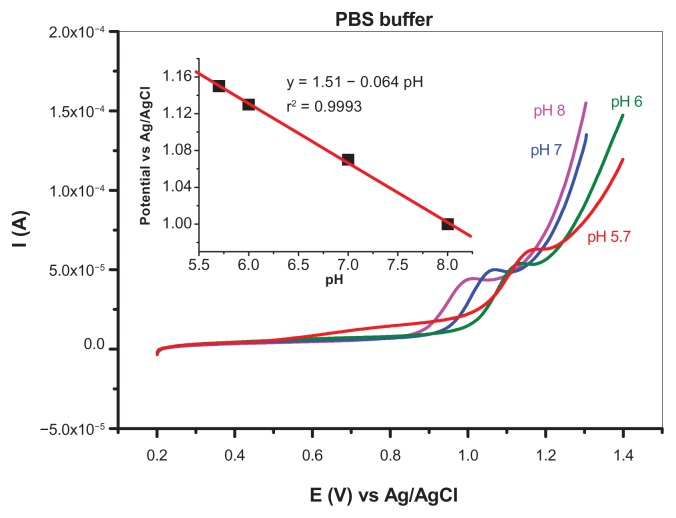
Due to the excellent electrocatalytic properties of the Gr-Au-3 nanocomposite, an electrode modified with this material was used further to study the electrochemical oxidation of adenine. The variation in adenine peak potential with pH was investigated in phosphate-buffered solutions (pH 5.7–8.0) containing 10−4 M adenine, as shown in Figure 7. We can see that the peak potential varies linearly with pH, having a slope of 64 mV/pH, which is very close to the characteristic results for a system in which the number of protons transferred is equal to the number of electrons (59 mV/pH at 25°C). According to Compton et al, the shift in peak potential is related to the change in standard potential for the rate-determining step, as given by the Nernst equation.38
Figure 7.
pH dependence of adenine voltammetric peak. LCVs were recorded in 10−4 M adenine in 0.2 M phosphate-buffered solution (from pH 5.7 to 8) with a scan rate of 50 mV per second; the inset shows the linear variation of peak potential with pH (slope of 64 mV/pH).
Abbreviation: PBS, phosphate-buffered solution.
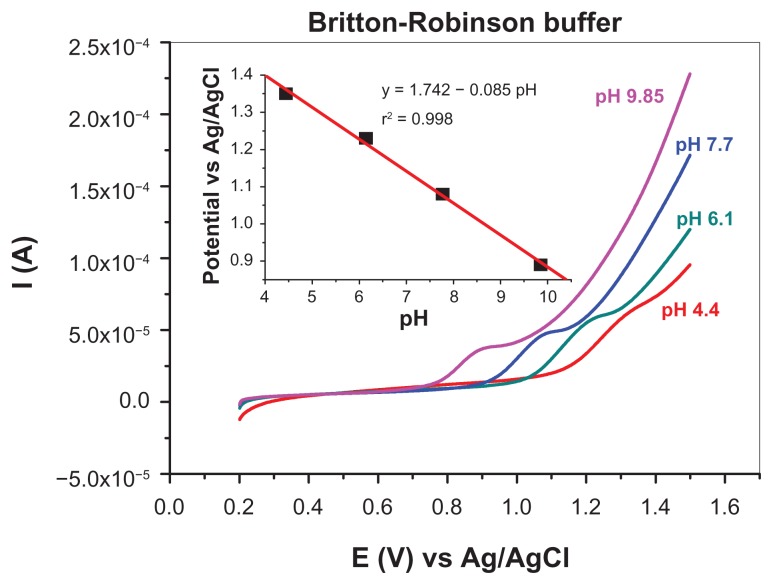
If the pH range is extended from 4 to 10 (Figure 8), the peak potential also shows linear variation with pH, but, in this case, the slope is considerably larger (85 mV/pH, see the inset in Figure 8). This indicates that protonation/deprotonation of adenine (pKa of 4.2 and 9.8 at 25°C)40 may cause a change in the reaction mechanism.
Figure 8.
pH dependence of adenine voltammetric peak. LCVs were recorded in 10−4 M adenine in 0.04 M Britton-Robinson solutions (from pH 4.4 to 9.9) with a scan rate of 50 mV per second; the inset shows the linear variation of peak potential with the pH (slope of 85 mV/pH).
To gain insight into the origin of the enhanced electrochemical oxidation of adenine on the Gr-Au-3 modified electrode, the kinetics of interfacial charge transfer were considered. The magnitude of the current passing through the electrode/solution interface at any potential depends on the kinetics of electron transfer. The Butler-Volmer equation (equation 1) is the fundamental equation of electrode kinetics41 and shows the variation in current density (I) with the exchange current density (I0), the overpotential (η), and the transfer coefficients (α):
| (1) |
where n is the number of electrons transferred during the redox process, F is the Faraday constant (96485 C · mol−1), R is the gas constant (8.314 J · K−1 mol−1), and T is the temperature (K).
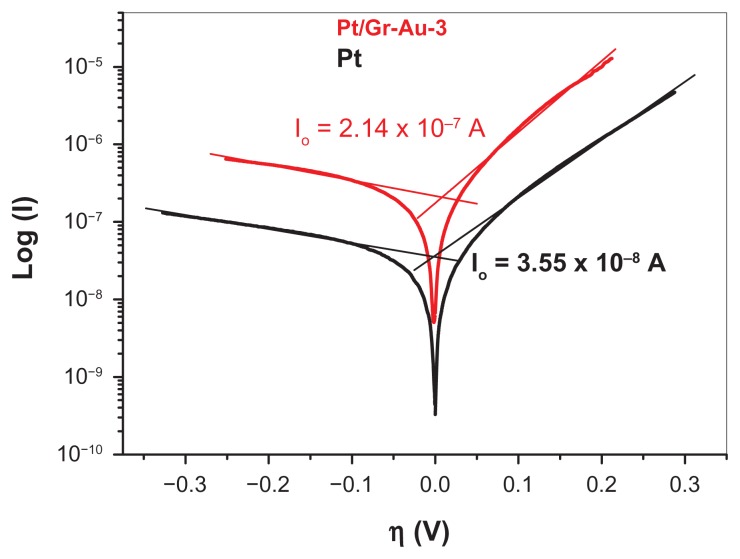
Two limiting forms of equation 1 (also known as Tafel equations), which apply at high positive or negative overpotentials, can be used to determine the exchange current density (equations 2 and 3):
| (2) |
| (3) |
where IC is the cathodic current and IA is the anodic current.
Figure 9 shows Tafel plots for a bare platinum electrode and for an electrode modified with the Gr-Au-3 nanocomposite. It is important to emphasize that, in the case of the modified electrode, the exchange current density (I0) is one order of magnitude higher than that of the bare platinum electrode. Given that I0 is related to the charge-transfer resistance at the electrode/solution interface (Rct = RT/nFI0),41 this confirms that the transfer of electrons takes place more easily at the Gr-Au-3 modified electrode.
Figure 9.
Tafel plots for the bare platinum electrode and the platinum electrode modified with the Gr-Au-3 nanocomposite.
Note: The electrolyte contained 10−3 M adenine in 0.2 M phosphate-buffered solution (pH 6).
Conclusion
In this work, we successfully prepared graphene sheets embedded with various amounts of gold nanoparticles (Gr-Au-x) using the radiofrequency catalytic chemical vapor deposition technique over a Aux/MgO catalyst (where × = 1%, 2%, or 3%). The composite nanostructures were characterized by transmission electron microscopy/high resolution transmission electron microscopy, as well as by Raman spectroscopy and thermogravimetric analysis. Thermogravimetric analysis data revealed the value of the reaction yields (40%–50%) and the final purity of Gr-Au-x composites (96%–98%). The excellent electrocatalytic properties of the Gr-Au-x composites were demonstrated by modifying platinum substrates with these materials and testing the electrochemical oxidation of adenine. LCV measurements revealed a significant increase in current intensity, in the following order: Pt/Gr-Au-1 < Pt/Gr-Au-2 < Pt/Gr-Au-3. No signal was obtained when a bare platinum electrode was used.
Acknowledgment
This work was supported by a grant from the Romanian National Authority for Scientific Research, CNCS-UEFISCDI (PN-II-ID-PCE-2011-3-0129). ASB acknowledges the financial support of the US Army Telemedicine and Advanced Technology Research Center program.
Footnotes
Disclosure
The authors report no conflicts of interest in this work.
References
- 1.Wang Y, Li Y, Tang L, Lu J, Li J. Application of graphene-modified electrode for selective detection of dopamine. Electrochem Comm. 2009;11:889–892. [Google Scholar]
- 2.Keeley GP, O’Neill A, McEvoy N, Peltekis N, Coleman JN, Duesberg GS. Electrochemical ascorbic acid sensor based on DMF-exfoliated graphene. J Mater Chem. 2010;20:7864–7869. [Google Scholar]
- 3.Varghese N, Mogera U, Govindaraj A, et al. Binding of DNA nucleobases and nucleosides with graphene. Chem Phys Chem. 2009;10:206–210. doi: 10.1002/cphc.200800459. [DOI] [PubMed] [Google Scholar]
- 4.Novoselov KS, Geim AK, Morozov SV, et al. Electric field effect in atomically thin carbon films. Science. 2004;306:666–669. doi: 10.1126/science.1102896. [DOI] [PubMed] [Google Scholar]
- 5.Biris AR, Mahmood M, Lazar MD, et al. Novel multicomponent and biocompatible nanocomposite materials based on few-layer graphenes synthesized on a gold/hydroxyapatite catalytic system with applications in bone regeneration. J Phys Chem C. 2011;115:18967–18976. [Google Scholar]
- 6.Biris AR, Ardelean S, Lazar MD, et al. Synthesis of few-layer graphene over gold nanoclusters supported on MgO. Carbon. 2012;50:2252–2263. [Google Scholar]
- 7.Dervishi E, Bourdo S, Driver JA, et al. Catalytic conversion of graphene into carbon nanotubes via gold nanoclusters at low temperatures. ACS Nano. 2012;6:501–511. doi: 10.1021/nn203836q. [DOI] [PubMed] [Google Scholar]
- 8.Lightcap IV, Kosel TH, Kamat PV. Anchoring semiconductor and metal nanoparticles on a two-dimensional catalyst mat. storing and shuttling electrons with reduced graphene oxide. Nano Lett. 2010;10:577–583. doi: 10.1021/nl9035109. [DOI] [PubMed] [Google Scholar]
- 9.Song Y, He Z, Zhu H, Hou H, Wang L. Electrochemical and electrocatalytic properties of cobalt nanoparticles deposited on graphene modified glassy carbon electrode: Application to some amino acids detection. Electrochim Acta. 2011;58:757–763. [Google Scholar]
- 10.Fan Y, Liu J-H, Lu H-T, Zhang Q. Electrochemistry and voltammetric determination of L-tryptophan and L-tyrosine using a glassy carbon electrode modified with a Nafion/TiO2-graphene composite film. Microchim Acta. 2011;173:241–247. [Google Scholar]
- 11.Diculescu VC, Chiorcea Paquim A-M, Oliveira Brett AM. Electrochemical sensors for detection of DNA damage. Sensors. 2005;5:377–393. [Google Scholar]
- 12.Liu H, Zhang L, Lang X, et al. Single molecule detection from a large-scale SERS-active Au79 Ag21 substrate. Sci Rep. 2011;1:112. doi: 10.1038/srep00112. [DOI] [PMC free article] [PubMed] [Google Scholar]
- 13.Zhao Y, Qi L, Chen F, et al. Ultrasensitive and selective detection of nicotinamide adenine dinucleotide by target-triggered ligation-rolling circle amplification. Chem Commun. 2012;48:3354–3356. doi: 10.1039/c2cc17422g. [DOI] [PubMed] [Google Scholar]
- 14.Oliveira-Brett AM, Serrano SHP, Piedade JAP. Comprehensive Chemical Kinetics. Amsterdam, The Netherlands: Elsevier; 1999. [Google Scholar]
- 15.Haruta M. Gold as a novel catalyst in the 21st century; preparation, working mechanism and applications. Gold Bull. 2004;37:27–36. [Google Scholar]
- 16.Biris AR, Lupu D, Grüneis A, et al. High quality double wall carbon nanotubes grown by a cold-wall radio frequency chemical vapor deposition process. Chem Mater. 2008;20:3466–3472. [Google Scholar]
- 17.Meyer JC, Geim AK, Katsnelson MI, et al. On the roughness of single- and bi-layer graphene membranes. Solid State Commun. 2007;143:101–109. [Google Scholar]
- 18.Pejman HT, Simon GP. Preparation of graphene nanowalls by simple microwave based method. Carbon. 2010;48:3993–4000. [Google Scholar]
- 19.Moon JM, An KH, Lee YH, Park YS, Bae DJ, Park GS. High-yield purification process of single walled carbon nanotubes. J Phys Chem B. 2001;105:5677–5681. [Google Scholar]
- 20.Dillon AC, Gennett T, Jones KM, Alleman JL, Parilla PA, Heben MJ. A simple and complete purification of single-walled carbon nanotube materials. Adv Mater. 1999;11:1354–1358. [Google Scholar]
- 21.Li Y, Zhang XB, Tao XY, et al. Mass production of high-quality multi-walled carbon nanotube bundles on a Ni/Mo/MgO catalyst. Carbon. 2005;43:295–301. [Google Scholar]
- 22.McKee GSB, Vecchio KS. Thermogravimetric analysis of synthesis variation effects on CVD generated multiwalled carbon nanotubes. J Phys Chem B. 2006;110:1179–1186. doi: 10.1021/jp054265h. [DOI] [PubMed] [Google Scholar]
- 23.Ramesh P, Okasaki T, Sugai T, et al. Purification and characterization of double-wall carbon nanotubes synthesized by catalytic chemical vapor deposition on mesoporous silica. Chem Phys Lett. 2006;418:408–412. [Google Scholar]
- 24.Dresselhaus MS, Jorio A, Hofmann M, Dresselhaus G, Saito R. Perspectives on carbon nanotubes and graphene Raman spectroscopy. Nano Lett. 2010;10:751–758. doi: 10.1021/nl904286r. [DOI] [PubMed] [Google Scholar]
- 25.Subrahmanyam KS, Vivekchand SRC, Govindaraj A, Rao CNR. A study of graphenes prepared by different methods: characterization, properties and solubilization. J Mater Chem. 2008;18:1517–1523. [Google Scholar]
- 26.Lucchese MM, Stavale F, Martins Ferreira EH, et al. Quantifying ion-induced defects and Raman relaxation length in graphene. Carbon. 2010;48:1592–1597. [Google Scholar]
- 27.Cançado LG, Takai K, Enoki T, et al. General equation for the determination of the crystallite size La of nanographite by Raman spectroscopy. Appl Phys Lett. 2006;88:163106. [Google Scholar]
- 28.Wu Y, Wang B, Ma Y, Huang Y, Li N, Zhang F, Chen Y. Efficient and large-scale synthesis of few-layered graphene using an arc-discharge method and conductivity studies of the resulting films. Nano Res. 2010;3:661–669. [Google Scholar]
- 29.Park HJ, Meyer J, Roth S, Skákalova V. Growth and properties of few-layer graphene prepared by chemical vapor deposition. Carbon. 2010;48:1088–1094. [Google Scholar]
- 30.Subrahmanyam KS, Manna AK, Pati SK, Rao CNR. A study of graphene decorated with metal nanoparticles. Chem Phys Lett. 2010;497:70–75. [Google Scholar]
- 31.McAllister MJ, Li J-L, Adamson DH, et al. Single sheet functionalized graphene by oxidation and thermal expansion of graphite. Chem Mater. 2007;19:4396–4404. [Google Scholar]
- 32.Liu ZH, Wang ZM, Yang X, Ooi K. Intercalation of organic ammonium ions into layered graphite oxide. Langmuir. 2002;18:4926–4932. [Google Scholar]
- 33.Seyama F, Akahori K, Sakata Y, Misumi S, Aida M, Nagata C. Synthesis and properties of purinophanes. Relationship between the magnitude of hypochromism and stacking geometry of purine rings. J Am Chem Soc. 1988;110:2192–2201. [Google Scholar]
- 34.Liu J, Li Y, Li Y, Li J, Deng Z. Noncovalent DNA decorations of graphene oxide and reduced graphene oxide toward water-soluble metal-carbon hybrid nanostructures via self-assembly. J Mater Chem. 2010;20:900–906. [Google Scholar]
- 35.Güell AG, Ebejer N, Snowden ME, Macpherson JV, Unwin PR. Structural correlations in heterogeneous electron transfer at monolayer and multilayer graphene electrodes. J Am Chem Soc. 2012;134:7258–7261. doi: 10.1021/ja3014902. [DOI] [PubMed] [Google Scholar]
- 36.McCreery RL. Advanced carbon electrode materials for molecular electrochemistry. Chem Rev. 2008;108:2646–2687. doi: 10.1021/cr068076m. [DOI] [PubMed] [Google Scholar]
- 37.McCreery RL, McDermott MT. Comment on electrochemical kinetics at ordered graphite electrodes. Anal Chem. 2012;84:2602–2605. doi: 10.1021/ac2031578. [DOI] [PubMed] [Google Scholar]
- 38.Gonçalves LM, Batchelor-McAuley C, Barros AA, Compton RG. Electrochemical oxidation of adenine: A mixed adsorption and diffusion response on an edge-plane pyrolytic graphite electrode. J Phys Chem C. 2010;114:14213–14219. [Google Scholar]
- 39.Li Q, Batchelor-McAuley C, Compton RG. Electrochemical oxidation of guanine: Electrode reaction mechanism and tailoring carbon electrode surfaces to switch between adsorptive and diffusional responses. J Phys Chem B. 2010;114:7423–7428. doi: 10.1021/jp1021196. [DOI] [PubMed] [Google Scholar]
- 40.Taylor HFW. The dissociation constants of benziminazole and certain purine derivatives. Chem Soc. 1948;174:765. doi: 10.1039/jr9480000765. [DOI] [PubMed] [Google Scholar]
- 41.Greef R, Peat R, Peter LM, Pletcher D, Robinson J. Instrumental Methods in Electrochemistry. Chichester, UK: Ellis Horwood Limited; 1985. [Google Scholar]


