

Abstract
The apolipoprotein E4 (APOE-ε4) allele is the strongest genetic risk factor for developing late-onset Alzheimer’s disease, and may predispose individuals to Alzheimer’s-related cognitive decline by affecting normal brain function early in life. To investigate the impact of human APOE alleles on cognitive performance in mice, we trained 3-mo-old APOE targeted replacement mice (E2, E3, and E4) in the Barnes maze to locate and enter a target hole along the perimeter of the maze. Long-term spatial memory was probed 24 h and 72 h after training. We found that young E4 mice exhibited significantly impaired spatial learning and memory in the Barnes maze compared to E3 mice. Deficits in spatial cognition were also present in a second independent cohort of E4 mice tested at 18 mo of age. In contrast, cognitive performance in the hidden platform water maze was not as strongly affected by APOE genotype. We also examined the dendritic morphology of neurons in the medial entorhinal cortex of 3-mo-old TR mice, neurons important to spatial learning functions. We found significantly shorter dendrites and lower spine densities in basal shaft dendrites of E4 mice compared to E3 mice, consistent with spatial learning and memory deficits in E4 animals. These findings suggest that human APOE-ε4 may affect cognitive function and neuronal morphology early in life.
Apolipoprotein E (ApoE) is a small (34-kDa) secreted glycoprotein synthesized in the CNS by glial cells, and a major constituent of high-density lipoprotein particles (Beffert et al. 1998). The APOE gene has three common alleles in human populations: APOE-ε2, APOE-ε3, and APOE-ε4. These alleles code for polymorphic forms of ApoE that differ by amino acids at residues 112 and 158 (Zannis et al. 1982). ApoE is a ligand for the low-density lipoprotein receptor family of endocytic receptors, and plays a role in the redistribution of lipids and the regulation of cholesterol homeostasis (Beffert et al. 1998; Kim et al. 2009).
The strong link between the APOE-ε4 allele and increased risk of late onset Alzheimer’s disease (AD) (Corder et al. 1993; Saunders et al. 1993; Strittmatter et al. 1993) has led to studies of isoform-specific roles for ApoE in CNS structure and function. APOE-ε4 carriers have differences in age-related cortical thickness, cognitive decline, and intrinsic functional brain network activity in the absence of AD pathological changes (Shaw et al. 2007; Burggren et al. 2008; Caselli et al. 2009; Huang 2010; Brown et al. 2011; Verghese et al. 2011; O’Dwyer et al. 2012). APOE-ε4 carriers also display deficits in episodic memory and show age-related memory decline earlier in life than noncarriers (Caselli et al. 1999; Nilsson et al. 2006). Similarly in mice, behavioral measures of spatial cognition are negatively affected in older (15–18 mo) targeted replacement (TR) mice expressing human ApoE4 compared to those expressing the E3 isoform (Bour et al. 2008; Andrews-Zwilling et al. 2010). Together, these reports suggest that APOE genotype differentially modulates cognitive processes during normal aging, and suggest that it may be possible to detect E4-related learning and memory deficits early in life.
APOE TR mice are an attractive model for behavioral studies of disease susceptibility. Expression of human ApoE is driven by the endogenous murine APOE promoter and no gross pathological changes to brain organization are evident (Sullivan et al. 1997; Kitamura et al. 2004; Korwek et al. 2009). In this model, the contribution of each ApoE isoform to a variety of CNS functions can be tested to determine adverse or protective mechanisms that influence AD risk. ApoE4 reduces dendritic complexity and spine density in vivo (Wang et al. 2005; Dumanis et al. 2009) and negatively affects hippocampal long-term potentiation (Trommer et al. 2004; Korwek et al. 2009; Chen et al. 2010). APOE4 TR mice have alterations in elements of the glutamate–glutamine cycle, and exhibit a seizure phenotype correlated with abnormal cortical EEG activity, indicating a disruption in the balance of excitatory and inhibitory neurotransmission (Hunter et al. 2012; Dumanis et al. 2013). These reports provide compelling evidence for abnormal neuronal function in E4 mice that may lead to cognitive impairment.
In this study, we asked whether deficits in spatial learning and memory previously reported in older E4 mice could be detected in younger animals using two behavioral paradigms: the Barnes circular maze and the hidden platform water maze (HPWM) (Barnes 1979; O’Leary and Brown 2012; Washington et al. 2012). In addition, we examined whether APOE alleles differentially regulate dendritic morphology of principal cells in the medial entorhinal cortex (MEC), an important source of cortical input conveying spatial information to the hippocampus, and a structure that plays a critical role in spatial representation and navigation (van Groen et al. 2003; Witter and Moser 2006; van Strien et al. 2009). Importantly, the entorhinal cortex is also a site of early dysfunction and neuronal loss in AD (Van Hoesen et al. 1991; Gomez-Isla et al. 1996).
Results
Young APOE4 TR mice exhibit impaired spatial learning and memory in the Barnes maze
To determine whether APOE genotype affected spatial learning and memory early in life, we trained 3-mo-old APOE TR mice (E2, n = 12; E3, n = 10; E4, n = 13) of mixed sexes to locate a target hole (TH) in a circular Barnes maze consisting of 20 holes evenly spaced along the perimeter (Barnes 1979; Berta et al. 2007). Occupancy plots were generated for mice of each APOE genotype and combined across trials by training day (TD) to demonstrate spatial location and time spent in the maze (Fig. 1A). During TD1, mice from all three genotypes actively explored all of the holes along the perimeter of the maze in order to locate the TH (arrow). By TD4, E2 and E3 mice spent little time investigating false holes, as indicated by the cooler colors appearing adjacent to false holes (Fig. 1A). In contrast, occupancy plots for E4 mice on TD4 show warm colors surrounding false holes, indicating a greater degree of time spent investigating other portions of the maze (Fig. 1A).
Figure 1.

Young APOE4 TR mice exhibit poor spatial learning in the Barnes maze. Three-month-old APOE TR mice (E2, n = 12; E3, n = 10; E4, n = 13) were trained to use visuospatial cues to locate a TH in the perimeter of the maze. (A) Occupancy plots for each APOE genotype were generated to visualize exploration on individual TDs; TD4 and TD1 are shown. Arrows indicate the TH. (B) E4 mice exhibit increased latency to escape the maze over four TDs compared to E3 mice that cannot be attributed to differences in running speed (C). (D) Whereas exploratory activity did not differ by genotype on TD1, E4 animals spent more time investigating false holes than E2 or E3 mice on subsequent TDs (see also A). Two-way ANOVA with repeated measures: (*) P < 0.05, (**) P < 0.01, (***) P < 0.001, E4 vs. E3. (#) P < 0.05, E2 vs. E3.
We quantified the latency to escape the maze. There was a significant effect of APOE genotype (F(2,96) = 21.36, P < 0.001) and TD (F(3,96) = 108.56, P < 0.001) on latency, but no interaction between factors. Each group of mice learned to locate the TH, but post hoc analyses revealed that E4 mice required significantly more time than E3 animals to locate the TH and escape the maze at each TD (TD1, P < 0.05; TD2, P < 0.001; TD3, P < 0.001; TD4, P < 0.05), suggestive of learning deficits in the spatial task (Fig. 1B). Escape latency was not significantly different between E2 and E3 animals. We also divided the surface area of the Barnes maze into four equally sized zones containing five holes each, and measured time spent actively exploring the zones. We found that all groups increased the percent time exploring the target zone across TDs (F(3,96) = 18.70, P < 0.001), with no effect of APOE genotype (Fig. 3A,B, see below). When escape latency was examined across the first four training trials during TD1, significant main effects of APOE genotype (F(2,96) = 3.73, P < 0.05) and trial (F(3,96) = 21.14, P < 0.001) were found, indicative of increased performance within the first TD. However, post hoc group differences were only detected on trial four (P < 0.05) (Supplemental Fig. 1). Escape latencies were similarly affected by APOE genotype in both females (F(2,39) = 8.73, P < 0.01) and males (F(2,48) = 17.61, P < 0.001) (E2, F = 6/M = 6; E3, F = 5/M = 5; E4, F = 5/M = 8) (Supplemental Fig. 2A).
Figure 3.

Young APOE TR mice develop and express a spatial discrimination bias in the Barnes maze. (A) A standard Barnes maze for behavioral testing in mice is shown. During the spatial acquisition phase of Barnes maze testing, the maze was divided into four zones of equal size surrounding the center of the maze, with each encompassing five holes. (B) At 3 mo of age, all APOE groups increased percent time spent in the zone containing the TH (target zone) over the four TDs. (C) During the 24-h and 72-h probe trials, total investigations of the closed TH and adjacent holes were averaged for each mouse. In addition, average investigations of the three opposite holes (nontarget) were collected. (Middle black arrow) closed TH, (black arrows) adjacent targets, (black X) non-THs. (D) All 3-mo-old APOE TR mice express a spatial preference for the THs over non-THs. Two-way ANOVA: (*) P < 0.05, (***) P < 0.001, THs vs. non-THs.
In addition to escape latency across training, we measured total distance traveled as a conventional measure of behavioral performance on the Barnes maze. We also measured average speed and total number of nose pokes to assess locomotor activity and exploratory drive, respectively (Fig. 1C,D). We found significant main effects of APOE genotype (F(2,96) = 9.02, P < 0.001) and TD (F(3,96) = 63.88, P < 0.001) on total distance traveled (data not shown), with no interaction between factors. E4 mice traveled farther than E3 mice to the reach the TH on TD2 (P < 0.001) and TD3 (P < 0.01). We found a significant interaction between APOE genotype × TD on average speed (F(6,96) = 3.03, P < 0.01), with significant main effects of both APOE genotype (F(2,96) = 20.22, P < 0.001) and TD (F(3,96) = 16.14, P < 0.001) (Fig. 1C). Post hoc comparisons revealed no differences between E3 and E4 genotype on the first 3 d of training. However, E4 mice were significantly slower on the maze than E3 mice on TD4 (P < 0.001). E2 speed was also significantly slower than that of E3 mice on TD4 (P < 0.05). As for exploratory drive, E4 mice maintained a high level of nose poke investigations throughout training, while E2 and E3 mice showed decreases over time (Fig. 1D). Significant main effects for APOE genotype (F(2,96) = 16.73, P < 0.001) and TD (F(3,96) = 17.69, P < 0.001) on total nose pokes were detected, with no interaction between factors. Post hoc analyses revealed no differences in performance on TD1, although significant differences for E4 mice did appear on subsequent TDs (TD2, P < 0.001; TD3, P < 0.01; TD4, P < 0.01). We subtracted the number of TH investigations from total nose pokes during training to determine total errors made. Expression of total errors made during training did not differ considerably from our graphs showing total nose pokes; Figure 1D is thus doubly informative in that it provides evidence for increased errors in young E4 mice. Test performances in any of these measures were not significantly different between E2 and E3 animals.
Twenty-four hours and 72 h after the last training trial, the TH was closed and animals were tested in a single 90-sec probe trial to assess long-term spatial memory (Fig. 2). During the 24-h probe, we found a trend toward increased primary latency in E4 mice, defined as the time required to initially reach the closed TH (F(2,31) = 3.28, P = 0.058) (Fig. 2A). Primary latency in E4 mice (17.93 ± 2.90 sec) during the first probe trial was lower than the escape latency recorded during TD4 (43.85 ± 5.45 sec), demonstrating improved performance between TD4 and the probe trial. No differences in primary errors (Fig. 2B), primary speed (Fig. 2C), or total nose pokes (Fig. 2D) were detected between groups during the 24-h probe trial. When we evaluated spatial preference for the closed TH and two adjacent holes, we found a significant effect of TH investigation in all TR mice compared to non-THs on the opposite side of the maze (F(1,62) = 79.31, P < 0.001) (Fig. 3C,D). At 72 h, there was a difference in primary latency (F(2,30) = 4.90, P < 0.05) between groups, with E4 mice requiring significantly more time to locate the TH than E3 mice (32.22 ± 6.55 sec vs. 11.24 ± 5.22 sec; post hoc analysis, P < 0.05) (Fig. 2E). Primary errors were also elevated in E4 mice (APOE genotype, F(2,30) = 6.70, P < 0.01; post hoc analysis, P < 0.05) (Fig. 2F). No differences in primary speed (Fig. 2G) or total nose pokes (Fig. 2H) were detected among APOE genotypes, and all mice expressed a preference for the closed TH (F(1,58) = 43.97, P < 0.001) (Fig. 3D).
Figure 2.

Spatial memory is impaired in young APOE4 TR mice 72 h after training. During the probe trials, the TH was closed and all mice were given 90 sec to freely explore the maze. (A) Twenty-four hours after training, E4 mice showed a trend toward higher primary latency. (B–D) There was no effect of APOE genotype on primary errors, primary speed, or total nose pokes on the maze. (E,F) Seventy-two hours after training, E4 mice showed increased primary latency and more primary errors compared to E3 mice. (G–H) Primary speed and total nose pokes did not differ between APOE genotypes. One-way ANOVA: (*) P < 0.05, (**) P < 0.01, E4 vs. E3.
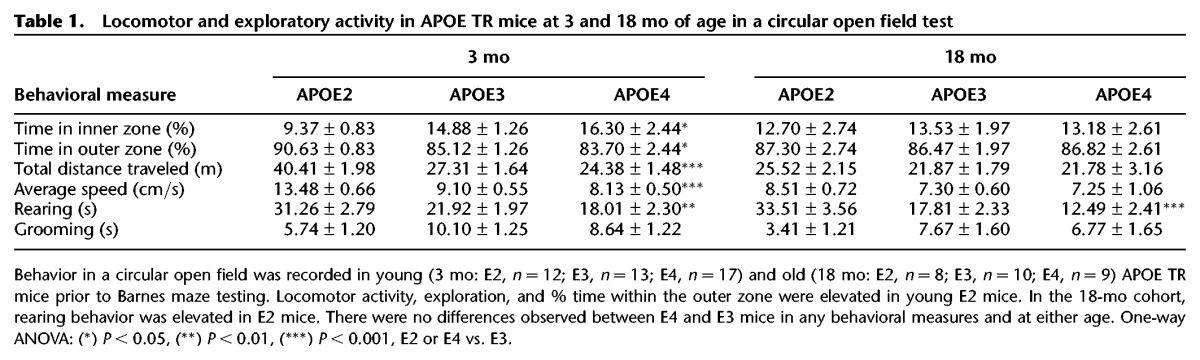
Prior to Barnes maze testing, we recorded behavior in an open field to identify any gross differences in locomotor activity or exploration that might interfere with initial Barnes maze habituation or training. We did not identify significant differences between E4 and E3 mice in any behavioral measures (Table 1). However, E2 mice did show significant differences in several locomotor and exploratory measures compared to E3 mice.
Table 1.
Locomotor and exploratory activity in APOE TR mice at 3 and 18 mo of age in a circular open field test
Together, these data show that 3-mo-old APOE4 TR mice exhibit performance deficits in the spatial acquisition phase and probe trials of the Barnes maze compared to the APOE3 TR mice that are not due to differences in locomotor activity or exploratory drive.
No deficit in spatial learning in young APOE4 TR mice in the hidden platform water maze
The HPWM task is another highly utilized behavioral test for assessing spatial learning and memory in rodents. We trained a comparable population of naive young (3-mo-old) APOE TR mice (E2, n = 10; E3, n = 12; E4, n = 9) of mixed sexes to find a hidden platform over four TDs using a protocol similar to that of the Barnes maze. In addition, we tested our mice in the same behavioral suite and utilized the same distal, extra-maze visual cues.
We found a significant main effect of TD on cumulative distance to platform (F(3,84) = 64.30, P < 0.001), but no effect of APOE genotype (F(2,84) = 2.06, P = 0.15) (data not shown). When we considered latency to reach the platform as our dependent measure, we found a significant main effect of TD as well (F(3,84) = 76.70, P < 0.001), with no effect of APOE genotype (Fig. 4A). Post hoc analyses revealed that genotype influenced the outcome at TD2 only (E4 vs. E3, P < 0.05). However, TD accounted for 61% of the variability in our model, while only 2% was due to APOE genotype. No main effects of APOE genotype were found when analysis was restricted by sex (E2, F = 4/M = 6; E3, F = 8/M = 4; E4, F = 4/M = 5), though post hoc comparisons did detect a difference in performance on HD2 in females (P < 0.01, E4 vs. E3) (Supplemental Fig. 2C). All groups reduced total distance traveled to platform over TDs (F(3,84) = 64.62, P < 0.001), with E2 mice traveling farther than E3 mice during the first 2 d (TD1, P < 0.01; TD2, P < 0.01) (Fig. 4B). E2 swim speeds were significantly higher than those of E3 mice (TD1, P < 0.01; TD2, P < 0.05; TD4, P < 0.01) (data not shown). However, we did not detect differences in swim speeds or total distance traveled to platform between E3 and E4 mice over training. Occupancy plots comparing patterns of activity in the HPWM on HD1 and HD4 qualitatively demonstrate greater spatial bias at the end of training for all APOE groups, though E2 swim patterns appear influenced by increased locomotor activity (Fig. 4C).
Figure 4.

Young APOE4 TR mice exhibit impaired spatial memory, but not learning, in the HPWM. A naive cohort of 3-mo-old APOE TR mice (E2, n = 11; E3, n = 12; E4, n = 9) were tested in the HPWM. (A) Time in seconds (latency to platform) to reach the hidden platform was measured over four TDs (HD 1–4). Behavioral performance in the hidden platform phase and during visible platform trials (VT) of the HPWM was not affected by APOE genotype. (B) Distance traveled during these sessions was also measured. E2 mice swam farther than E3 mice on the first 2 d of training, but performed similarly to E3 mice on subsequent days. (C) Occupancy plots comparing activity patterns on HD1 and HD4 in our TR mice illustrate improved performance over training, as well as a hyperactive phenotype in our E2 mice. Arrows indicate target quadrant. (D) During the probe trial 72 h after training, no difference in percent time spent in the target quadrant was detected between APOE groups. Within-group analyses show that E3 mice alone spent more time in the target quadrant than chance. (E) During the probe trial 72 h after TDs, no genotype differences in platform site crossings were found. Two-way ANOVA with repeated measures: (*) P < 0.05, E4 vs. E3; (##) P < 0.01, E2 vs. E3. One-way ANOVA: ($$$) P < 0.001, E3 (% time in target vs. other quadrants). Within-group t-tests: (+) P < 0.05, E3 (% time in target quadrant vs. 25%).
Seventy-two hours after training, we removed the hidden platform and recorded behavior in a single 90-sec probe trial to assess long-term memory (LTM) trace stability. APOE genotype did not affect the percentage of time spent in the target quadrant between groups (F(2,29) = 1.67, P = 0.21), although within-group t-tests revealed above chance (25%) navigation in the target quadrant for E3 mice alone (t(11) = 2.96, P < 0.05) (Fig. 4D). When compared to percent time spent in other quadrants, only E3 mice spent significantly more time in the target quadrant (target vs. other quadrants, P < 0.001). We also counted the number of platform site crossings in the target quadrant as a more stringent measure of memory performance (Fig. 4E), but did not detect differences in crossings or time spent swimming toward the platform site between groups. There was no effect of sex on any behavioral measures in the LTM probe. To test the visual acuity of our young TR mice, we ran three sequential trials (90 sec; inter-trial interval [ITI] = 30 min) 1 h after the 72-h probe with the platform 2 cm above the water’s surface in a new quadrant each trial. Latency to reach the platform was shorter for all groups relative to TD4, with no genotype differences detected (Fig. 4A).
Thus, unlike in the Barnes maze, APOE genotype did not influence behavioral performance in the spatial acquisition phase of the HPWM. However, E2 and E4 performance in a single probe trial was affected.
Eighteen-month-old APOE4 TR mice exhibit spatial learning deficits in the Barnes maze
To determine whether behavioral performance deficits seen in young E4 mice on the Barnes maze persisted or were exacerbated later in life, we trained a naive 18-mo-old cohort of TR mice (E2, n = 8; E3, n = 10; E4, n = 9) to locate a randomly assigned TH using identical test procedures. Prior to habituation, we again assessed locomotor activity and exploratory drive in a circular open field (Table 1). All groups spent most of the time exploring the outer zone of the maze (86.88 ± 1.40%), with no differences among APOE genotypes. Likewise, no differences were detected in total distance traveled, average speed, or grooming behavior during 300 sec of free exploration. Duration of rearing behavior was significantly elevated in E2 mice (F(2,24) = 14.87, P < 0.001; post hoc analysis, P < 0.01), but not different between E3 and E4 animals.
We carried our 18-mo-old TR mice through the Barnes maze spatial acquisition phase 24 h later. As with the younger cohort, we found significant main effects of APOE genotype (F(2,72) = 4.83, P < 0.05) and TD (F(3,72) = 23.16, P < 0.001) on total distance traveled, with E4 mice traveling farther than E3 mice to reach the TH (data not shown). In addition, we found significant main effects of APOE genotype (F(2,72) = 7.01, P < 0.01) and TD (F(3,72) = 58.38, P < 0.001) on latency to escape the maze, but no interaction between factors (Fig. 5A). All groups required over 90 sec on TD1 to locate and enter the TH, with no differences in performance between E3 and E4 mice. By TD4, E3 mice required 18.6 ± 2.0 sec to escape the maze, whereas E4 mice required over twice that time, although this difference was not statistically significant (P > 0.05). Post hoc analyses revealed that E4 mice required significantly more time to escape the maze than E3 mice on TD2 (P < 0.05).
Figure 5.

Impaired spatial learning on the Barnes maze in an older cohort of APOE4 TR mice. Naive 18-mo-old APOE TR mice (E2, n = 8; E3, n = 10; E4, n = 9) were trained on the Barnes maze to assess cognitive function in old age. (A) APOE genotype influenced latency to TH. Eighteen-month-old E4 mice required more time to find the TH and escape the maze than E3 mice on TD2. (B,C) Differences in running speeds between APOE genotypes were only detected on TD3 and TD4, reflecting a similar pattern of locomotor activity in our younger cohort. Additionally, all APOE groups developed a spatial bias in the Barnes maze. (D) Primary latency and primary errors were not affected by APOE genotype 24 h after training. By 72 h, primary latency was significantly affected by APOE genotype, though no effect on primary errors was evident. Primary latency performance was significantly elevated in E4 mice compared to that in E2 mice. Two-way ANOVA with repeated measures: (*) P < 0.05, E4 vs. E3.
When the maze was split into four zones, we found that all TR mice expressed a similar spatial preference for the target zone over TDs (F(3,72) = 19.24, P < 0.001) (Fig. 5C). Due to an inconsistent number of females vs. males in our 18-mo-old APOE groups, we pooled E2 and E3 mice as non-E4 carriers (non-E4, F = 7/M = 11; E4, F = 4/M = 5) and compared their behavior to that of E4 mice. We were able to detect an effect of APOE genotype on latency to escape the maze in males (F(1,42) = 12.61, P < 0.01), but not in females (P > 0.05), with E4 males performing slower (Supplemental Fig. 2B). In addition to escape latency, average speed over the course of training was similar to that of our younger cohort (Figs. 1C, 5B). We found significant main effects of APOE genotype (F(2,72) = 4.01, P < 0.05) and TD (F(3,72) = 34.68, P < 0.001) on speed, with post hoc analyses showing that E3 mice perform faster than E4 mice on TD3 (P < 0.01) and TD4 (P < 0.001). Finally, total nose pokes and total errors made over training were similar to those of our younger cohort (data not shown). Significant main effects were detected for APOE genotype (F(2,72) = 5.19, P < 0.05) and TD (F(3,72) = 7.01, P < 0.001) on total nose pokes, with no interaction between factors. Test performance was not significantly different between 18-mo-old E2 and E3 mice.
Twenty-four hours and 72 h after the last training trial, spatial LTM was probed in individual 90-sec trials with the TH closed. No genotype differences were detected in primary latency during the 24-h probe (F(2,23) = 1.30, P > 0.05) (Fig. 5D). Interestingly, the difference in E4 escape latency at TD4 (47.1 ± 5.8 sec) vs. E3 escape latency (18.6 ± 2.0 sec) was no longer present 24 h later (E3, 19.5 ± 3.6 sec; E4, 18.7 ± 2.4 sec). When we examined primary errors, we found no differences between groups (F(2,23) = 3.36, P = 0.053) (Fig. 5D). However, we did detect genotype differences in primary speed (F(2,23) = 3.96, P < 0.05) and total nose pokes (F(2,24) = 6.96, P < 0.01) (data not shown), with E4 mice performing the slowest and investigating the fewest holes in total compared to E2 (P < 0.05) or E3 mice (P < 0.01), respectively. When we assessed behavioral performance 72 h after training, we detected an effect of APOE genotype on primary latency (F(2,21) = 5.58, P < 0.01) (Fig. 5D), although this was restricted to the comparison between E4 and E2 animals (P < 0.01). E3 mice had a primary latency of 19.5 ± 3.1 sec, whereas E4 mice required 27.9 ± 2.8 sec to investigate the closed TH (not significant). We did not detect group differences in primary errors, primary speed, or total nose pokes in the 72-h probe.
Thus, within a naive cohort of 18-mo-old APOE TR mice, we were able to detect a pattern of activity in the spatial acquisition phase of the Barnes maze similar to that in our 3-mo-old mice.
APOE genotype alters dendritic morphology in layers II/III MEC pyramidal cells
Based on our behavioral results with young TR mice, we were interested in determining whether APOE genotype differentially affected dendritic morphology in MEC principal cells. We used a cohort of 3-mo-old female APOE TR mice (E2, n = 3; E3, n = 4; E4, n = 4) that had not undergone behavioral testing, and analyzed their brains using Golgi-Cox impregnation (Dumanis et al. 2009). Pyramidal cells within MEC layers II/III (E2, n = 8; E3, n = 6; E4, n = 10) were traced, coded, and analyzed by a blinded investigator (Fig. 6A). APOE genotype had a significant effect on total dendritic length of these cells (F(2,21) = 3.66, P < 0.05) (Fig. 6B): total length of MEC pyramidal cell dendrites was 33% shorter in E4 brains compared to E3 brains (P < 0.05). No significant difference in total dendritic length was observed between cells in E2 and E3 brains. We found significant main effects of APOE genotype (F(2,42) = 3.52, P < 0.05) and dendritic compartment (F(1,42) = 4.28, P < 0.05) on length of MEC pyramidal cell dendrites, with post hoc analyses revealing significantly shorter basal shaft dendrites in E2 (P < 0.05) and E4 (P < 0.001) MEC neurons compared to E3 neurons. In contrast, APOE genotype did not affect length of apical dendrites (Fig. 6B). No differences in node (branch) number or number of primary dendrites leaving the cell soma were detected (data not shown).
Figure 6.

Dendritic length and spine density of layers II/III MEC pyramidal cells is reduced in young APOE4 TR mice. Basal dendrites, but not apical or apical oblique, are affected. (A) Representative photomicrograph showing the laminar distribution of Golgi impregnated cells in the MEC: (left) hippocampal dorso-ventral axis and surrounding cortex (bar, 500 µm); (right) rotated image of the MEC with dorso-ventral axis shown on the left (bar, 200 µm). (B) Dendritic length of MEC pyramidal cells was measured in 3-mo-old APOE TR mice (E2, n = 3/8 cells; E3, n = 4/6 cells; E4, n = 4/10 cells). Total dendritic length in E4 mice was significantly reduced compared to that in E3 mice. Basal shaft dendrites were found to be significantly shorter in E2 and E4 cells compared to those in E3 cells. (C) Representative photomicrographs of basal dendritic segments for each APOE genotype. (D) Total dendritic spine density in E4 mice was significantly reduced relative to that in E3 mice. When analyzed as a function of dendritic compartment, E4 basal shaft dendrites alone exhibited reduced spine density. One-way or two-way ANOVA: (*) P < 0.05, (***) P < 0.001, E4 vs. E3.
In addition to dendritic length, we analyzed dendritic spine density of layers II/III MEC pyramidal cells (Fig. 6C). We found a significant effect of APOE genotype on spine density (F(2,18) = 7.01, P < 0.01), with E4 cells possessing 18% fewer spines/10 μm of dendritic segment compared to E3 cells (P < 0.05) (Fig. 6D). Spine densities did not differ between E2 and E3 cells. We also compared spine densities within apical dendrites and basal shaft dendrites. We found significant main effects of APOE genotype (F(2,36) = 8.25, P < 0.01) and dendritic compartment (F(1,36) = 8.27, P < 0.01), with a significant interaction between factors (F(2,36) = 3.78, P < 0.05). Post hoc analyses revealed that E4 dendritic spine density was significantly (34%) lower in basal shaft dendrites compared to E3 (P < 0.001), but not in apical dendrites (Fig. 6D).
Discussion
APOE is a polymorphic gene in humans that alters risk of CNS disease late in life and may alter normal brain function early in life. In this series of experiments, we found that young (3 mo) APOE4 TR mice had spatial learning and memory deficits as determined in the Barnes maze, and that E4 genotype was associated with reductions in MEC dendritic length and spine density at this age. Impaired spatial learning in E4 animals was also detected in an independent older cohort (18 mo) of mice, demonstrating a continuous, negative effect of E4 genotype on behavioral performance into late adulthood. These data support the idea that APOE genotype differentially modulates cognitive function throughout the lifespan, with E4 already affecting cognitive processes early in life.
Deficits in spatial learning and memory due to E4 have mainly been reported in older mice (Bour et al. 2008; Andrews-Zwilling et al. 2010), although some reports demonstrate impaired spatial recognition and contextual fear conditioning in younger animals (Grootendorst et al. 2005; Segev et al. 2013). To probe spatial cognition in young (3 mo) TR mice, we used two behavioral paradigms: the Barnes maze and the HPWM. The Barnes maze is a dry-land maze well suited for assessing spatial learning and memory in mice (Mayford et al. 1996; O’Leary and Brown 2012). Similar to the water maze, mice are trained to use visuospatial cues in the local or extra-maze environment to orient themselves and find a specific target. The task is typically acquired over several training trials and can be easily modified to suit the experimental needs of the investigator (Koopmans et al. 2003; Bour et al. 2008; O’Leary and Brown 2012). We found that young E4 mice exhibited a strong deficit in behavioral performance during the spatial acquisition phase, suggestive of impaired spatial learning (Fig. 1B). This behavioral deficit in E4 mice was not due to differences in locomotor activity across TDs, as post hoc analyses show that running speeds differed between E4 and E3 mice on TD4 only (Fig. 1C). Likewise, E4 behavioral deficits were not due to decreased exploratory drive, as total nose pokes remained elevated in E4 mice relative to E3 mice during training (Fig. 1D). In our older cohort of mice (18 mo), we were able to detect a similar pattern of behavioral performance during spatial acquisition (Fig. 5A–C). APOE genotype influenced latency to locate the TH and escape the maze, with post hoc tests revealing significantly worse performance in E4 mice on TD2 compared to E3. Performance differences between these groups on the two remaining TDs approach significance under post hoc analyses. The pattern of locomotor activity (Fig. 5B) and exploration across training was similar in young and old TR mice, suggesting use of a spatial strategy to find the TH. To quantitatively express this strategy, we evaluated percent time spent in the target zone in young and old TR mice, which showed expression of a spatial bias over training (Figs. 3A,B, 5B). Importantly, occupancy plots generated on TD4 for young E4 mice did not show preferences for other regions of the maze or for specific holes other than the TH, lending support for the establishment of a goal-specific spatial discrimination bias (Fig. 1A). Finally, to determine whether poor baseline performance and locomotor activity in young E4 mice played a role in poor overall performance on the Barnes maze, we analyzed escape latencies and average speeds of TR mice over the first four training trials (TD1) (Supplemental Fig. 1). Trial 1 escape latencies and running speeds (data not shown) were not affected by APOE genotype, suggesting that all mice had similar baseline activity upon exposure to Barnes maze training. Taken together, our Barnes maze data showing behavioral performance deficits in APOE4 TR mice provide evidence for E4-induced learning impairment early in life.
We sought to minimize or eliminate the influence of nonmnemonic factors in our behavioral tasks. Nonetheless, several factors unassociated with spatial learning processes may have influenced behavioral performance in our mice. For instance, heightened levels of anxiety or fear in our E4 mice may have resulted in increased escape latency in Barnes maze training. Though we did not measure anxiety levels in our mice directly, we habituated our experimental animals to testing and handling procedures prior to administration of the Barnes maze in order to reduce stress. We also cleaned the maze thoroughly after each experimental trial to help eliminate odor trails left by previously tested mice. Occupancy plots did not detect E4-specific freezing behavior upon initial exposure to the Barnes maze (TD1) or at the end of training (TD4) (Fig. 1A). We also did not detect genotype differences in latency to exit the center of the maze, a potential measure of stress reactivity. Importantly, decreased motivation and/or attention in E4 mice may have also played a role in Barnes maze performance deficits. Bright overhead lighting and weak aversive auditory stimulus (WAAS) were used to drive escape motivation in TR mice in place of deprivation procedures (Koopmans et al. 2003). These stimuli may have been perceived by E4 mice differently upon initial exposure to the maze and/or over TDs. We hypothesize that a lack of motivation or attentiveness to spatial cues would interfere with baseline activity or spatial discrimination in the maze and confound our other dependent measures. However, escape latencies and speed measured on the first trial of TD1 did not reveal group differences in baseline locomotor activity (Supplemental Fig. 1). In addition, we did not detect genotype differences in the development of a spatial bias during training in either young or old TR mice (Figs. 3A,B, 5C).
Probe trials assessing long-term spatial memory in our young and old mice were conducted 24 h and 72 h after successful Barnes maze training. Importantly, all 3-mo-old TR mice showed a clear preference for investigating the closed TH and two adjacent holes compared to non-THs on the opposite side of the maze (Fig. 3C,D). Eighteen-month-old E3 and E4 mice showed a similar spatial preference (data not shown). During the 24-h probe, no effect of APOE genotype on two indicators of spatial memory, primary latency and primary errors, was detected in either age group (Figs. 2A,B, 5D). Performance on these measures may reflect treatment of the 24-h probe as the first trial of a “fifth” TD, suggesting that, in spite of the performance deficit exhibited earlier during training, E4 mice eventually learn the task and perform comparably to E3 mice. When we examined behavior in the 72-h probe, we found significant performance deficits in young E4 mice on primary latency and primary errors (Fig. 2E,F). This increase in errors and time required to locate the closed TH could be due to several causes. One possibility is that successive probe testing in our animals may have led to enhanced extinction learning in young E4 mice. However, we would not expect that a single 90-sec probe trial would induce extinction of the original spatial memory trace, as the spatial location of the TH was established in 16 training trials spanning 4 d. Moreover, primary latency and primary error measurements in the 72-h probe did not change in young E2 and E3 mice. A second possible cause underlying decreased performance in E4 mice in the 72-h probe may be a change in motivation or attention from the previous probe trial. Such changes may lead to differences in performance between probe trials and APOE genotype, while not necessarily reflecting impaired spatial memory. A third possibility is that E4 mice were least able to recall the TH location compared to other APOE genotypes.
Using the HPWM, we did not detect overt genotype differences in spatial learning in young TR mice (Fig. 3). Importantly, the Barnes maze differs from the HPWM in that mice are allowed to naturally traverse the open field and freely explore the maze in order to locate the TH. Thus, performance on the Barnes maze reflects a balance between two innate drives in addition to learning and memory processes: a natural tendency to avoid open spaces set against an active drive to freely explore a novel environment. In contrast, the HPWM requires mice to constantly navigate a large pool in search of a platform and is not suitable for active exploration. Moreover, repeated training trials in the HPWM are more stressful and physically taxing to the animal than on the Barnes maze (Aguilar-Valles et al. 2005; Harrison et al. 2009). We hypothesize that, in the absence of free exploration, an elevated stress response in the water maze may facilitate spatial learning in young E4 mice and mask adverse effects of E4 on spatial cognition. In line with this hypothesis, acute elevations in stress-induced corticotrophin-releasing hormone have been shown to enhance excitatory transmission and hippocampal-dependent memory (Chen et al. 2012). APOE genotype had no overall effect on spatial acquisition or probe trial performance in HPWM, though within-group analyses show E3 mice perform well in the probe (Fig. 4A,D,E). E4 mice did not demonstrate a spatial preference for the target quadrant, suggesting a deficit in retention memory. These data potentially reflect a masking influence of HPWM-induced stress activation on cognitive processing, resulting in similar behavioral performance during hidden platform training, but not in probe trial performance. In a recent study, 6- to 8-mo-old E4 TR mice exhibited enhanced spatial learning in the water maze when considering cumulative distance to platform (Siegel et al. 2012). Interestingly, measures of anxiety were also elevated in E4 animals compared to age-matched E2 and E3 mice, supporting a role for stress in behavioral performance. Normal aging may counteract stress-induced facilitation of cognitive processing in E4 TR mice trained in the water maze, making phenotypic differences easier to detect in older mice (Bour et al. 2008; Andrews-Zwilling et al. 2010). Deficits in spatial acquisition were clearly present in both young and old E4 TR mice in the Barnes maze (Figs. 1, 4), which may reflect a more natural expression of spatial acquisition and memory processes that is sensitive to subtle deficits in cognitive function. It is important to note that despite impaired spatial learning in E4 mice, all animals were able to acquire the task over the course of four TDs (Figs. 1B, 4A; Supplemental Fig. 1A,B). We conclude that APOE4 has a subtle, but negative, impact on spatial cognition in TR mice that can be detected very early in adulthood. These results support the utility of the Barnes maze as an attractive assay to screen therapeutics aimed at targeting ApoE or its receptors, without the need to treat and test older mice.
Behavior of TR mice recorded in the open field satisfied a key objective relevant to our Barnes maze study: to determine if baseline differences in locomotor or exploratory activity would interfere with habituation or training. Open field testing also exposed TR mice to handling procedures, which may have helped reduce anxiety in subsequent behavioral testing. No differences in locomotor activity or exploration were detected between E3 and E4 mice at 3 or 18 mo of age (Table 1). In contrast, Siegel et al. (2012) found that young and old E4 TR mice exhibit reduced exploration in an open field compared to age-matched E2 and E3 mice. This discrepancy may be due to the shorter duration of recording per test session in our study (5 min compared to 10 min), which could have allowed for greater bouts of inactivity in E4 mice following comparable amounts of active exploration in the first 5 min of the task. Interestingly, our young E2 mice showed increased performance in all behaviors measured in the open field besides grooming, though this hyperactive phenotype did not manifest during Barnes maze testing. We did detect elevated swim speeds and distance traveled in young E2 mice in the HPWM, making probe trial performance difficult to interpret for the E2 mice.
We chose to investigate dendritic morphology in female TR mice based on the demonstrated sensitivity of cognitive performance in females to the APOE-ε4 allele (Supplemental Fig. 1; Raber et al. 2000; Bour et al. 2008; Andrews-Zwilling et al. 2010; Siegel et al. 2012). Compared to E3 mice, E4 mice showed lower dendritic spine densities of layers II/III pyramidal cells in the MEC and shorter overall length of dendritic arbors at 3 mo of age (Fig. 6). This observation is of particular relevance to our behavioral studies, as the entorhinal cortex is a key relay structure between the hippocampus and a variety of subcortical regions and association areas of cortex that convey multimodal and highly processed unimodal information (Canto et al. 2008). In humans, the entorhinal cortex (Brodmann area 28) is a large structure in the ventromedial temporal lobe that sends extensive projections to the hippocampal formation via the perforant pathway (Van Hoesen 1997). It is one of the first structures to exhibit neurofibrillary tangles in AD, and exhibits massive neuronal loss in superficial layers as the disease progresses (Van Hoesen et al. 1991; Braak and Braak 1995; Gomez-Isla et al. 1996). Interestingly, EC cortical volume and subregional thickness are reduced in cognitively normal APOE-ε4 carriers (Shaw et al. 2007; Burggren et al. 2008; Donix et al. 2010), suggesting an early manifestation of cortico-hippocampal dysfunction in prodromal AD. Analyses of Golgi-stained MEC neurons by dendritic compartment reveal that reductions in total dendritic length and spine density of E4 neurons were due to differences in basal shaft dendrites, but not apical or apical oblique dendrites (Fig. 6B–D). These differences may be functionally associated with our behavioral studies using the Barnes maze, as basal shaft dendrites of MEC layers II/III cells likely receive intrinsic collateral innervation from MEC superficial and deep layer neurons (Quilichini et al. 2010; Canto and Witter 2012). Reduced dendritic length and spine densities of basal shaft dendrites, but not apical dendrites, may reflect impaired local processing of spatial information within the MEC that disrupts spatial learning and memory. Apical dendrites of MEC layers II/III cells extend toward the pial surface and branch into tufts within layer I and superficial layer II, where they receive dense innervation from structures conveying sensory information: i.e., olfactory cortex, pre-subiculum, and postrhinal cortex (Burwell and Amaral 1998; Canto and Witter 2012). Visual testing revealed no group differences in young APOE TR mice (Fig. 3A), suggesting that sensory input into the MEC is not disrupted in these mice and does not underlie impaired behavioral performances. Further studies using TR mice could be done to determine whether E4 genotype affects firing properties of layers II/III principal cells in addition to altering dendritic morphology.
In summary, we detected APOE4-induced deficits in spatial cognition using the Barnes maze in two independent cohorts of animals at different ages. Furthermore, we found impaired dendritic morphology in E4 neurons in the MEC. Impaired spatial learning and memory in E4 TR mice likely reflect functional changes to neuronal networks subserving spatial information processing. These data suggest that ApoE isoforms affect normal MEC structure and normal brain functions of learning and memory early in life, which in later life may contribute to AD-related risk.
Materials and Methods
Animals
APOE2, APOE3, and APOE4 TR mice express each of the human APOE isoforms under the control of endogenous murine APOE regulatory sequences (Sullivan et al. 1997). All TR mice were on a C57BL/6J genetic background. Animals were maintained in a temperature and humidity controlled vivarium at Georgetown University Medical Center, provided food and water ad libitum, and subjected to a standard 12-h light/dark cycle. Behavioral manipulations were performed during the light phase. All experiments were conducted in accordance with NIH guidelines for the care and use of laboratory animals, and were reviewed and approved by the Georgetown University Animal Care and Use Committee.
Open field test
All mice were transported to a behavioral testing suite in their home cages and allowed to acclimate for 15 min. Locomotor activity, exploration, and general state anxiety were assessed using a circular open field maze (880-mm diameter, 55-mm wall height) constructed of white, nonreflective polyethylene plastic. The inner zone was situated in the center of the open field and was bordered by the outer zone, which comprised 54% of the maze area. Testing began by placing the mouse in the center of the inner zone and allowing 300 sec of free exploration. Behavioral activity was recorded via an overhead CCD camera linked to a computer running ANYmaze 4.7 tracking software (Stoelting Co.). Locomotor activity and exploratory drive was assessed via the following parameters: total distance traveled (m), average running speed (cm/sec), and duration of rearing behavior (sec). General state anxiety was estimated using time spent in outer vs. inner zone expressed as a percentage (%) and duration of grooming activity (sec). After each mouse was tested, the maze was thoroughly cleaned with a soap solution followed by water to remove odors. All behavioral testing procedures were conducted by an investigator blinded to APOE genotype.
Barnes maze—apparatus and testing conditions
The circular apparatus used (San Diego Instruments) was constructed of white polyethylene plastic (915-mm diameter; 115-cm height) and contained 20 circular holes (50-mm diameter) evenly spaced along the perimeter of the maze. Only the TH was deep enough for an animal to enter, and led to an escape chamber (108 mm × 55 mm × 55 mm) beneath the maze floor. Testing procedures and distal visual cues were modified to enhance visuospatial learning and memory (O’Leary and Brown 2012). We used a WAAS (78-dB blow-dryer simulation, Columbia River Entertainment, 2001) and bright overhead lighting (10.8 × 10² lux) to drive escape motivation. We also placed visual cues on the floor of the testing suite, as several animals peered over the edge of the maze in pilot experiments. Three-month-old (16 female/19 male) and 18-mo-old (12 female/15 male) TR mice completed three phases of Barnes maze testing: habituation, acquisition, and probe.
Habituation phase
At least 24 h after open field testing, animals were habituated to the Barnes maze testing conditions and allowed to freely explore the apparatus for 120 sec before being gently guided to a TH. Mice were given an additional 120 sec inside the escape chamber before being removed and returned to their home cages.
Spatial acquisition (learning) phase
Twenty-four hours after habituation, TR mice learned over 4 d (four trials/TD, ITI = 15 min, 16 trials total) to use distal visual cues to locate the TH and escape. At the beginning of a trial, animals were placed under a start box in the center of the maze for 10 sec before the start box was removed. A trial was terminated when the mouse had entered the TH or when 180 sec had elapsed. The position of the TH was randomly assigned and differed between habituation and spatial acquisition phases as well as between age groups. Latency to escape the maze by entering the TH (sec) was calculated to assess spatial learning, while total distance traveled (m) and average speed (cm/sec) were calculated to detect differences in locomotor activity. The number of hole investigations (total nose pokes) was counted as an indicator of exploration during the trials.
Probe (memory) phase
Twenty-four hours and 72 h after the last training trial, the TH was closed and spatial memory was assessed in 90-sec probe trials by measuring the latency to the closed TH (primary latency). Speed (primary speed) and number of investigations of false holes before reaching the TH (primary errors) were assessed in addition to total nose pokes. After each trial, the Barnes maze was thoroughly cleaned with a soap solution followed by water to remove odors.
Hidden platform water maze—apparatus and testing conditions
The HPWM utilized the same distal visual cues as for the Barnes maze. The apparatus consisted of a large tank (1.22-m diameter) filled with opaque water maintained at 25°C, with a hidden platform (101-mm diameter) submerged just below the surface. The location of the hidden platform remained constant throughout training trials, but was switched during visible platform trials at the end of testing.
Spatial acquisition (learning) phase
Naive 3-mo-old APOE TR mice (17 male/12 female) were trained over the course of 4 d (four trials/TD, ITI = 20 min, 16 trials total) to locate the position of the hidden platform. Mice were introduced into the pool and tracked during a 90-sec training trial using the ANYmaze system. A training trial was terminated once the animal located the platform and remained for 2 sec, subsequently being removed after 60 sec. If an animal did not successfully find the hidden platform, it was gently guided to the platform and allowed to remain for 60 sec before being removed. Latency to find the hidden platform (sec), distance traveled (m), and average speed (cm/sec) were calculated to assess spatial learning and locomotor activity over TDs.
Probe (memory) phase
Seventy-two hours after the last training trial, the hidden platform was removed and spatial memory was assessed in a single 90-sec probe trial. Average time spent in the target quadrant was recorded as well as number of platform site crossings.
Visible platform phase
One hour after the probe trial, TR mice were tested for visual acuity in the water maze using a visible platform placed in a new quadrant each trial. Latency to reach the platform, distance traveled, and swim speed were recorded in each of three trials (90 sec, ITI = 20 min).
Golgi staining and analysis of dendritic morphology
Brains from naive 3-mo-old APOE TR mice were dissected and processed for Golgi staining using the FD Rapid Golgi Stain kit (FD NeuroTechnologies, Inc.) as described previously (Dumanis et al. 2009; Hoe et al. 2009). Briefly, we immersed brains in solutions A and B for 2 wk at room temperature before transferring to solution C for 48 h at 4°C. Sagittal sections (150-μm thick) were sliced on a vibratome and mounted on gelatin-coated slides (Lab Scientific). The MEC was identified in three to four sections/brain using a mouse brain atlas (Paxinos and Franklin 2001). Clustered bands of Golgi stained cells were observed in MEC layers II/III and were delineated by the mostly acellular molecular layer I near the pial surface and the lamina dissecans (layer IV) (Fig. 6A). Only fully impregnated layer II/III pyramidal neurons with clear dendritic arbors were chosen for analysis. Z-stacked images were acquired under bright field microscopy using an Axioplan 2 upright microscope (Zeiss Microsystems, Inc.). The files were then coded and analyzed in a blinded manner using the open-source image processing suite Fiji (Schindelin et al. 2012). Total dendritic length was assessed for each neuron by tracing main dendritic processes extending from the soma and their branches. Dendritic segments chosen for spine analysis were randomly selected from basal and apical arbors while excluding the initial segment (20 µm) of the main apical shaft and apical tufts.
Statistical analysis
All statistical analyses were performed using GraphPad Prism 5 unless noted otherwise. Differences between means were assessed by t-test, one-way ANOVA, or two-way ANOVA with repeated measures, followed by Tukey’s HSD and Bonferonni post hoc tests where appropriate. Descriptive statistics are expressed as mean ± SEM, with significance set at P < 0.05.
Acknowledgments
This work was supported by National Institutes of Aging grants R01 AG035379, P01 AG030128 (G.W.R. and E.J.W.), and RO1 AG035379-S (G.A.R.). We thank Dr. Sonya B. Dumanis for expert technical assistance and Dr. Dan T. S. Pak for generously providing microscope use and technical support. We also thank Dr. Patrick Sullivan for generously providing us with the APOE TR mice.
Footnotes
[Supplemental material is available for this article.]
References
- Aguilar-Valles A, Sanchez E, de Gortari P, Balderas I, Ramirez-Amaya V, Bermudez-Rattoni F, Joseph-Bravo P 2005. Analysis of the stress response in rats trained in the water-maze: Differential expression of corticotropin-releasing hormone, CRH-R1, glucocorticoid receptors and brain-derived neurotrophic factor in limbic regions. Neuroendocrinology 82: 306–319 [DOI] [PubMed] [Google Scholar]
- Andrews-Zwilling Y, Bien-Ly N, Xu Q, Li G, Bernardo A, Yoon SY, Zwilling D, Yan TX, Chen L, Huang Y 2010. Apolipoprotein E4 causes age- and tau-dependent impairment of GABAergic interneurons, leading to learning and memory deficits in mice. J Neurosci 30: 13707–13717 [DOI] [PMC free article] [PubMed] [Google Scholar]
- Barnes CA 1979. Memory deficits associated with senescence: A neurophysiological and behavioral study in the rat. J Comp Physiol Psychol 93: 74–104 [DOI] [PubMed] [Google Scholar]
- Beffert U, Danik M, Krzywkowski P, Ramassamy C, Berrada F, Poirier J 1998. The neurobiology of apolipoproteins and their receptors in the CNS and Alzheimer’s disease. Brain Res Brain Res Rev 27: 119–142 [DOI] [PubMed] [Google Scholar]
- Berta S, Gert L, Harald H, Sudarshan P 2007. Barnes maze, a useful task to assess spatial reference memory in the mice. Protoc Exch 10.1038/nprot.2007.390 [DOI]
- Bour A, Grootendorst J, Vogel E, Kelche C, Dodart JC, Bales K, Moreau PH, Sullivan PM, Mathis C 2008. Middle-aged human ApoE4 targeted-replacement mice show retention deficits on a wide range of spatial memory tasks. Behav Brain Res 193: 174–182 [DOI] [PubMed] [Google Scholar]
- Braak H, Braak E 1995. Staging of Alzheimer’s disease-related neurofibrillary changes. Neurobiol Aging 16: 271–278; discussion 278–284 [DOI] [PubMed] [Google Scholar]
- Brown JA, Terashima KH, Burggren AC, Ercoli LM, Miller KJ, Small GW, Bookheimer SY 2011. Brain network local interconnectivity loss in aging APOE-4 allele carriers. Proc Natl Acad Sci 108: 20760–20765 [DOI] [PMC free article] [PubMed] [Google Scholar]
- Burggren AC, Zeineh MM, Ekstrom AD, Braskie MN, Thompson PM, Small GW, Bookheimer SY 2008. Reduced cortical thickness in hippocampal subregions among cognitively normal apolipoprotein E e4 carriers. Neuroimage 41: 1177–1183 [DOI] [PMC free article] [PubMed] [Google Scholar]
- Burwell RD, Amaral DG 1998. Perirhinal and postrhinal cortices of the rat: Interconnectivity and connections with the entorhinal cortex. J Comp Neurol 391: 293–321 [DOI] [PubMed] [Google Scholar]
- Canto CB, Witter MP 2012. Cellular properties of principal neurons in the rat entorhinal cortex. II. The medial entorhinal cortex. Hippocampus 22: 1277–1299 [DOI] [PubMed] [Google Scholar]
- Canto CB, Wouterlood FG, Witter MP 2008. What does the anatomical organization of the entorhinal cortex tell us? Neural Plast 2008: 381243. [DOI] [PMC free article] [PubMed] [Google Scholar]
- Caselli RJ, Graff-Radford NR, Reiman EM, Weaver A, Osborne D, Lucas J, Uecker A, Thibodeau SN 1999. Preclinical memory decline in cognitively normal apolipoprotein E-ε4 homozygotes. Neurology 53: 201–207 [DOI] [PubMed] [Google Scholar]
- Caselli RJ, Dueck AC, Osborne D, Sabbagh MN, Connor DJ, Ahern GL, Baxter LC, Rapcsak SZ, Shi J, Woodruff BK, et al. 2009. Longitudinal modeling of age-related memory decline and the APOE ε4 effect. N Engl J Med 361: 255–263 [DOI] [PMC free article] [PubMed] [Google Scholar]
- Chen Y, Durakoglugil MS, Xian X, Herz J 2010. ApoE4 reduces glutamate receptor function and synaptic plasticity by selectively impairing ApoE receptor recycling. Proc Natl Acad Sci 107: 12011–12016 [DOI] [PMC free article] [PubMed] [Google Scholar]
- Chen Y, Andres AL, Frotscher M, Baram TZ 2012. Tuning synaptic transmission in the hippocampus by stress: The CRH system. Front Cell Neurosci 6: 13. [DOI] [PMC free article] [PubMed] [Google Scholar]
- Corder EH, Saunders AM, Strittmatter WJ, Schmechel DE, Gaskell PC, Small GW, Roses AD, Haines JL, Pericak-Vance MA 1993. Gene dose of apolipoprotein E type 4 allele and the risk of Alzheimer’s disease in late onset families. Science 261: 921–923 [DOI] [PubMed] [Google Scholar]
- Donix M, Burggren AC, Suthana NA, Siddarth P, Ekstrom AD, Krupa AK, Jones M, Rao A, Martin-Harris L, Ercoli LM, et al. 2010. Longitudinal changes in medial temporal cortical thickness in normal subjects with the APOE-4 polymorphism. Neuroimage 53: 37–43 [DOI] [PMC free article] [PubMed] [Google Scholar]
- Dumanis SB, Tesoriero JA, Babus LW, Nguyen MT, Trotter JH, Ladu MJ, Weeber EJ, Turner RS, Xu B, Rebeck GW, et al. 2009. ApoE4 decreases spine density and dendritic complexity in cortical neurons in vivo. J Neurosci 29: 15317–15322 [DOI] [PMC free article] [PubMed] [Google Scholar]
- Dumanis SB, Dibattista AM, Miessau M, Moussa CE, William Rebeck G 2013. APOE genotype affects the presynaptic compartment of glutamatergic nerve terminals. J Neurochem 124: 4–14 [DOI] [PMC free article] [PubMed] [Google Scholar]
- Gomez-Isla T, Price JL, McKeel DW Jr, Morris JC, Growdon JH, Hyman BT 1996. Profound loss of layer II entorhinal cortex neurons occurs in very mild Alzheimer’s disease. J Neurosci 16: 4491–4500 [DOI] [PMC free article] [PubMed] [Google Scholar]
- Grootendorst J, Bour A, Vogel E, Kelche C, Sullivan PM, Dodart JC, Bales K, Mathis C 2005. Human ApoE targeted replacement mouse lines: h-ApoE4 and h-ApoE3 mice differ on spatial memory performance and avoidance behavior. Behav Brain Res 159: 1–14 [DOI] [PubMed] [Google Scholar]
- Harrison FE, Hosseini AH, McDonald MP 2009. Endogenous anxiety and stress responses in water maze and Barnes maze spatial memory tasks. Behav Brain Res 198: 247–251 [DOI] [PMC free article] [PubMed] [Google Scholar]
- Hoe HS, Lee KJ, Carney RS, Lee J, Markova A, Lee JY, Howell BW, Hyman BT, Pak DT, Bu G, et al. 2009. Interaction of reelin with amyloid precursor protein promotes neurite outgrowth. J Neurosci 29: 7459–7473 [DOI] [PMC free article] [PubMed] [Google Scholar]
- Huang Y 2010. Aβ-independent roles of apolipoprotein E4 in the pathogenesis of Alzheimer’s disease. Trends Mol Med 16: 287–294 [DOI] [PubMed] [Google Scholar]
- Hunter JM, Cirrito JR, Restivo JL, Kinley RD, Sullivan PM, Holtzman DM, Koger D, Delong C, Lin S, Zhao L, et al. 2012. Emergence of a seizure phenotype in aged apolipoprotein ε 4 targeted replacement mice. Brain Res 1467: 120–132 [DOI] [PubMed] [Google Scholar]
- Kim J, Basak JM, Holtzman DM 2009. The role of apolipoprotein E in Alzheimer’s disease. Neuron 63: 287–303 [DOI] [PMC free article] [PubMed] [Google Scholar]
- Kitamura HW, Hamanaka H, Watanabe M, Wada K, Yamazaki C, Fujita SC, Manabe T, Nukina N 2004. Age-dependent enhancement of hippocampal long-term potentiation in knock-in mice expressing human apolipoprotein E4 instead of mouse apolipoprotein E. Neurosci Lett 369: 173–178 [DOI] [PubMed] [Google Scholar]
- Koopmans G, Blokland A, van Nieuwenhuijzen P, Prickaerts J 2003. Assessment of spatial learning abilities of mice in a new circular maze. Physiol Behav 79: 683–693 [DOI] [PubMed] [Google Scholar]
- Korwek KM, Trotter JH, Ladu MJ, Sullivan PM, Weeber EJ 2009. ApoE isoform-dependent changes in hippocampal synaptic function. Mol Neurodegener 4: 21. [DOI] [PMC free article] [PubMed] [Google Scholar]
- Mayford M, Bach ME, Huang YY, Wang L, Hawkins RD, Kandel ER 1996. Control of memory formation through regulated expression of a CaMKII transgene. Science 274: 1678–1683 [DOI] [PubMed] [Google Scholar]
- Nilsson LG, Adolfsson R, Backman L, Cruts M, Nyberg L, Small BJ, Van Broeckoven C 2006. The influence of APOE status on episodic and semantic memory: Data from a population-based study. Neuropsychology 20: 645–657 [DOI] [PubMed] [Google Scholar]
- O’Dwyer L, Lamberton F, Matura S, Tanner C, Scheibe M, Miller J, Rujescu D, Prvulovic D, Hampel H 2012. Reduced hippocampal volume in healthy young ApoE4 carriers: An MRI study. PLoS One 7: e48895. [DOI] [PMC free article] [PubMed] [Google Scholar]
- O’Leary TP, Brown RE 2012. The effects of apparatus design and test procedure on learning and memory performance of C57BL/6J mice on the Barnes maze. J Neurosci Methods 203: 315–324 [DOI] [PubMed] [Google Scholar]
- Paxinos G, Franklin KBJ 2001. The mouse brain in stereotaxic coordinates. Academic Press, San Diego, CA [Google Scholar]
- Quilichini P, Sirota A, Buzsaki G 2010. Intrinsic circuit organization and θ–γ oscillation dynamics in the entorhinal cortex of the rat. J Neurosci 30: 11128–11142 [DOI] [PMC free article] [PubMed] [Google Scholar]
- Raber J, Wong D, Yu GQ, Buttini M, Mahley RW, Pitas RE, Mucke L 2000. Apolipoprotein E and cognitive performance. Nature 404: 352–354 [DOI] [PubMed] [Google Scholar]
- Saunders AM, Strittmatter WJ, Schmechel D, George-Hyslop PH, Pericak-Vance MA, Joo SH, Rosi BL, Gusella JF, Crapper-MacLachlan DR, Alberts MJ, et al. 1993. Association of apolipoprotein E allele ε4 with late-onset familial and sporadic Alzheimer’s disease. Neurology 43: 1467–1472 [DOI] [PubMed] [Google Scholar]
- Schindelin J, Arganda-Carreras I, Frise E, Kaynig V, Longair M, Pietzsch T, Preibisch S, Rueden C, Saalfeld S, Schmid B, et al. 2012. Fiji: An open-source platform for biological-image analysis. Nat Methods 9: 676–682 [DOI] [PMC free article] [PubMed] [Google Scholar]
- Segev Y, Michaelson DM, Rosenblum K 2013. ApoE ε4 is associated with eIF2α phosphorylation and impaired learning in young mice. Neurobiol Aging 34: 863–872 [DOI] [PubMed] [Google Scholar]
- Shaw P, Lerch JP, Pruessner JC, Taylor KN, Rose AB, Greenstein D, Clasen L, Evans A, Rapoport JL, Giedd JN 2007. Cortical morphology in children and adolescents with different apolipoprotein E gene polymorphisms: An observational study. Lancet Neurol 6: 494–500 [DOI] [PubMed] [Google Scholar]
- Siegel JA, Haley GE, Raber J 2012. Apolipoprotein E isoform-dependent effects on anxiety and cognition in female TR mice. Neurobiol Aging 33: 345–358 [DOI] [PMC free article] [PubMed] [Google Scholar]
- Strittmatter WJ, Saunders AM, Schmechel D, Pericak-Vance M, Enghild J, Salvesen GS, Roses AD 1993. Apolipoprotein E: High-avidity binding to β-amyloid and increased frequency of type 4 allele in late-onset familial Alzheimer disease. Proc Natl Acad Sci 90: 1977–1981 [DOI] [PMC free article] [PubMed] [Google Scholar]
- Sullivan PM, Mezdour H, Aratani Y, Knouff C, Najib J, Reddick RL, Quarfordt SH, Maeda N 1997. Targeted replacement of the mouse apolipoprotein E gene with the common human APOE3 allele enhances diet-induced hypercholesterolemia and atherosclerosis. J Biol Chem 272: 17972–17980 [DOI] [PubMed] [Google Scholar]
- Trommer BL, Shah C, Yun SH, Gamkrelidze G, Pasternak ES, Ye GL, Sotak M, Sullivan PM, Pasternak JF, LaDu MJ 2004. ApoE isoform affects LTP in human targeted replacement mice. Neuroreport 15: 2655–2658 [DOI] [PubMed] [Google Scholar]
- van Groen T, Miettinen P, Kadish I 2003. The entorhinal cortex of the mouse: Organization of the projection to the hippocampal formation. Hippocampus 13: 133–149 [DOI] [PubMed] [Google Scholar]
- Van Hoesen GW 1997. Ventromedial temporal lobe anatomy, with comments on Alzheimer’s disease and temporal injury. J Neuropsychiatry Clin Neurosci 9: 331–341 [DOI] [PubMed] [Google Scholar]
- Van Hoesen GW, Hyman BT, Damasio AR 1991. Entorhinal cortex pathology in Alzheimer’s disease. Hippocampus 1: 1–8 [DOI] [PubMed] [Google Scholar]
- van Strien NM, Cappaert NL, Witter MP 2009. The anatomy of memory: An interactive overview of the parahippocampal–hippocampal network. Nat Rev Neurosci 10: 272–282 [DOI] [PubMed] [Google Scholar]
- Verghese PB, Castellano JM, Holtzman DM 2011. Apolipoprotein E in Alzheimer’s disease and other neurological disorders. Lancet Neurol 10: 241–252 [DOI] [PMC free article] [PubMed] [Google Scholar]
- Wang C, Wilson WA, Moore SD, Mace BE, Maeda N, Schmechel DE, Sullivan PM 2005. Human ApoE4-targeted replacement mice display synaptic deficits in the absence of neuropathology. Neurobiol Dis 18: 390–398 [DOI] [PubMed] [Google Scholar]
- Washington PM, Forcelli PA, Wilkins T, Zapple DN, Parsadanian M, Burns MP 2012. The effect of injury severity on behavior: A phenotypic study of cognitive and emotional deficits after mild, moderate, and severe controlled cortical impact injury in mice. J Neurotrauma 29: 2283–2296 [DOI] [PMC free article] [PubMed] [Google Scholar]
- Witter MP, Moser EI 2006. Spatial representation and the architecture of the entorhinal cortex. Trends Neurosci 29: 671–678 [DOI] [PubMed] [Google Scholar]
- Zannis VI, Breslow JL, Utermann G, Mahley RW, Weisgraber KH, Havel RJ, Goldstein JL, Brown MS, Schonfeld G, Hazzard WR, et al. 1982. Proposed nomenclature of ApoE isoproteins, ApoE genotypes, and phenotypes. J Lipid Res 23: 911–914 [PubMed] [Google Scholar]