Abstract
Cardiac steroids (CSs) are specific inhibitors of Na+, K+-ATPase activity. Although the presence of CS-like compounds in animal tissues has been established, their physiological role is not evident. In the present study, treatment of human NT2 cells with physiological concentrations (nanomolar) of CSs caused the accumulation of large vesicles adjacent to the nucleus. Experiments using N-(3-triethylammonium propyl)-4-(dibutilamino)styryl-pyrodinum dibromide, transferrin, low-density lipoprotein, and selected anti-transferrin receptor and Rab protein antibodies revealed that CSs induced changes in endocytosis-dependent membrane traffic. Our data indicate that the CS-induced accumulation of cytoplasmic membrane components is a result of inhibited recycling within the late endocytic pathway. Furthermore, our results support the notion that the CS-induced changes in membrane traffic is mediated by the Na+, K+-ATPase. These phenomena were apparent in NT2 cells at nanomolar concentrations of CSs and were observed also in other human cell lines, pointing to the generality of this phenomenon. Based on these observations, we propose that the endogenous CS-like compounds are physiological regulators of recycling of endocytosed membrane proteins and cargo.
INTRODUCTION
Na+, K+-ATPase is an enzyme present in the plasma membrane of most eukaryotic cells that hydrolyzes ATP and uses the free energy thus generated to drive potassium into the cell and sodium out of the cell, against their electrochemical gradients. This enzyme is the major determinant of the Na+ and K+ electrochemical gradient. As such, it has an important role in regulating cell volume, the plasma membrane electrical potential, cytoplasmic pH, and Ca2+ levels through the Na+/H+ and Na+/Ca2+ exchangers, respectively, and in driving a variety of secondary transport processes (Lingrel, 1992; Blanco and Mercer, 1998; Mobasheri et al., 2000; Scheiner-Bobis, 2002). After the discovery, >40 years ago, of the Na+, K+-ATPase, it was found that plant and amphibian steroids (digitalis, cardenolides, and bufadienolides), collectively termed here as cardiac steroids (CSs), bind to a specific site on the enzyme and inhibit ATP hydrolysis and ion transport (Kelly and Smith, 1996). In the past decade, several groups have identified CS-like compounds in animal tissues. Ouabain was demonstrated in human plasma and adrenal (Hamlyn et al., 1991; Sich et al., 1996), digoxin was shown to be present in human urine (Goto et al., 1990), a ouabain isomer was found in bovine hypothalamus (Tymiak et al., 1993), 19-norbufalin and its peptide derivative were identified in cataractous human lenses (Lichtstein et al., 1993), and dihydropyrone-substituted bufadienolide in human placenta (Hilton et al., 1996). In addition, immunoreactivity of marinobufogenin-like (Bagrov et al., 1995) and proscillaridin A-like compounds (Sich et al., 1996), which also are members of the bufadienolide family, have been demonstrated in human plasma. The structural similarity between the different CS-like compounds identified so far suggests a common precursor and biosynthetic pathway. Numerous studies have shown that the endogenous CS-like compounds are synthesized in and secreted by the adrenal gland (Takahashi, 2000; Schoner, 2002). The level of these endogenous CS-like compounds in human plasma varies between 0.1 and 1 nM (Hamlyn et al., 1996; Goto and Yamada, 1998) and their physiological role, despite extensive research, remains obscure. One of the effects of CS at relatively low concentrations is the induction of apoptosis. In the past decade, it was demonstrated that nanomolar concentrations of the bufadienolide bufalin reduce growth and induce apoptosis in the human myeloid leukemia HL-60, U937, ML1, THP-1, and K562 cell lines (Zhang et al., 1992; Numazawa et al., 1994).
One of the most studied pathways of vesicle traffic is endocytosis, a process in which the cells internalize material from the environment and cell-surface receptors, some of which are consequently recycled (Mellman, 1996; Gruenberg, 2001). In the present study, we demonstrate that CSs, at nanomolar concentrations, induce changes in membrane traffic, independently of their ability to trigger apoptosis, by inhibiting endocytosis-dependent membrane recycling.
MATERIALS AND METHODS
Materials and Antibodies
Bufalin, etoposide, monoclonal antibodies anti-human Na+, K+-ATPase α subunits, clone M7-PB-E9, protease inhibitor cocktail [aprotinin 80 μM, leupeptin 2.2 mM, bestatin 4 mM, pepstatin 1.5 mM, E-64 1.4 mM, 4-(2-aminoethyl)benzenesulfonyl fluoride 100 mM], and geneticin disulfate salt (G418) were purchased from Sigma-Aldrich (St. Louis, MO.). FuGENE 6 transfection reagent was obtained from Roche Diagnostics (Indianapolis, IN), pCI-neo vector from Promega (Madison, WI), and pCMV Ouabainr vector from BD Biosciences PharMingen (San Diego, CA). Low-density lipoproteins (LDL) labeled with BODIPY FL, transferrin labeled with Alexa Fluor 594 or with Alexa Fluor 633, and N-(3-triethylammonium propyl)-4-(dibutilamino)styrylpyrodinum dibromide (FM1-43) were purchased from Molecular Probes (Eugene, OR), and wortmanin and LY294002 were obtained from Calbiochem (San Diego, CA). Rabbit polyclonal antibodies against CD71 (sc-9099), Rab 4 (sc-312), Rab 5 (sc-309), Rab 7 (sc-6563), and Rab 11 (sc-6565) were obtained from Santa Cruz Biotechnology (Santa Cruz Biotechnology, CA). Polyclonal Cy5- and Cy2-conjugated AffiniPure, peroxidase-conjugated goat anti-mouse IgG F(ab)2 fragment, and polyclonal Cy3-conjugated AffiniPure goat antirabbit IgG F(ab)2 fragment were purchased from Jackson ImmunoResearch Laboratories (West Grove, PA), and enhanced chemiluminescence kits were from Pierce Chemical (Rockford, IL). Serum, cell culture medium, and antibiotics were provided by Biological Industries (Beit Haemek, Israel).
Cell Culture and Transfection
NT2 cells (human neuronal precursor cells) were obtained from Stratagene Cloning Systems (La Jolla, CA). The cells were cultured in T25 tissue culture flasks in DMEM-F12 supplemented with 2 mM glutamine, 10% fetal bovine serum, 100 U/ml penicillin, and 100 μg/ml streptomycin at 5% CO2 in 37°C, as described previously (Pleasure et al., 1992). The cells were grown to confluence and then split 1:4-1:5 by trypsinization and replated. In the fluorescence microscopy studies, cells were grown on glass coverslips, mounted with neutral contact glue on a 1.4 × 2.4-cm aperture in the center of 6-cm petri dishes, 24-48 h before the experiments. For transfection, NT2 cells were plated in 3-cm tissue culture plates at 105 cells/plate and transfected with 1 μg of plasmid DNA (1 μg of pCI-neo or mixture of 0.9 μg of pCMV Ouabainr and 0.1 μg of pCI-neo) by using the FuGENE 6 transfection reagent (reagent: DNA ratio 3:1) as described by the manufacturer. Transfectants were selected in the presence of 400 μg/ml geneticin. The resulted cell lines were propagated in complete DMEM supplemented with G418.
Fluorescence Microscopy
Confocal microscopy was performed using an Axiovert 132M inverted microscope equipped with an LSM410 laser-scanning unit and an X40 1.3NA Plan Neofluor or a X100 1.3NA Neofluor Ph3 objective (Carl Zeiss, Jena, Germany). An argon laser at 488 nm was used for fluorescence excitation of green fluorescent protein (GFP) and fluorescein isothiocyanate (FITC). Conventional fluorescence microscopy was performed using an Axiovert 200 microscope fitted with a 63XLD Achroplan 0.75NA Korr Ph2, X63 or a X100 1.3NA Neofluar Ph3 objective (Carl Zeiss). An HBO 100 mercury lamp with a short pass excitation filter was used at 488 nm for FM1-43, GFP, FITC, Cy2, and BODIPY FL, at 530 nm for Cy3 and Alexa Fluor 594, and a long pass filter was used at 630 nm for Alexa Fluor 633 and Cy5. Images were acquired with a cooled SensiCAM charge-coupled device camera and analyzed using the IP Plus 4.1 version (Signal Analytics, San Diego, CA) software. Unlabeled cells were used to determine autofluorescence. The image background was corrected as follows: Two or three regions were selected from cell-free areas in each field and the average intensity of these regions was considered the background value for that field. This value was then subtracted from each pixel in the field. An integrated fluorescence power reading for each image was recorded after background correction. Images were saved in TIFF format and transferred to Adobe Photoshop version 5.5 software for printing.
Immunodetection of Transferrin Receptor, Na+, K+-ATPase α Subunits, and Rab Proteins
Cells were grown on glass coverslips for 24 h and then incubated in media containing various concentrations of CS for 4.5 h. Incubation was terminated by fixing the cells with phosphate-buffered saline (PBS) containing 1.5% glutaraldehyde and 13% sucrose for 15 min at room temperature. After rinsing three times with PBS, the cells were incubated in PBS containing 0.5% Na borohydride for 5 min at room temperature, and washed three times with PBS, once with PBS containing 0.015% saponin, and once with PBS containing 0.015% saponin and 1% ovalbumin. They were then incubated with primary antibody (1:50) at 4°C for 12-36 h, followed by incubation with second antibody (1:300) at room temperature for 2 h. After rinsing with PBS, the plates were examined by fluorescence microscopy.
Whole cell transferrin receptor (TfR) or Na+, K+-ATPase α subunit contents were determined by immunoblotting as described previously (Root et al., 1988). Briefly, cells were grown in 100-mm dishes to 80% confluence and then incubated with CS for 4.5 h. The cells (107) were washed with ice-cold PBS; collected with a rubber policeman; centrifuged for 2 min (5000 × g, 4°C); suspended in 500 μl of lysis buffer containing 25 mM Tris, pH 7.4, 95 mM NaCl, 0.5 mM EDTA, 2% SDS, and 10 μl of protease inhibitor cocktail; and incubated for 10 min at room temperature. Cell lysates were centrifuged for 1 h (16,000 × g, 4°C), and the supernatants were subjected to Western blot. Samples (5 μg of protein) were analyzed by SDS-PAGE by using the Laemmli buffer system and by Western blot as described previously (Root et al., 1988).Transferrin receptor and Na+, K+-ATPase α subunit were probed with the antibodies described above and detected using enhanced chemiluminescence.
Internalization Assays
To visualize endocytic membrane traffic, cells cultured on glass coverslips were incubated in the presence of 5 μg/ml FM1-43, 50 μg/ml transferrin Alexa Fluor, and/or 15 μg/ml BODIPY FL LDL, for 5, 10, and 30 min, respectively. Unbound probe was removed, and the cells were washed twice and reincubated for 4 h at 37°C, in the presence or absence of the tested drugs (bufalin, etoposide, wortmanin, or LY294002). The cells were then either fixed, as described above, and subjected to indirect immunofluorescence analysis or examined by standard live cell imaging (Doctor et al., 2002). Colocalization of fluorescence intensity was quantified using IP Plus 4.5 software. The data obtained from no <600 cells were collected, and the average value ± S.D. is presented. Each experiment was repeated at least three times.
RESULTS
CS-induced Morphological Changes in NT2 Cells
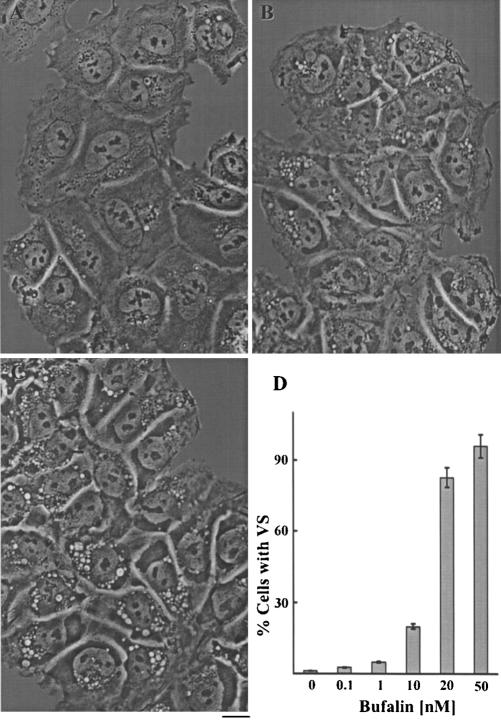
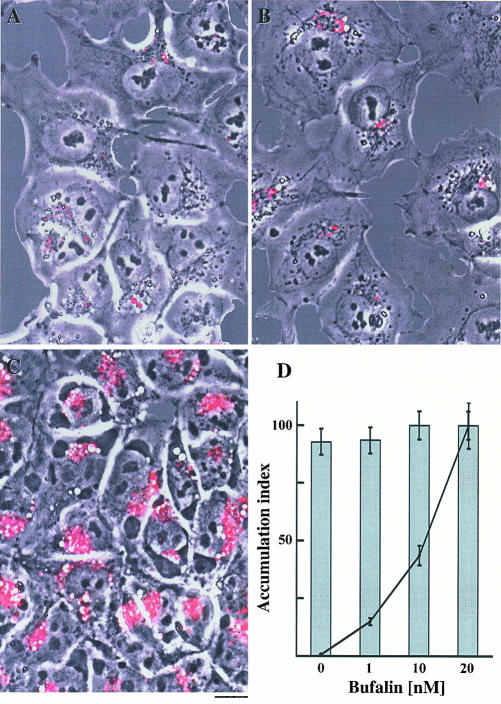
The present study was initiated to investigate mechanisms involved in CS-induced apoptosis in human neuronal precursor cells. While examining these effects, we noticed that the compounds induced the appearance of large vesicles in the cytoplasm, adjacent to the nucleus (Figure 1, A-C). After these structures increased in size and occupied most of the cytoplasm (Figure 1, B and C), the cells began to die and to detach from the plate. The appearance of these bufalin-induced vesicles was dose (Figure 1D) and time (our unpublished data) dependent. Etoposide, an inhibitor of topoisomerase II and a known antitumor agent and inducer of apoptosis in other cells (Hande, 1998), also triggered apoptosis in the NT2 cells (our unpublished data). Importantly, etoposide-induced apoptosis was not preceded or accompanied by the appearance of the large vesicles (Figure 2B). Thus, this accumulation is not a general apoptotic phenomenon, but a specific CS effect.
Figure 1.
Bufalin-induced morphological changes in NT2 cells. NT2 cells were grown in DMEM-F12 medium containing 10% fetal calf serum. Bufalin was added to the medium (final concentration, 20 nM), and images were obtained without staining, 0, 10, and 23 h (A-C, respectively) after introduction of the drug, with the aid of an Olympus CK40 inverted microscope equipped with a 40× Ph2 0.55 NA LWD CD plane 40 FPL objective. Bar, 10 μm. The percentage of cells containing vesicles as a function of bufalin concentration after 24-h treatment is shown (D). The analysis was based on at least 800 cells for each point. Each experiment was repeated three times.
Figure 2.
Bufalin-induced translocation of cell surface fluorescence labeling into large perinuclear vesicles in NT2 cells. NT2 cells were grown in DMEM-F12 on glass coverslips for 24 h. The DMEM-F12 was then replaced with drug-free medium (A), or medium containing 15 μM etoposide (B) or 20 nM bufalin (C). After 20-min incubation, the medium was removed and the cells were incubated for 5 min in PBS containing FM1-43. The reagent was then removed; the cells were washed twice with PBS and incubated for an additional 4 h in the presence of the drugs mentioned above. All these procedures were carried out at 37°C in 5% CO2. Images were obtained and analyzed, as described in MATERIALS AND METHODS, and the fluorescence intensity/cell (solid line) and the percentage of fluorescent cells (bars) was calculated. The data obtained from 800 to 1200 cells were collected, and the average value ± SD was plotted (D). Bar, 10 μm.
CS-induced Vesicles Are of Endosomal Origin
The basic nature of the bufalin-induced vesicles was first explored using the cell surface probe FM1-43. This fluorogenic styryl dye reversibly stains membranes in relation to their activity and is an ideal probe for the study of endo- and exocytosis (Cochilla et al., 1999; Kawasaki et al., 2000). NT2 cells were incubated with bufalin for 25 min and then FM1-43 was added for 5 min. The cells were subsequently washed with medium containing bufalin and incubated with dye-free medium containing bufalin for an additional 4 h. It is well established that during the repetitive recycling of the plasma membrane, FM1-43 is washed out from the cells with a t1/2 of 2-10 min, and the residual fluorescence signal represents a steady state between endo- and exocytosis (Hao and Maxfield, 2000). In agreement with the above-mentioned information, the internalized FM1-43 was recycled in NT2 cells with a t1/2 of 2 min (our unpublished data). Surprisingly, after exposure of the cells to bufalin for 4 h (Figure 2C), the dye was translocated and accumulated in locations corresponding to the vesicles. The relative fluorescence intensity was 20-fold stronger in the bufalin-treated cells (Figure 2C) than in the control or etoposide-treated cells (Figure 2, A and B). In the short-term experiments, in which fluorescence was monitored immediately after washing out the unbound dye, the intensity of the fluorescence signal was not affected by bufalin (our unpublished data). In addition, the CS-induced accumulation of FM1-43 was reversible. When bufalin was washed out from the medium, up to 2.5 h after FM1-43 labeling, no accumulation of the dye was observed (our unpublished data). These results suggest that extrusion of the dye was inhibited in the bufalin-treated cells and that the bufalin-induced vesicles contain components from the cell plasma membrane. The effect of bufalin on FM1-43 accumulation was dose dependent and apparent at 0.5 nM bufalin (Figure 2D). Importantly, >90% of cells underwent bufalin-induced FM1-43 accumulation, and this percentage was virtually independent of bufalin concentration (Figure 3D). Thus, the augmented number of stained membranes per microscopic field, after raising the bufalin concentration, was apparently due to enhanced accumulation of membrane per cell and not to a larger number of stained cells. We observed similar changes in membrane traffic by using other CSs (digoxin, digoxigenin, and proscilaridin A) and in other human cell lines such as astrocytoma SF676, neuroblastoma TE671, and kidney epithelium 293T (our unpublished data). To the best of our knowledge, these CS-induced changes in membrane traffic and vesicle formation have not been described previously. This is particularly surprising in view of the fact that cells were routinely treated with CS in numerous studies to inhibit Na+, K+-ATPase activity.
Figure 3.
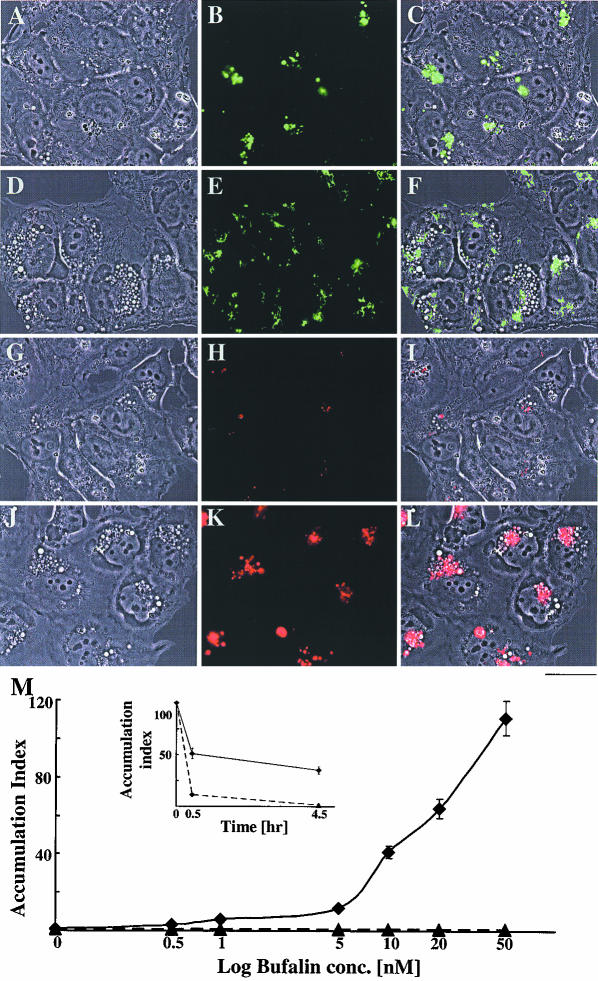
Bufalin-induced accumulation of transferrin in perinuclear vesicles in NT2 cells. NT2 cells were grown in DMEM-F12 on glass coverslips for 24 h. The DMEM-F12 was then replaced with drug-free medium (A-C, G-I) or medium containing 20 nM bufalin (D-F, J-L). After 20-min incubation, the medium was removed, and the cells were incubated in medium containing BODYPY FL LDL (A-F) or transferrin Alexa Fluor (G-L) as described in MATERIALS AND METHODS. After 4-h incubation the cells were observed under a fluorescence microscope. The phase contrast images (A, D, G, and J), the fluorescent images (B, E, H, and K), and the merged images of the two (C, F, I, and L) are shown. The green color corresponds to LDL signals (B, C, E, and F) and the red to transferrin signals (H, I, K, and L). Bar, 20 μm. The fluorescence intensity of transferrin per cell was calculated (M). The accumulation index was defined as the ratio between the fluorescence intensity per cell in bufalin-treated cells and the fluorescence intensity per cell in control cells. Inset, accumulation index of transferrin as a function of time in the presence (solid line) or absence (dashed line) of 20 nM bufalin.
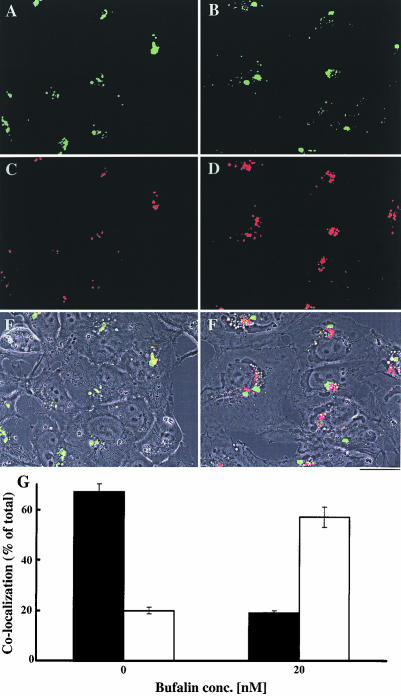
To further explore the nature of the CS-induced changes in membrane traffic, we used fluorescent conjugates of LDL, transferrin, and ERTracker, specific probes for lysosomes, endosomes, and the endoplasmic reticulum (ER)-Golgi, respectively. Because CS induction of vesicle formation was apparent after 4 h of incubation, analysis of the various fluorescent probes was performed 4 h after staining. The effect of bufalin on the accumulation and localization of LDL and transferrin fluorescent probes in NT2 cells is shown in Figure 3. Bufalin did not significantly affect the intensity and the localization of the LDL signals (Figure 3, A-F), nor the accumulation of the ERTracker probe (our unpublished data). These observations indicate that the bufalin-induced changes in membrane traffic are not occurring at the lysosomes, ER, and the Golgi apparatus. On the contrary, bufalin induced a pronounced accumulation of transferrin in the perinuclear region, in the vicinity to the formed vesicles (Figure 3, G-L). Quantitative analysis of the fluorescence signal per cell (Figure 3M) revealed that transferrin accumulation is dependent on bufalin concentration. The effect was already apparent at 1 nM bufalin, resulting in a 2.5-fold increase in transferrin accumulation, and augmented 100-fold at 50 nM. Notably, the bufalin-induced accumulation represents a significant fraction of the transferrin that was initially bound to the cell surface (Figure 3M, inset). This indicates that bufalin affects a major route of transferrin translocation/recycling in the NT2 cell. Similar results were obtained using digoxin (our unpublished data). In a second set of experiments, colocalization of LDL and transferrin signals was determined (Figure 4). In the control cells, ∼70% of the fluorescence signals of transferrin were colocalized with the LDL probe signals, and ∼20% occurred as separate signals (Figure 4, A, C, E, and G). In contrast, in bufalin- treated cells <20% of the transferrin signals were colocalized with LDL, and >60% occurred as separate signals (Figure 4, B, D, F, and G). Similar results were obtained using the cardenolide digoxin (our unpublished data). These results support the notion that CSs affect transferrin translocation/recycling within the endosomal compartment.
Figure 4.
Most of the transferrin accumulated in bufalin-treated cells is not associated with LDL. The effect of bufalin on the colocalization of transferrin and LDL was determined as described in Figure 4, except that the two ligands were added simultaneously. The control cells are shown in A, C, and E, and the bufalin-treated cells are shown in B, D, and F. The green color (A and B) corresponds to LDL signals, the red (C and E) to transferrin signals, and the yellow (E and F) represents colocalization of the two. Images A-D depict fluorescence signals, and E and F are merged images of phase contrast and the two fluorescence signals. Bar, 20 μm. Colocalization of transferrin with LDL (G) was quantified by measuring the areas occupied by the yellow color (E and F) and calculated as the ratio between the areas of the yellow and the red signals (C and D). The fraction of transferrin colocalized with LDL (solid bars) and dissociated from LDL (white bars) in the control and in the 20 nM bufalin-treated cells is shown.
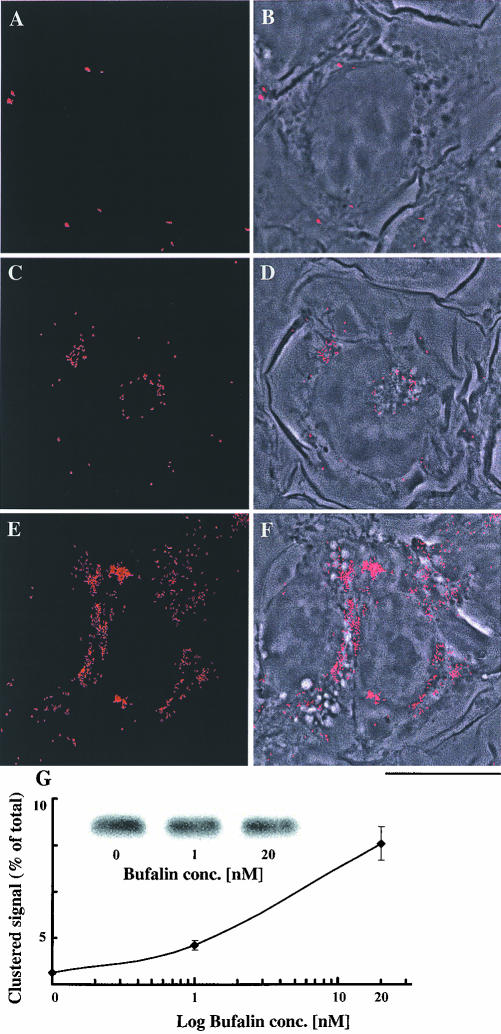
Cell uptake of transferrin is a well-established receptormediated process. After uptake, both transferrin and most of its receptor are recycled to the plasma membrane (Lok and Loh, 1998). Thus, complementary results should be obtained by monitoring the distribution of TfR, after bufalin treatment. TfR localization in NT2 cells was followed by immunocytochemistry with specific monoclonal anti-TfR antibodies (Figure 5). By using conventional fluorescence microscopy, the TfR signals in the control cells seemed to be diffused and evenly distributed throughout the cell. After treatment with bufalin, pronounced clustering of TfR was seen, representing ∼10% of the total TfR signal in the cell (our unpublished data). For a clearer demonstration of the bufalin-induced clusters, the diffused signals were subtracted in the data analysis of the images depicted in Figure 5. The control cells showed a minute number of TfR clusters (Figure 5, A and B). After treatment with 1 or 20 nM bufalin, the number of clusters increased up to 4- or 10-fold that of the control signals, respectively (Figure 5, C-F, and G). Clearly, the majority of the bufalin-induced TfR clusters were colocalized with the large vesicles. Total TfR in the cells was determined by Western blot (Figure 5G, inset). There was no significant difference in band intensity between the control and the bufalin-treated cells. Thus, the bufalin-induced TfR clustering is not due to an overall increase in the amount of cellular TfR.
Figure 5.
Bufalin-induced perinuclear clustering of transferrin receptor in NT2 cells. NT2 cells were grown in DMEM-F12 on glass coverslips for 24 h. The DMEM-F12 was then replaced with medium with (C-F) or without (A and B) bufalin for 4.5 h. The cells were fixed and stained with anti-transferrin receptor monoclonal antibodies, and images were acquired by fluorescence microscopy (A, C, and E) as described in MATERIALS AND METHODS. The merged phase contrast and fluorescence images are depicted in B, D, and F. Bar, 10 μm. Quantification of the distribution of the transferrin receptor is shown in G. For this purpose, the average fluorescence intensity of the clustered area of a cell was divided by the average fluorescence intensity of the entire cell and multiplied by 100, yielding the percentage of clustered receptors. The points on the graph (average value ± SD) were derived by analyzing 70-100 cells per point. The experiments were repeated three times. Total cellular transferrin receptor (G) was assessed by Western blot and quantified by densitometry.
CS Inhibits the Recycling of Transferrin in the Late Endocytic Pathway
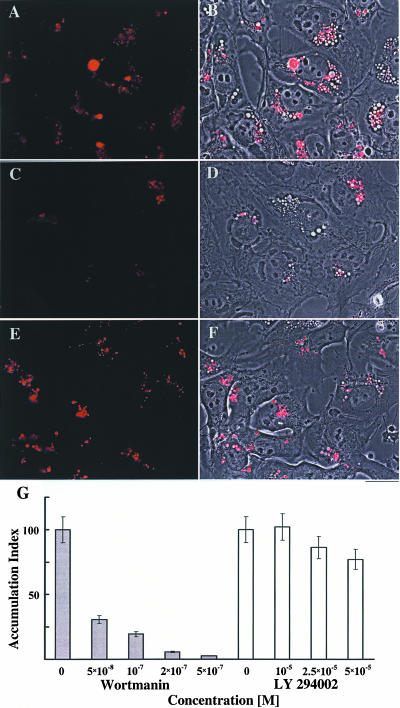
In an effort to determine the endosomal compartment affected by CS, we used reagents known to regulate endocytic pathways and to induce vesicle formation. These reagents were used in combination with immunocytochemical methods for determining colocalization of transferrin with various Rab proteins. Wortmanin and LY294002, specific inhibitors of phosphatidyl inositol 3-kinase, alter endocytosis, induce the enlargement of early endosomes, and disrupt perinuclear endosomes (Spiro et al., 1996; Chen and Wang, 2001). We examined the influence of these two inhibitors at concentrations known to affect the above-mentioned processes, on bufalin-induced transferrin accumulation in NT2 cells (Figure 6). Whereas wortmanin inhibited the bufalin-induced accumulation of transferrin (Figure 6, C, D, and G), the effect of LY294002 was only marginal (Figure 6, E-G). Recently, it was reported that wortmanin, but not LY294002, affects endocytosis through activation of Rab5 rather than by inhibition of phosphatidyl inositol 3-kinase per se (Chen and Wang, 2001). Thus, the specific inhibition of the CS-induced changes in membrane traffic by wortmanin indicates that the bufalin effect depends on the regular function of Rab5 and is downstream from the early endosomes.
Figure 6.
Bufalin-induced accumulation of transferrin in perinuclear vesicles of NT2 cells is specifically inhibited by wortmanin. NT2 cells were grown in DMEM-F12 on glass coverslips for 24 h. The DMEM-F12 was then replaced with medium containing 20 nM bufalin (A-F) and 100 nM wortmanin (C and D) or 50 μM LY294002 (E and F). After 20-min incubation, the medium was removed, and the cells were incubated in medium containing transferrin Alexa Fluor as described in MATERIALS AND METHODS. After 4 h of incubation, the cells were subjected to fluorescence microscopy. The fluorescent images (A, C, and E) and the merged phase contrast images and fluorescence images (B, D, and F) are shown. The red color corresponds to transferrin signals. Bar, 20 μm. Fluorescence intensity of transferrin per cell was calculated as described in Figure 4. The dependence of transferrin accumulation on wortmanin and LY294002 concentration is shown (G).
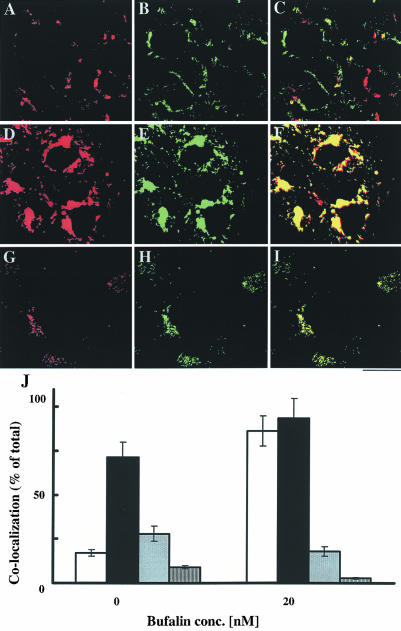
The endosomal compartments involved in the CS effect were explored using immunocytochemistry and by determination of the colocalization of transferrin with Rab4, Rab5, Rab7, and Rab11 (Figure 7). In the control cells, <20% of the transferrin fluorescence (Figure 7A) colocalized with anti-Rab11-specific signals (Figure 7, B, C, and J). In the bufalin-treated cells (Figure 7, D-F, and J), the colocalization exceeded 90% of the transferrin-specific signals. Similar colocalization was detected using confocal microscopy (Figure 7, G-I). Quantification of Rab4, Rab5, and Rab7 in similar experiments is depicted in Figure 7J. Bufalin treatment dramatically increased the colocalization of transferrin with Rab11 and Rab7 to >90%, whereas its colocalization with Rab4 and Rab5 was significantly reduced. It is noteworthy that wortmanin produced the opposite effect, i.e., increased colocalization of transferrin with Rab5 and sharply decreased its colocalization with Rab7 and Rab11 (our unpublished data). These results show that CS-induced transferrin accumulation occurs mainly in an endosomal compartment, downstream from the early endosome, characterized by the presence of Rab7 and Rab11 proteins.
Figure 7.
Most of the transferrin that accumulates in bufalin-treated cells is associated with Rab11 and Rab7 proteins. Rab proteins and transferrin were detected as described in MATERIALS AND METHODS. The effect of bufalin on the colocalization of transferrin and Rab signals, and their quantification, were determined as described in Figure 5. Results obtained from the control cells (A-C) and from the bufalin-treated cells (D-I) are shown. The red color corresponds to the transferrin signals (A, D, and G), the green color to Rab11 signals (B, E, and H), and the yellow color corresponds to the merged images (C, F, and I). Images A-F were obtained by conventional fluorescence microscopy, whereas images G-I were acquired by confocal microscopy (0.4-μm sections). Bar, 20 μm. Quantification of the colocalization of transferrin with Rab4 (gray bars), Rab5 (dashed bars), Rab7 (solid bars), and Rab11 (white bars) is depicted in J.
Transfection of Human NT2 Cells with Rat Na+, K+-ATPase α1 Subunit Markedly Reduced the CS-induced Changes in Membrane Traffic
The α subunit of the Na+, K+-ATPase is the established binding site for CSs (Kelly and Smith, 1996; Blanco and Mercer, 1998). Thus, we hypothesized that the CS-induced changes in membrane traffic are mediated by this enzyme. To test this hypothesis, we took advantage of the very low affinity of CSs to the rat Na+, K+-ATPase α1 subunit, compared with the human isoform (Lingrel, 1992; Blanco and Mercer, 1998). NT2 cell were cotransfected with pCMV Ouabainr and pCI-neo vectors and subsequently selected with G418. The effects of 10 nM bufalin on transferrin and FM1-43 accumulations were measured in pools of pCMV Ouabainr - and pCI-neo-transfected cells (Figure 8). The levels of FM1-43 and transferrin accumulation under control conditions (without bufalin treatment) were similar (our unpublished data). The CS-induced accumulation of transferrin and FM1-43 in the pCI-neo-transfected cells was similar to that observed in previous experiments with wild-type cells (Figures 2 and 3). On the contrary, in the pCMV Ouabainr-transfected cells, the CS-induced transferrin accumulation was reduced by 90% (Figure 8A) and that of FM1-43 by 98% (Figure 8A), compared with the effects in the wild-type cells. These results support the involvement of the Na+, K+-ATPase in the CS-induced changes in endocytic membrane traffic.
Figure 8.
Effect of bufalin on membrane traffic requires high-affinity binding site for CS. Cells were transfected with pCI-neo (dashed bars) or with rat α1 Na+, K+-ATPase cDNA and pCI-neo (solid bars) as described in MATERIALS AND METHODS. The effects of bufalin (10 nM) on transferrin (A) and FM1-43 (B) accumulations were measured in pools of cells, as described in the legends to Figures 2 and 3. The experiments were repeated three times each on different pools of cells.
CS-Induced Changes in Na+, K+-ATPase α Subunits Distribution in NT2 Cells
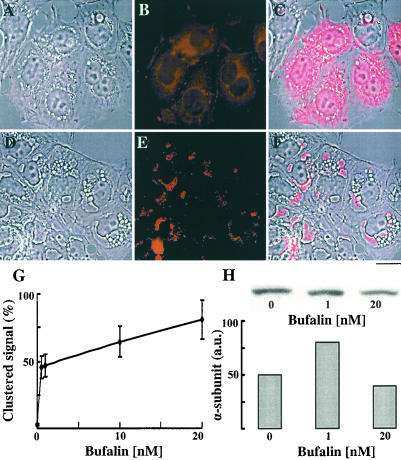
Our observation on CS-induced changes in endocytic traffic and the involvement of the Na+, K+-ATPase in this process raises the possibility that the cellular distribution of this enzyme may also be affected by CS treatment. To address this question, we tested the effects of CS on the cellular distribution of the Na+, K+-ATPase by using immunocytochemistry with monoclonal anti-human α subunits antibodies. Under control conditions (Figure 9, A-C), the fluorescent signals of the α subunits in NT2 cells are diffused all over the cytoplasm, with more concentrated regions surrounding the nucleus, and the plasma membrane junctions between the cells. After bufalin treatment (20 nM, 4.5 h; Figure 9, D-F), the α subunits are markedly clustered in particular areas in the cytoplasm with a significant reduction of the diffused signals in the cytoplasm and the signals in plasma membrane cell junctions. The merged images of the fluorescent signal and the phase images (Figure 9, C and F) show that upon bufalin treatment the signals of the α subunits have been clustered to defined structures adjacent to the nucleus, partially corresponding to the CS-induced vesicles. Semiquantification of this bufalin effect reveals that the fraction of the clustered α subunits is increased by >50-fold, compared with the control conditions (Figure 9G). Importantly, the effect of bufalin-induced clustering of the Na+, K+-ATPase α subunits is dose dependent and was observed already at 1 nM. At 20 nM, >80% of the cellular α subunits of the Na+, K+-ATPase are localized within the clusters. Western blot analyses (Figure 9H) showed that the CS-induced changes in the distribution of the α subunits of the Na+, K+-ATPase cannot be attributed to an overall change in the total content of the α subunits.
Figure 9.
Bufalin-induced changes in cellular distribution of Na+, K+-ATPase α subunits in NT2 cells. NT2 cells were grown on glass coverslips for 24 h. The DMEM-F12 was then replaced with medium with (D-F) or without (A-C) 20 nM bufalin for 4.5 h. The cells were fixed and stained with anti Na+, K+-ATPase α subunits monoclonal antibodies, and images were acquired by fluorescence microscopy (B and E) were obtained as described in MATERIALS AND METHODS. The merge of the phase contrast and fluorescence is depicted in C and F. Bar, 10 μm. Quantification of the distribution of the Na+, K+-ATPase α subunits was performed as described in the legend to Figure 5 and is shown in G. The total cellular Na+, K+-ATPase α subunits (H) were assessed by Western blot analysis and quantified by densitometry.
DISCUSSION
In the present study, we show for the first time that low concentrations of CSs, independently of their ability to induce apoptosis, induce pronounced changes in intracellular membrane traffic, manifested by the appearance of large vesicles in the perinuclear region of the cells. Furthermore, CSs caused the specific accumulation of transferrin in these vesicles. The transferrin-containing vesicles were identified as Rab7- and Rab11-positive, late endocytic compartment. Interestingly, the CS-induced changes in membrane traffic seem to be mediated by their interaction with the Na+, K+-ATPase.
The formation of large vesicles in mammalian cells is generally seen as an adaptive physiological response to stress. When this fails, cells usually die by apoptosis or lytic processes (Henics and Wheatley, 1999). In our experiments, all the cells in which the accumulation of large vesicles was observed eventually underwent apoptosis. The CS-induced changes in membrane traffic did not per se necessarily lead to apoptosis (see below). However, in all cases where CS-induced apoptosis occurred, it was preceded by the massive intracellular accumulation of membranes and large vesicles.
We also observed CS-induced changes in membrane traffic in other human cell lines such as astrocytoma SF676, neuroblastoma TE671 neuroblastoma, and kidney epithelium 293T (our unpublished data). Hence, we may conclude that this effect is a general phenomenon, at least in human cells. Because etoposide-induced apoptosis is not associated with the appearance of large vesicles and changes in membrane traffic (Figure 2), it is conceivable that the CS-induced changes are not a universal apoptosis-related phenomenon. Moreover, already at 1 nM bufalin, >90% of the cells exhibited changes in membrane traffic, as reflected by the intracellular accumulation of FM1-43 (Figure 2D). On the other hand, under these conditions large vesicles and apoptosis were observed in <10% of the cells (our unpublished data), and the remaining 90% continued to grow normally. The finding that the majority of the cells exhibited changes in membrane traffic without undergoing apoptosis leads us to conjecture that the CS effect on membrane translocation does not necessarily lead to programmed cell death. At higher CS concentrations, when the effects on membrane traffic and on the assembly of large vesicles were massive, apoptosis did occur. The effect of CS on membrane translocation, which to the best of our knowledge has not been described previously, is distinct from its effect on apoptosis.
Extensive research has been devoted to the description of intracellular membrane traffic, which plays an essential role in cell function. Lipids and other membrane constituents rapidly recycle (t1/2 of 2-10 min.) between the plasma membrane and intracellular endocytic compartments (Hao and Maxfield, 2000). This endocytosis-mediated process is crucial for the maintenance of receptors, transporters, pumps, and channels at the plasma membrane (Slepnev and De Camilli, 2000). The internalization of extracellular components is the primarily function of endocytic pathways that participate in diverse signal transduction mechanisms (Dorn and Mochly-Rosen, 2002). After internalization of extracellular components by the clathrin-coated vesicles, receptor-ligand complexes, membrane proteins, and lipids are delivered to early endosomes in the peripheral cytoplasm. The early endosomes are multifunctional organelles that regulate membrane-constituent transport between the plasma membrane and various intracellular compartments. Cargo proteins in the early endosomes are sorted for delivery via three pathways: a “fast” recycling pathway to the cell surface; a “slow” recycling pathway through perinuclear recycling endosomes and the trans-Golgi network; and a pathway to the lysosome via the late endosome (Mellman, 1996; Gruenberg, 2001; Conner and Schmid, 2003). Recently, it was established that members of the Rab family of small GT-Pases, are localized in distinct membrane subsets and contribute to the functional organization of the endocytic subcompartments (Rodman and Wandlinger-Ness, 2000; Zerial and McBride, 2001; De Renzis et al., 2002). For example, Rab5 is localized in the early endosome and is essential to the delivery of material from the plasma membrane, via the clathrin-coated vesicles, to the early endosome, whereas Rab4 and Rab11 are implicated in the fast and slow recycling pathways, respectively (Sonnichsen et al., 2000). Rab 7 is associated with the late endosome and is required for transport from early to late endosomes and to the lysosomes (Bucci et al., 2000). In light of this description, we can interpret the colocalization results of this study (Figures 3, 4, and 7) as follows: First, in the control cells, most of the internalized transferrin was recycled and extruded from the cell. However, 4 h after internalization, ∼1% of the internalized transferrin was still retained in the cell (Figure 3M). Most of it was associated with LDL and Rab 7, whereas it was dissociated from Rab5, Rab 4, and Rab11 (Figures 4 and 7). These results clearly indicate that in the control cells, the residual transferrin is localized within the late endocytic pathway, most likely in the prelysosome/lysosome compartment. Second, in CS-treated cells, 4 h after internalization, a large portion of the transferrin and FM1-43 remained in the cells and was accumulated in perinuclear vesicles. Most of this transferrin was dissociated from LDL and colocalized with Rab7 and Rab11 (Figures 4 and 7). Importantly, the colocalization of transferrin with Rab4, Rab5, and the Rab5 effector-protein (EEA1) was significantly reduced. These results strongly support the notion that in the presence of CS, transferrin is sorted for recycling and accumulated on its way to or within the perinuclear recycling endosomes.
We have shown here that stable transfection of rat α1 Na+, K+-ATPase cDNA, which has a very low affinity for CSs, into human NT2 cells markedly reduced the effect of CSs at nanomolar concentrations on membrane traffic (Figure 8). This “loss of function” provides genetic evidence that the Na+, K+-ATPase mediates the effects of CS. Furthermore, the treatment of NT2 cells with CS induced not only changes in transferrin receptor distribution but also the clustering of the Na+, K+-ATPase α subunits in the perinuclear region (Figure 9). Thus, it is tempting to propose that the inhibition of Na+, K+-ATPase activity, at either the plasma membrane or intracellular compartment, is involved in the observed phenomena. In fact, a similar hypothesis, suggesting a possible role for Na+, K+-ATPase activity in regulating ATP-dependent endosome function, was set forth on the basis of in vitro studies on the transport properties and ions permeability of early and late endosomes (Fuchs et al., 1989). To further explore this hypothesis, we are currently investigating the involvement of Na+, K+-ATPase activity in the endocytic-mediated recycling of plasma membrane.
Many studies have shown the presence of CS and CS-like compounds in human tissues (Goto and Yamada, 1998; Lichtstein and Rosen, 2001; Schoner, 2002). Furthermore, several groups have demonstrated that these compounds, like other steroids, are synthesized in and released from the adrenal gland (Li et al., 1998; Lichtstein et al., 1998; Shah et al., 1998). Thus, it has been proposed that these molecules are hormones that play a role in the regulation of ion and water homeostasis and blood pressure by affecting cardiac and renal functions, as well as vascular tone (Hamlyn et al., 1996; Aizman et al., 2001; Schoner, 2002). The effects of CS on membrane traffic that we now present are in the low nanomolar range, similar to the plasma level of these hormones (Hamlyn et al., 1996; Goto and Yamada, 1998; Schoner, 2002). Thus, we suggest that endogenous CS-like compounds are involved in the physiological regulation of recycling of endocytosed membrane proteins and cargo.
Acknowledgments
This work was supported by Clotid Oppenheimer Fund and by Avraham Fein Fund (to H.R. and D.L.).
Article published online ahead of print. Mol. Biol. Cell 10.1091/mbc.E03-06-0391. Article and publication date are available at www.molbiolcell.org/cgi/doi/10.1091/mbc.E03-06-0391.
Abbreviations used: CS, cardiac steroid; FM1-43, N-(3-triethylammonium propyl)-4-(dibutilamino)styryl-pyrodinum dibromide; LDL, low-density lipoproteins; TfR, transferrin receptor.
References
- Aizman, O., Uhlen, P., Lal, M., Brismar, H., and Aperia, A. (2001). Ouabain, a steroid hormone that signals with slow calcium oscillations. Proc. Natl. Acad. Sci. USA 98, 13420-13424. [DOI] [PMC free article] [PubMed] [Google Scholar]
- Bagrov, A.Y., Fedorova, O.V., Austin-Lane, J.L., Dmitrieva, R.I., and Anderson, D.E. (1995). Endogenous Marinobufagenin-like immunoreactive factor and Na+, K+-ATPase inhibition during voluntary hypoventilation. Hypertension 26, 781-788. [DOI] [PubMed] [Google Scholar]
- Blanco, G., and Mercer, R.W. (1998). Isozymes of the Na-K-ATPase: heterogeneity in structure, diversity in function Am. J. Physiol. 275, F633-F650. [DOI] [PubMed] [Google Scholar]
- Bucci, C., Thomsen, P., Nicoziani, P., McCarthy, J., and van Deurs, B. (2000). Rab 7, A key to lysosomes biogenesis. Mol. Biol. Cell 11, 467-480. [DOI] [PMC free article] [PubMed] [Google Scholar]
- Chen, X., and Wang, Z. (2001). Regulation of epidermal growth factor receptor endocytosis by wortmanin through activation of Rab5 rather than inhibition of phosphatidylinositol 3-kinase. EMBO Rep. 21, 842-849. [DOI] [PMC free article] [PubMed] [Google Scholar]
- Cochilla, A.J., Angleson, J.K., and Betz, W.J. (1999). Monitoring secretory membrane with FM1-43 fluorescence. Annu. Rev. Neurosci. 22, 1-10. [DOI] [PubMed] [Google Scholar]
- Conner, S.D., and Schmid, S.L. (2003). Regulated portals of entry into the cell. Nature 422, 37-44. [DOI] [PubMed] [Google Scholar]
- De Renzis, S., Sonnichsen, B., and Zerial, M. (2002). Divalent Rab effectors regulate the sub-compartmental organization and sorting of early endosomes. Nat. Cell Biol. 4, 124-133. [DOI] [PubMed] [Google Scholar]
- Doctor, R.B., Dahl, R., Fouassier, L., Kilic, G., and Fitz, J.G. (2002). Cholangiocytes exhibit dynamic, actin-dependent apical membrane turnover. Am. J. Physiol. 282, C1042-C1052. [DOI] [PubMed] [Google Scholar]
- Dorn, G. W. 2nd, and Mochly-Rosen, D. (2002). Intracellular transport mechanisms of signal transducers. Annu. Rev. Physiol. 64, 407-429. [DOI] [PubMed] [Google Scholar]
- Fuchs, R., Schmid, S., and Mellman, I. (1989). A possible role for Na+, K+-ATPase in regulating ATP-dependent endosome acidification. Proc. Natl. Acad. Sci. USA 86, 539-543. [DOI] [PMC free article] [PubMed] [Google Scholar]
- Goto, A., Ishiguro, T., Yamada, K., Ishii, M., Yoshioka, M., Eguchi, C., Shimura, M., and Sugimoto, T. (1990). Isolation of a urinary digitalis-like factor indistinguishable from digoxin. Biochem. Biophys. Res. Commun. 173, 1093-1101. [DOI] [PubMed] [Google Scholar]
- Goto, A., and Yamada, K. (1998). Ouabain-like factor. Curr. Opin. Nephrol. Hypertens. 7, 189-196. [DOI] [PubMed] [Google Scholar]
- Gruenberg, J. (2001). The endocytic pathway: a mosaic of domains. Nat. Rev. Mol. Cell. Biol. 2, 721-730. [DOI] [PubMed] [Google Scholar]
- Hamlyn, J.M., Blaustein, M.P., Bova, S., DuCharme, D.W., Harris, D.W., Mandel, F., Mathews, M.R., and Ludens, J.H. (1991). Identification and characterization of ouabain-like compound from human plasma. Proc. Natl. Acad. Sci. USA 88, 6259-6263. [DOI] [PMC free article] [PubMed] [Google Scholar]
- Hamlyn, J.M., Hamilton, B.P., and Manunta, P. (1996). Endogenous ouabain, sodium balance and blood pressure: a review and a hypothesis. J. Hypertens. 14, 151-167. [DOI] [PubMed] [Google Scholar]
- Hande, K.R. (1998). Etoposide: four decades of development of a topoisomerase II inhibitor. Eur. J. Cancer. 34, 1514-1521. [DOI] [PubMed] [Google Scholar]
- Hao, M., and Maxfield, F.R. (2000). Characterization of rapid membrane internalization and recycling. J. Biol. Chem. 275, 15279-15286. [DOI] [PubMed] [Google Scholar]
- Henics, T., and Wheatley, N.D. (1999). Cytoplasmic vacuolation, adaptation and cell death: a view on new perspectives and features. Biol. Cell 91, 485-498. [DOI] [PubMed] [Google Scholar]
- Hilton, P.J., White, R.W., Lord, G.A., Garner, G.V., Gordon, D.B., Hilton, M.J., and Forni, L.G. (1996). An inhibitor of the sodium pump obtained from human placenta. Lancet 348, 303-305. [DOI] [PubMed] [Google Scholar]
- Kawasaki, Y., Saito, T., Shirota-Someya, Y., Ikegami, Y., Komano, H., Lee, M.H., Froelich, C.J., Shinohara, N., and Takayama, H. (2000). Cell deathassociated translocation of plasma membrane components induced by CTL. J. Immunol. 164, 4641-4648. [DOI] [PubMed] [Google Scholar]
- Kelly, R.A., and Smith, T.W. (1996). Pharmacological treatment of heart failure. In: Goodman and Gilman's The Pharmacological Basis of Therapeutics, 9th ed., ed. J.G. Herdamn and L.E. Limbird, New York: McGraw-Hill Companies, 809-838.
- Li, S., Eim, C., Kirch, U., Lang, R.E., and Schoner, W. (1998). Bovine adrenals and hypothalamus are a major source of proscillaridin A- and ouabainimmunoreactivities. Life Sci. 62, 1023-1033. [DOI] [PubMed] [Google Scholar]
- Lichtstein, D., Gati, I., Samuelov, S., Berson, D., Rozenman, Y., Landau, L., and Deutsch, J. (1993). Identification of digitalis-like compounds in human cataractous lenses. Eur. J. Biochem. 216, 261-268. [DOI] [PubMed] [Google Scholar]
- Lichtstein, D., and Rosen, H. (2001). Endogenous digitalis-like Na+, K+-ATPase inhibitors, and brain function. Neurochem. Res. 26, 971-978. [DOI] [PubMed] [Google Scholar]
- Lichtstein, D., Steinitz, M., Gati, I., Samuelov, S., Deutsch, J., and Orly, J. (1998). Biosynthesis of digitalis-like compounds in rat adrenal cells: hydroxycholesterol as possible precursor. Life Sci. 62, 2109-2126. [DOI] [PubMed] [Google Scholar]
- Lingrel, J.B. (1992). Na, K-ATPase: isoform structure, function, and expression. J. Bioenerg. Biomembr. 24, 263-270. [DOI] [PubMed] [Google Scholar]
- Lok, C.N., and Loh, T.T. (1998). Regulation of transferrin function and expression: review and update. Biol. Signals Recept. 7, 157-178. [DOI] [PubMed] [Google Scholar]
- Mellman, I. (1996). Endocytosis and molecular sorting. Annu. Rev. Cell Dev. Biol. 12, 575-625. [DOI] [PubMed] [Google Scholar]
- Mobasheri, A., Avila, J., Cozar-Castellano, I., Brownleader, M.D., Trevan, M., Francis, M.J., Lamb, J.F., and Martin-Vasallo, P. (2000). Na+, K+-ATPase isozyme diversity; comparative biochemistry and physiological implications of novel functional interactions. Biosci. Rep. 20, 51-91. [DOI] [PubMed] [Google Scholar]
- Numazawa, S., Shinoki, M.A., Ito, H., Yoshida, T., and Kuroiwa, Y. (1994). Involvement of Na+, K+-ATPase inhibition in K562 cell differentiation induced by bufalin. J. Cell. Physiol. 160, 113-120. [DOI] [PubMed] [Google Scholar]
- Pleasure, S.J., Page, C., and Lee, V.M.Y. (1992). Pure, postmitotic, polarized human neurons derived from NTera 2 cells provide a system for expressing exogenous proteins in terminally differentiated neurons. J. Neurosci., 12, 1802-1815. [DOI] [PMC free article] [PubMed] [Google Scholar]
- Rodman, J.S., and Wandlinger-Ness, A. (2000). Rab GTPases coordinate endocytosis. J. Cell Sci. 113, 183-192. [DOI] [PubMed] [Google Scholar]
- Root, B.J., Reckhow, C.L., Clinton, E.M., and Enns, C.A. (1988). Characterization of proteins that associate with an unglycosylated form of the transferrin receptor in A431 cells. J. Biol. Chem. 263, 19071-19076. [PubMed] [Google Scholar]
- Scheiner-Bobis, G. (2002). The sodium pump, its molecular properties and mechanics of ion transport. Eur. J. Biochem. 269, 2424-2433. [DOI] [PubMed] [Google Scholar]
- Schoner, W. (2002). Endogenous cardiac glycosides, a new class of steroid hormones. Eur. J. Biochem. 269, 2440-2448. [DOI] [PubMed] [Google Scholar]
- Shah, J.R., Laredo, J., Hamilton, B.P., and Hamlyn, J.M. (1998). Different signaling pathways mediate stimulated secretion of endogenous ouabain and aldosterone from bovine adrenocortical cells. Hypertension 31, 463-468. [DOI] [PubMed] [Google Scholar]
- Sich, B., Kirch, U., Tepel, M., Zidek, W., and Schoner, W. (1996). Pulse pressure correlates in humans with a proscillaridin A immunoreactive compound. Hypertension 27, 1073-1078. [DOI] [PubMed] [Google Scholar]
- Slepnev, V.I., and De Camilli, P. (2000). Accessory factors in clathrin-dependent synaptic vesicle endocytosis. Nat. Rev. Neurosci. 1, 161-172. [DOI] [PubMed] [Google Scholar]
- Sonnichsen, B., De Renzis, S., Nielsen, E., Reitdorf, J., and Zerial, M. (2000). Distinct membrane domains on endosomes in the recycling pathway visualized by multicolor imaging of Rab4, Rab5, and Rab11. J. Cell Biol. 149, 901-913. [DOI] [PMC free article] [PubMed] [Google Scholar]
- Spiro, D.J., Boll, W., Kirchhausen, T., and Wessling-Resnick, M. (1996). Wortmannin alters the transferrin receptor endocytic pathway in vivo and in vitro. Mol. Biol. Cell 7, 355-367. [DOI] [PMC free article] [PubMed] [Google Scholar]
- Takahashi, H. (2000). Endogenous digitalis-like factor: an update. Hypertens. Res. 23, S1-S5. [DOI] [PubMed] [Google Scholar]
- Tymiak, A.A., et al. (1993). Physicochemical characterization of a ouabain isomer isolated from bovine hypothalamus. Proc. Natl. Acad. Sci. USA 90, 8189-8193. [DOI] [PMC free article] [PubMed] [Google Scholar]
- Zerial, M., and McBride, H. (2001). Rab proteins as membrane organizers. Nat. Rev. 2, 107-119. [DOI] [PubMed] [Google Scholar]
- Zhang, L., Nakaya, K., Yoshida, T., and Kuroiwa, Y. (1992). Induction by bufalin of differentiation of human leukemia cells HL60, U937, and ML1 toward macrophage/monocyte-like cells and its potent synergistic effect on the differentiation of human leukemia cells in combination with other inducers. Cancer Res. 52, 4634-4641. [PubMed] [Google Scholar]


