

Abstract
AIMS
Identification of biomarkers for stroke will aid our understanding of its aetiology, provide diagnostic and prognostic indicators for patient selection and stratification, and play a significant role in developing personalized medicine. We undertook the largest systematic review conducted to date in an attempt to characterize diagnostic and prognostic biomarkers in acute ischaemic and haemorrhagic stroke and those likely to predict complications following thrombolysis.
METHODS
A comprehensive literature search was carried out to identify diagnostic and prognostic stroke blood biomarkers. Mean differences (MDs) and 95% confidence intervals (CIs) were calculated for each biomarker.
RESULTS
We identified a total of 141 relevant studies, interrogating 136 different biomarkers. Three biomarkers (C-reactive protein, P-selectin and homocysteine) significantly differentiated between ischaemic stroke and healthy control subjects. Furthermore, glial fibrillary acidic protein levels were significantly different between haemorrhagic stroke and ischaemic stroke patients (MD 224.58 ng l−1; 95% CI 25.84, 423.32; P= 0.03), high levels of admission glucose were a strong predictor of poor prognosis after ischaemic stroke and symptomatic intracerebral haemorrhage post-thrombolysis, glutamate was found to be an indicator of progressive (unstable) stroke (MD 172.65 µmol l−1, 95% CI 130.54, 214.75; P= 0.00001), D-dimer predicted in-hospital death (MD 0.67 µg ml−1, 95% CI 0.35, 1.00; P= 0.0001), and high fibrinogen levels were associated with poor outcome at 3 months (MD 47.90 mg l−1, 95% CI 14.88, 80.93; P= 0.004) following ischaemic stroke.
CONCLUSIONS
Few biomarkers currently investigated have meaningful clinical value. Admission glucose may be a strong marker of poor prognosis following acute thrombolytic treatment. However, molecules released in the bloodstream before, during or after stroke may have potential to be translated into sensitive blood-based tests.
Keywords: blood biomarker, diagnosis, haemorrhagic stroke, ischaemic stroke, meta-analysis, prognosis
WHAT IS ALREADY KNOWN ABOUT THIS SUBJECT
Stroke is the largest single cause of disability in the UK. While tests based upon biomarkers have been around for decades, interest in the applications of biomarkers has increased greatly in recent years. Biomarkers released into the bloodstream following a stroke are useful not only for understanding the pathogenesis of stroke, but also play a significant role in the development of personalised medicine. The efficacy of current clinical models and imaging techniques for the diagnosis and prognosis of acute stroke could be improved when used in conjunction with blood biomarkers. While several studies have proposed a number of biomarkers associated with acute stroke in humans, there is conflicting information about the significance of implicated markers, and their clinical relevance is unclear.
WHAT THIS STUDY ADDS
In an attempt to consolidate the plethora of data in this field, we have conducted a comprehensive systematic review and meta-analysis of proteomic and metabolomic blood biomarkers associated with acute stroke. Our meta-analysis has found eight biomarkers that are significantly associated with the diagnosis and prognosis of acute stroke. Interestingly we also found that CRP, a protein commonly implicated as a strong biomarker of inflammation and stroke, may not have sufficient sensitivity and specificity to be of clinical value, Thus while the biomarkers identified through our study are likely to be biologically informative about the mechanisms of vascular disease, their clinical potential for a blood-based test warrants further investigation.
Introduction
Stroke is the second most common cause of death after ischaemic heart disease and is a major cause of disability worldwide [1]. Every year, over 150 000 people in the UK suffer from a stroke, costing the NHS over £2.8 billion, with this figure likely to increase in today's ageing population [2, 3].
Stroke is characterized by the sudden loss of cerebral blood circulation, resulting in a corresponding loss of neurological function. Two principal subtypes exist, namely ischaemic stroke caused by thrombosis or embolism, representing over 80% of all strokes, and haemorrhagic stroke caused by rupture of an artery. Despite the two subtypes sharing similar risk profiles [4], they exhibit distinct molecular mechanisms in the acute phase [5–8].
It is important to distinguish between stroke subtypes and other mimics, such as migraine, focal epilepsy and structural brain lesions [9], which can account for up to a third of patients with stroke-like symptoms [10]. Owing to its accessibility and speed, computed tomography (CT) has been the mainstay of stroke imaging. However, as acute ischaemic stroke is often isodense on CT its initial usefulness is often limited to excluding a haemorrhage. Thus, at present, stroke diagnosis is frequently made upon probability rather than certainty. Diffusion magnetic resonance imaging (MRI) is a more reliable tool for acute diagnosis, but has the disadvantage of being expensive and less readily available.
Biotechnology and pharmaceutical companies are actively engaged in developing new drugs for ischaemic stroke for use particularly at the acute stage (<24 h from onset) in order to reverse and/or protect the rapidly developing necrotic brain region. However, use of these drugs requires a confident diagnosis of stroke, the lack of which has been one reason for the poor uptake of recombinant tissue plasminogen activator thrombolysis [11, 12]. The failure of the neuroprotective agent NXY-059 in the SAINT-II trial, despite rigorous STAIR (Stroke Therapy Academic Industry Round table) guidelines, supports the necessity to adopt a biomarker-based system to drug development that should increase the likelihood of success in both preclinical and clinical trials through proof of concept [13]. Drug discovery processes that are based upon these biomarker strategies are also likely to be more efficient and cost-effective [14].
Stroke biomarkers of high specificity and sensitivity should be able to diagnose and differentiate between intracerebral haemorrhage (ICH) and acute ischaemic stroke (AIS), to predict prognosis after stroke and to facilitate patient stratification for therapeutic intervention. The ideal biomarker test for acute ischaemic stroke would act as a prehospital screening tool, allowing rapid diagnosis without the necessity for neuroimaging.
The development of successful diagnostic tests through biomarker identification has proved to be a challenge to biomedical scientists. Many protein and metabolic biomarkers have been implicated in the pathophysiology of stroke, but their clinical relevance is unclear. In order to provide the scientific community with some clarity in this disparate field, we have performed a comprehensive systematic review of proteomic and metabolomic blood biomarkers studied in acute stroke, including those used for either diagnostic or prognostic purposes, as well as those that attempt to predict outcome from pharmacological interventions such as thrombolysis. To the best of our knowledge, this is the largest such analysis conducted to date.
Methods
Data sources and extraction
Electronic databases MEDLINE, EMBASE and Google Scholar were searched on 19 November 2010 up to 1 January 2011 for all studies detailing the use of blood biomarkers for stroke in humans. Search retrieval was maximized by using four terms for thrombolysis (thrombolysis, thrombolytic therapy, plasminogen activator and alteplase), seven for haemorrhagic stroke (cerebral, intracranial, parenchymal, intraventricular, infratentorial, supratentorial h[a]emorrhage and bleeding), 14 for ischaemic stroke (ischaemic, ischemic, cerebral, intracranial, parenchymal, intraventricular, infratentorial, supratentorial, cerbrovascular, infarction, stroke, thrombus, occlusion and embolus), three for generic biomarkers (biological, biochemical marker and biomarker) and 780 specific biomarker terms with ‘and/or’ used as a Boolean operator (Supporting Materials S1). References from all relevant papers were hand searched for additional studies, and the MEDLINE ‘Related Articles’ option was used to identify further articles. The search was restricted to the English language. Searches and study screening were performed independently by N.H. and P.McC.; data extraction was conducted by N.H. alone.
Inclusion criteria were set using Cochrane guidelines [15]. For the evaluation of diagnostic biomarkers, studies were required to have reported markers that discriminated between ischaemic and haemorrhagic stroke and nonstroke subjects (healthy, stroke mimics or other neurological diseases). Where more than one cohort was examined, data for each population were extracted separately. Studies were eligible for inclusion if blood had been drawn within 24 h of stroke onset, and prognostic biomarkers measured using death, disability or handicap scales. No minimal sample size was set for study inclusion, but only papers reporting continuous measures of biomarker activity or concentration (mean/median and standard deviation/range) were chosen for meta-analysis. Papers reporting only the risk of subsequent stroke or risk of stroke in a nonstroke population were not included. Papers examining subarachnoid haemorrhage were excluded. Observational studies were reviewed using STROBE criteria; the quality of diagnostic and prognostic studies was reviewed using modified QUADAS criteria [16] and a quality questionnaire implemented by Whiteley et al. [17], respectively. The Quorum Statement [18] was also consulted.
Statistical analysis
A meta-analysis was performed on each biomarker for which data were available for more than two studies comparing the same cohorts. Data were analysed using the Review Manager v5.0 software (Cochrane Collaboration, Syracuse, NY, USA). In instances when a biomarker was reported in different units between studies, the units were adjusted for consistency. Where values were reported as medians and ranges, the mean and standard deviation were estimated using a variety of models dependent upon sample size, as described by Hozo et al. [19]. Data variability reported as standard error or confidence intervals was also converted to a standard deviation value. Mean difference (MD) was calculated for each biomarker using a random-effects model, as well as 95% confidence intervals (CIs) to measure the strength of association. Tests for heterogeneity with iterative analyses were conducted for each meta-analysis (P < 0.05) and, where appropriate, funnel plots and Egger regression (two-tailed) were used to assess publication bias in Comprehensive Meta-Analysis version 2 software.
Results
The primary search identified 819 studies for ischaemic stroke (diagnostic and prognostic), 673 for haemorrhagic stroke (diagnostic and prognostic) and 256 for prognosis after thrombolysis. Of these, 189, 116 and 47 studies met the inclusion criteria, respectively. A total of 136 different biomarkers were identified (Supplementary Table S1).
Of the 189 manuscripts identified for ischaemic stroke, data for meta-analysis could be extracted from 53 reporting diagnostic biomarkers and 47 reporting prognostic biomarkers, as these were the studies reporting continuous data. Of the 116 studies identified for haemorrhagic stroke, data could be extracted from 14 reporting diagnostic biomarkers and eight reporting prognostic biomarkers (Preferred Reporting Items for Systematic Reviews and Meta-Analyses flow diagram [20]; Figure 1).
Figure 1.
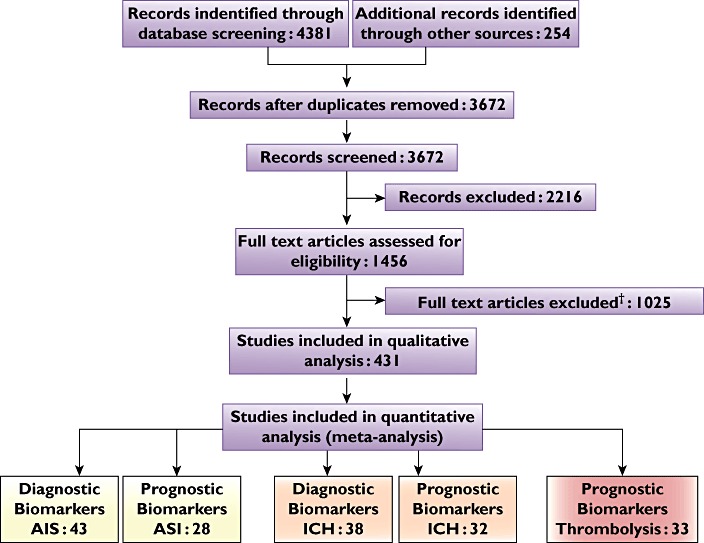
Preferred Reporting Items for Systematic Reviews and Meta-Analyses statement flow diagram illustrating the search strategy and number of studies included in the meta-analysis. Abbreviations: AIS, acute ischaemic stroke; and ICH, intracerebral haemorrhage. †Full text articles excluded because: duplicate studies, report risk not diagnosis/prognosis, data not reported in desired format
Diagnostic biomarkers for ischaemic and haemorrhagic stroke
Of the markers measured for differentiation between ischaemic stroke and healthy control subjects, only three (C-reactive protein (CRP), P-selectin and homocysteine) were found to be of statistical significance in our meta-analysis (CRP, MD 2.03 mg l−1, 95% CI 1.11, 2.94; P= 0.0001, Figure 2; P-selectin, MD 56.75 ng ml−1, 95% CI 10.60, 102.90; P= 0.02; and homocysteine, MD 4.76 mmol l−1, 95% CI 2.82, 6.71; P= 0.00001); however, the high level of heterogeneity (P < 0.00001) between papers reporting these markers lends uncertainty to the quality and value of the results.
Figure 2.
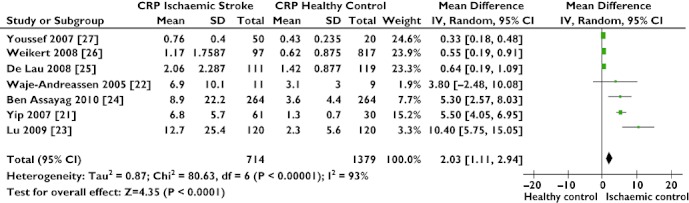
Forest plot comparing C-reactive protein (CRP) levels in acute ischaemic stroke and a healthy population. High CRP levels show a significant association with the presence of ischaemic stroke
Separate analysis of hs (high sensitivity)-CRP [21–24] and CRP levels [25–27] removed the high heterogeneity present in the combined analysis (combined, I2= 93%, P= 0.00001; hs-CRP only, I2= 32%, P= 0.22; and CRP only, I2= 22%, P= 0.28), but found little difference in the distinguishing power of hs-CRP over CRP assays (hs-CRP, MD 5.94 mg l−1, 95% CI 4.11, 7.78; P= 0.00001; and CRP, MD 0.42 mg l−1, 95% CI 0.24, 0.60; P= 0.00001).
Only one protein, glial fibrillary acidic protein (GFAP), was able to differentiate statistically between ischaemic and haemorrhagic stroke (MD 224.58 ng l−1, 95% CI 25.84, 423.32; P= 0.03), with no significant heterogeneity between studies, although this is based on only three studies. One study, by Dvorak et al. [28], reported measurements of GFAP taken at regular intervals up to 24 h following stroke. These investigators showed that serum GFAP levels are much higher in haemorrhagic stroke than in ischaemic stroke, increasing steadily up to 12 h post-stroke and then declining, while GFAP levels are barely measureable before 12 h in ischaemic stroke patients, and continue to increase up to 24 h. Following an iterative analysis, we found that measurement of GFAP levels within a 3–4 h time window gave the best differentiation between the two stroke types.
Prognostic biomarkers for ischaemic and haemorrhagic stroke
Studies reported a number of outcome measures post-stroke (Supplementary Table S1). Many of these outcomes were measured at differing time points (in hospital, 48 h, 3 months or several years later) and used a variety of outcome scores {modified Rankin Scale (mRS) [29, 30], Canadian Stroke Scale (CSS) [31, 32], Barthel Index [33, 34] and National Institute of Health Stroke Scale (NIHSS) [35]}.
We identified prognostic biomarkers of significant value in three different outcomes of ischaemic stroke: progressive (decrease > 1 CSS)/stable stroke within 48 h), in-hospital survival/death and good (mRS 0–2)/poor (mRS 3–6) outcome at 3 months. For all of these outcomes, high admission glucose levels were found to be a strong predictor of poor prognosis (MD 3.17 mmol l−1, 95% CI 1.60, 4.74; P= 0.0001; MD 1.85 mmol l−1, 95% CI 0.61, 3.15; P= 0.003; and MD 0.98 mmol l−1, 95% CI 0.48, 1.48; P= 0.0001, respectively). In addition, glutamate was found to be an indicator of progressive stroke (MD 172.65 µmol l−1, 95% CI 130.54, 214.75; P= 0.00001); D-dimer predicted in-hospital death (MD 0.67 µg ml−1, 95% CI 0.35, 1.00; P= 0.0001) and high fibrinogen levels were associated with poor outcome at 3 months post-stroke (MD 47.90 mg l−1, 95% CI 14.88, 80.93; P= 0.004) following iterative analysis and exclusion of one paper [36] that accounted for high heterogeneity.
None of the candidate molecules reported to be of prognostic value following haemorrhagic stroke showed statistical significance in the meta-analysis.
Prognostic biomarkers following thrombolysis
Studies reported a number of outcomes following thrombolysis, including death, oedema, dramatic recovery, poor outcome (NIHSS, mRS), occurrence of haemorrhagic transformation and/or symptomatic haemorrhage and efficiency of recanalization. Of these, only one outcome, risk of post-thrombolysis symptomatic haemorrhage, was found to have a biomarker, admission glucose, of statistical significance after conducting a meta-analysis of observational studies (MD 0.85 mmol l−1, 95% CI 0.37, 1.35; P= 0.0006; Figure 3).
Figure 3.
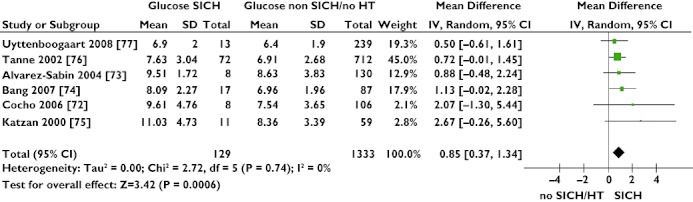
Forest plot showing association of high admission glucose levels with risk of ischaemic stroke patients developing symptomatic intracerebral haemorrhage (SICH) post-thrombolysis
Discussion
Numerous molecules have been suggested as biomarkers that are useful in the accurate diagnosis of ischaemic and haemorrhagic stroke; however, our study finds that at present few can significantly differentiate between patients with ischaemic and haemorrhagic stroke, or between stroke patients and healthy or patient control subjects. Of 136 molecular variables measured for stroke management, only eight (four diagnostic: CRP, P-selectin, homocysteine and GFAP; and four prognostic: glucose, glutamate, D-dimer and fibrinogen) were found to be supported by statistical analyses (Table 1).
Table 1.
Summary of statistically significant biomarkers
| Biomarker | Number of studies | Number of subjects | Mean difference | 95% Confidence interval | P value | Interstudy heterogeneity (χ2; P value) | |
|---|---|---|---|---|---|---|---|
| Ischaemic stroke | |||||||
| Diagnosis | |||||||
| Acute ischaemic stroke vs. healthy control subjects | |||||||
| C-Reactive protein (mg l−1) | 8 [21–27] | 2326 | 1.6 | 0.92, 2.27 | 0.00001 | χ2= 97.00; P= 0.00001 | |
| P-Selectin (ng ml−1) | 2 [56, 57] | 179 | 56.75 | 10.60, 102.90 | 0.02 | χ2= 50.46; P= 0.00001 | |
| Homocysteine (mmol l−1) | 3 [27, 58, 59] | 759 | 4.76 | 2.82, 6.71 | 0.00001 | χ2= 42.70; P= 0.00001 | |
| Prognosis | |||||||
| Good outcome (mRS 0–2) vs. poor outcome (mRS 3–6) | |||||||
| Glucose (mmol l−1) | 4 [60–63] | 1696 | 0.98 | 0.48, 1.48 | 0.0001 | χ2= 15.25; P= 0.002 | |
| Fibrinogen (mg l−1) | 4 [36, 60, 62, 63] | 1642 | 47.90 | 14.88, 80.93 | 0.004 | χ2= 9.23; P= 0.010 | |
| Progressive (dec > 1 CSS in 48 h) vs. stable stroke | |||||||
| Glucose (mmol l−1) | 3 [64–66] | 572 | 3.17 | 1.60, 4.74 | 0.0001 | χ2= 29.12; P= 0.00001 | |
| Glutamate (µmol l−1) | 3 [64, 65, 67] | 341 | 172.65 | 130.54, 214.75 | 0.00001 | χ2= 14.45; P= 0.0007 | |
| Survival in hospital vs. death in hospital | |||||||
| Glucose (mmol l−1) | 2 [68, 69] | 1295 | 1.85 | 0.61, 3.15 | 0.003 | χ2= 0.26; P= 0.61 | |
| D-Dimer (µg ml−1) | 2 [69, 70] | 566 | 0.67 | 0.35, 1.00, | 0.0001 | χ2= 0.64; P= 0.42 | |
| Haemorrhagic stroke | |||||||
| Diagnosis | |||||||
| Intracerebral haemorrhage vs. acute ischaemic stroke | |||||||
| Glial fibrillary acidic protein (ng l−1) | 3 [28, 38, 71] | 258 | 224.58 | 25.84, 423.32 | 0.03 | χ2= 5.70; P= 0.06 | |
| Prognosis following thrombolysis | |||||||
| Symptomatic intracerebral haemorrhage vs. no/asymptomatic haemorrhage | |||||||
| Glucose (mmol l−1) | 6 [72–77] | 1462 | 0.85 | 0.37, 1.34 | 0.0006 | χ2= 2.71; P= 0.74 | |
Diagnostic and prognostic biomarkers for stroke
Biomarkers implicated in the differentiation between ischaemic stroke patients and control subjects include acute phase and inflammatory proteins CRP and P-selectin. Notably, only one biomarker identified as being significantly associated with stroke, GFAP, is a solely brain-derived molecule, although it is likely that the dysregulation of proteins involved in cell adhesion (e.g. intracellular adhesion molecule 1, fibronectin and matrix metalloproteinase-9) and increased plasma DNA levels in blood samples of stroke patients are a direct result of tissue damage within the brain. Being highly expressed by astroglial cells, which maintain the protective function of the blood–brain barrier, it has been suggested that enhanced GFAP levels are associated with the blood–brain barrier injury [37]. Foerch and colleagues [38] found that GFAP was detectable in 81% of patients with haemorrhagic stroke, compared with only 5% having ischaemic stroke.
The amino acid glutamate is the most abundant neurotransmitter in the brain, and it is likely that high levels are an indication of the extent of neuronal damage and therefore prognosis following stroke [39]. Homocysteine is another amino acid with a well-established relationship with vascular disease, linked with atherosclerosis, oxidative damage and vascular smooth muscle cell proliferation. With this in mind, it is not surprising that higher homocysteine levels can distinguish ischaemic stroke patients from healthy control subjects [40].
Prognostic biomarkers for thrombolysis
Intravenous recombinant tissue plasminogen activator has revolutionized acute stroke management since its approval by the US Food and Drug Administration in 1996, and is the standard thrombolysing agent across the world.
Whilst 50% of patients receiving intravenous recombinant tissue plasminogen activator achieve complete or partial recanalization of the middle cerebral artery, a third of these patients also experience neurological worsening or delayed ischaemic injury [41–43]. Furthermore, risk of developing symptomatic ICH is one key reason why clinicians are reluctant to thrombolyse a patient and accounts for low treatment rates in the UK [44]. As not all forms of ICH are symptomatic or detrimental, a biomarker that is able to predict poor outcome following thrombolysis would improve patient selection, stratification, uptake of treatment and management.
One marker repeatedly found to be associated with poor prognosis after stroke and after thrombolysis was glucose. Post-stroke hyperglycaemia is a common phenomenon, with up to 50% of patients in two-thirds of ischaemic stroke subtypes having blood glucose levels of above 6.0 mmol l−1. There is ample evidence to suggest that hyperglycaemia is detrimental in cerebral ischaemia [45].
Clinical relevance of statistically significant markers
In complex conditions, such as acute ischaemic stroke, there is a large degree of heterogeneity between patients, with biochemical profiles likely to be altered by the site, intensity and duration of ischaemia [46]. The additional effects of ethnicity, comorbidities, analytical techniques and interpretation of results limit reproducibility between studies [47]. The analysis of small sample populations has made it difficult to ascertain the true relationship between a marker and patient diagnosis/prognosis; the analysis of samples from large patient cohorts, stratified by known risk factors, should minimize the influence of clinical confounding variables [48].
With these experimental variations in mind, it is important that the parameters of data collection and classification are clearly outlined in every study report. The REMARK (Reporting Recommendations for Tumour Marker Prognostic Studies) guidelines, proposed by McShane et al. [49] suggests 20 items that should be reported in every biomarker study, including detailed descriptions of the patient population, basis for study design and assumptions of the model used to analyse data. While these recommendations were devised for tumour studies, they perhaps should be applied to all biomarker investigations.
A recent review has commented upon the risk of individual studies exaggerating biomarker associations and the caution needed in interpreting the reported results [50]. Hence, although our meta-analysis has established eight biomarkers of statistical significance likely to be indicative of the pathophysiology of stroke, these markers may have only marginal translational value. A difference in means between two populations does not eliminate the possibility of considerable overlap between the two distributions, leading to high rates of false positives and false negatives at set thresholds [51]. This concept can be illustrated by plotting distribution curves based upon biomarker levels found in two clinically distinct populations. Figure 4b demonstrates that CRP levels in ischaemic stroke and healthy control populations from studies included in our meta-analysis lack the sensitivity and specificity required for effective discrimination between the two populations, raising doubt about the clinical value of CRP as a biomarker [52]. Conversely, glucose levels after ischaemic stroke appear to be more promising in characterizing patients with stable prognosis or progressive worsening (Figure 4c).
Figure 4.
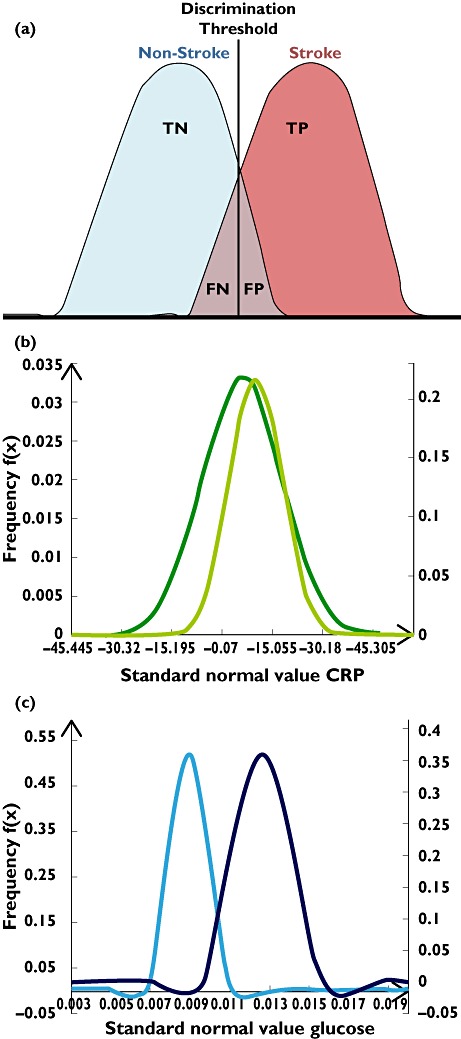
Biomarker distribution profiles for determining discrimination limits. (a) Biomarker discrimination limits are dependent upon the separation of distributions between two populations, affecting the numbers of true positives (TPs), true negatives (TNs), false positives (FPs) and false negatives (FNs) that can be distinguished. (b) C-Reactive protein distributions in ischaemic stroke patients and healthy control subjects, based upon data from studies in our meta-analysis. An arbitrary cut-off value could result in high rates of FPs and FNs. (c) Admission glucose levels in ischaemic stroke patients based upon studies included in our meta-analysis show good separation between distribution curves; hence, admission glucose could be a good indicator of progressive worsening compared with stable prognosis. (b) Ischaemic Stroke ( ); Healthy (
 ). (c) Stable (
 ); Progressive (
 )
)
Multimarker panel tests
To date, no individual biomarker has proved to have adequate sensitivity and specificity for a clinical diagnostic test. A number of studies have attempted a multimarker panel approach in order to improve sensitivity and specificity [53–55]; however, thus far none has been suitably successful in a clinical setting.
This emphasizes a requirement for the identification of novel candidate biomarkers to develop a clinically relevant plasma-based test. As results from our meta-analysis suggest, the incorporation of routine biochemical variables, such as glucose and fibrinogen, into a marker panel could also enhance the accuracy of such a test. Importantly, this holds great implications for the development of a blood-based test for stroke, because the use of routine markers provides a simple and effective method of assessment, removing the need for a test based upon proteins that could potentially require longer and more complex laboratory analysis.
Limitations
It is important that the findings of this systematic review are considered in light of its limitations. Considerable heterogeneity between study design and data analysis precluded the inclusion of many studies into a meta-analysis and restricts the interpretation of our findings. Papers reporting threshold values for biomarker concentrations were excluded to reduce bias, as were papers that reported odds ratios without detailing the mean/median and variability of each data set. It is probable that the timing of a blood sample taken after stroke affects the concentrations of the biomarkers measured, although this could not be explored owing to the paucity of data. Despite the presence of heterogeneity, a number of measures have been taken to limit its impact, e.g. the use of the random-effects model and subgroup analysis. However, it is difficult to avoid publication bias when conducting a meta-analysis. Notwithstanding this inevitability, we have tried to account for this by manually searching abstracts and letters and by performing funnel plots and Egger regression asymmetry tests (Supporting Materials S2; Supporting Information Figures S1 and S2).
It is also important to consider that the meta-analysis was conducted collectively to maintain high statistical power, rather than splitting studies based upon their sample of measurement (plasma/serum/whole blood). However, iterative analysis found that inclusion/exclusion of certain sample types did not make significant differences to the results achieved. For example, exclusion of two studies reporting serum homocysteine levels in diagnosing between ischaemic stroke and healthy control subjects did not significantly affect analysis (collective, MD 1.60, 95% CI 0.92, 2.27; P= 0.00001; and plasma studies only, MD 1.34, 95% CI 0.69, 2.00; P= 0.0001). Finally, our work was limited to studies mainly of European origin. Although this restriction may not allow a detailed assessment of other ancestral groups, the extent of heterogeneity would in all likelihood have been too great to incorporate such diverse populations into the pooled odds ratio for each biomarker.
Conclusion
Even though stroke biomarkers studied are likely to be biologically informative about the mechanisms of vascular disease, their clinical value as sensitive diagnostic and prognostic tests remains uncertain. While many such biomarkers have been evaluated, few stand up to statistical scrutiny. However, admission glucose levels could be a strong predictor of poor prognosis and symptomatic ICH following thrombolytic treatment for ischaemic stroke. Proteins involved in metabolic pathways that are released into the blood before, during or after stroke do have the potential to be incorporated into clinically useful tests.
Acknowledgments
N.H. is funded by the Medical Research Council (UK). P.S and P.B. hold Department of Health (UK) Senior Fellowships.
Competing Interests
There are no competing interests to declare.
Supporting Information
Additional Supporting Information may be found in the online version of this article:
Search strategy for extraction of relevant papers for review.
Material S2 Funnel plot and Egger Regression results to assess publication bias associated with results in Figures 2 and 3.
Funnel plot assessing publication bias for studies comparing C-reactive protein (CRP) levels in acute ischaemic stroke and healthy population. Egger Regression intercept probability value = 3.453; standard error = 0.799; P value (two-tailed) = 0.111. Performed using Comprehensive Meta-Analysis version 2 software.
Funnel plot showing association of high admission glucose levels with risk of ischaemic stroke patients developing symptomatic intracerebral haemorrhage (SICH) post-thrombolysis. Egger Regression intercept probability value = 1.167; standard error = 0.610; P value (two-tailed) = 0.128. Performed using Comprehensive Meta-Analysis version 2 software.
List of all biomarkers identified in literature search that met inclusion criteria. Results from RevMan meta-analysis output are detailed, and biomarkers of significance are highlighted in yellow.
REFERENCES
- 1.Department of Health. Reducing brain damage: faster access to better stroke care. National Audit Office Report. 2005:1–60. [Google Scholar]
- 2.2010. Office of National Statistics Health Statistics Quarterly. No.47; Autumn.
- 3.UK Department of Health. 2007. pp. 1–83. National Stroke Strategy.
- 4.Michel P, Bogousslavsky J. Shared mechanisms of ischaemic and haemorrhagic stroke: still a lot to learn. J Neurol Neurosurg Psychiatry. 2006;77:1. doi: 10.1136/jnnp.2005.078287. [DOI] [PMC free article] [PubMed] [Google Scholar]
- 5.Kleinig TJ, Vink R. Suppression of inflammation in ischemic and hemorrhagic stroke: therapeutic options. Curr Opin Neurol. 2009;22:294–301. doi: 10.1097/wco.0b013e32832b4db3. [DOI] [PubMed] [Google Scholar]
- 6.Wang Q, Tang XN, Yenari MA. The inflammatory response in stroke. J Neuroimmunol. 2007;184:53–68. doi: 10.1016/j.jneuroim.2006.11.014. [DOI] [PMC free article] [PubMed] [Google Scholar]
- 7.Wang J, Doré S. Inflammation after intracerebral hemorrhage. J Cereb Blood Flow Metab. 2007;27:894–908. doi: 10.1038/sj.jcbfm.9600403. [DOI] [PubMed] [Google Scholar]
- 8.Xi G, Keep RF, Hoff JT. Mechanisms of brain injury after intracerebral haemorrhage. Lancet. 2006;5:53–63. doi: 10.1016/S1474-4422(05)70283-0. [DOI] [PubMed] [Google Scholar]
- 9.Cordonnier C, Leys D. Stroke: the bare essentials. Pract Neurol. 2008;8:263–72. doi: 10.1136/jnnp.2008.149401. [DOI] [PubMed] [Google Scholar]
- 10.Hand PJ, Kwan J, Lindley RI, Dennis MS, Wardlaw JM. Distinguishing between stroke and mimic at the bedside: the brain attack study. Stroke. 2006;37:769–75. doi: 10.1161/01.STR.0000204041.13466.4c. [DOI] [PubMed] [Google Scholar]
- 11.Wu O, Langhorne P. The challenge of acute-stroke management: does telemedicine offer a solution? Int J Stroke. official journal of the International Stroke Society. 2006;1:201–7. doi: 10.1111/j.1747-4949.2006.00062.x. [DOI] [PubMed] [Google Scholar]
- 12.Bambauer KZ, Johnston SC, Bambauer DE, Zivin JA. Reasons why few patients with acute stroke receive tissue plasminogen activator. Arch Neurol. 2006;63:661–4. doi: 10.1001/archneur.63.5.661. [DOI] [PubMed] [Google Scholar]
- 13.Feuerstein GZ, Chavez J. Translational medicine for stroke drug discovery: the pharmaceutical industry perspective. Stroke. 2009;40:S121–S125. doi: 10.1161/STROKEAHA.108.535104. [DOI] [PubMed] [Google Scholar]
- 14.Frank R, Hargreaves R. Clinical biomarkers in drug discovery and development. Nat Rev Drug Discov. 2003;2:566–80. doi: 10.1038/nrd1130. [DOI] [PubMed] [Google Scholar]
- 15.Bossuyt PM, Leeflang MM. 2008. Chapter 6: developing criteria for including studies. . In: Cochrane Handbook for Systematic Reviews of Diagnostic Test Accuracy Version 0.4[updated September 2008]. The Cochrane Collaboration. [Google Scholar]
- 16.Whiteley W, Tseng M-C, Sandercock P. Blood biomarkers in the diagnosis of ischemic stroke: a systematic review. Stroke. 2008;39:2902–9. doi: 10.1161/STROKEAHA.107.511261. [DOI] [PubMed] [Google Scholar]
- 17.Whiteley W, Chong WL, Sengupta A, Sandercock P. Blood markers for the prognosis of ischemic stroke: a systematic review. Stroke. 2009;40:e380–9. doi: 10.1161/STROKEAHA.108.528752. [DOI] [PubMed] [Google Scholar]
- 18.Moher D, Cook DJ, Eastwood S, Olkin I, Rennie D, Stroup DF. Improving the quality of reports of meta-analyses of randomised controlled trials: the QUOROM statement. Quality of Reporting of Meta-Analyses. Lancet. 1999;354:1896–900. doi: 10.1016/s0140-6736(99)04149-5. [DOI] [PubMed] [Google Scholar]
- 19.Hozo SP, Djulbegovic B, Hozo I. Estimating the mean and variance from the median, range, and the size of a sample. BMC Med Res Methodol. 2005;5:13–23. doi: 10.1186/1471-2288-5-13. [DOI] [PMC free article] [PubMed] [Google Scholar]
- 20.Liberati A, Altman DG, Tetzlaff J, Mulrow C, Gøtzsche PC, Ioannidis JPA, Clarke M, Devereaux PJ, Kleijnen J, Moher D. The PRISMA statement for reporting systematic reviews and meta-analyses of studies that evaluate health care interventions: explanation and elaboration. PLoS Med. 2009;6:e1000100. doi: 10.1371/journal.pmed.1000100. [DOI] [PMC free article] [PubMed] [Google Scholar]
- 21.Yip H-K, Lai S-L, Lan M-Y, Chang W-N, Liu JS, Kao Y-F, Chang Y-Y, Lu C-H, Chen W-H, Lin H-H, Liou C-W. Time course of platelet activation and von Willebrand factor in patients with non-valvular atrial fibrillation after ischemic stroke. Circ J. 2007;71:321–6. doi: 10.1253/circj.71.321. [DOI] [PubMed] [Google Scholar]
- 22.Waje-Andreassen U, Kråkenes J, Ulvestad E, Thomassen L, Myhr K-M, Aarseth J, Vedeler CA. IL-6: an early marker for outcome in acute ischemic stroke. Acta Neurol Scand. 2005;111:360–5. doi: 10.1111/j.1600-0404.2005.00416.x. [DOI] [PubMed] [Google Scholar]
- 23.Lu L-F, Yang S-S, Wang C-P, Hung W-C, Yu T-H, Chiu C-A, Chung F-M, Shin S-J, Lee Y-J. Elevated visfatin/pre-B-cell colony-enhancing factor plasma concentration in ischemic stroke. J Stroke Cerebrovasc Dis. 2009;18:354–9. doi: 10.1016/j.jstrokecerebrovasdis.2009.01.003. [DOI] [PubMed] [Google Scholar]
- 24.Ben Assayag E, Shenhar-Tsarfaty S, Ofek K, Soreq L, Bova I, Shopin L, Berg RMG, Berliner S, Shapira I, Bornstein NM, Soreq H. Serum cholinesterase activities distinguish between stroke patients and controls and predict 12-month mortality. Mol Med. 2010;16:278–86. doi: 10.2119/molmed.2010.00015. [DOI] [PMC free article] [PubMed] [Google Scholar]
- 25.de Lau LML, Cheung EYL, Kluft C, Leebeek FWG, Meijer P, Laterveer R, Dippel DWJ, de Maat MPM. Strongly increased levels of fibrinogen elastase degradation products in patients with ischemic stroke. Br J Haematol. 2008;143:734–7. doi: 10.1111/j.1365-2141.2008.07395.x. [DOI] [PubMed] [Google Scholar]
- 26.Weikert C, Westphal S, Berger K, Dierkes J, Möhlig M, Spranger J, Rimm EB, Willich SN, Boeing H, Pischon T. Plasma resistin levels and risk of myocardial infarction and ischemic stroke. J Clin Endocrinol Metab. 2008;93:2647–53. doi: 10.1210/jc.2007-2735. [DOI] [PubMed] [Google Scholar]
- 27.Youssef MYZ, Mojiminiyi OA, Abdella NA. Plasma concentrations of C-reactive protein and total homocysteine in relation to the severity and risk factors for cerebrovascular disease. Transl Res. 2007;150:158–63. doi: 10.1016/j.trsl.2007.02.006. [DOI] [PubMed] [Google Scholar]
- 28.Dvorak F, Haberer I, Sitzer M, Foerch C. Characterisation of the diagnostic window of serum glial fibrillary acidic protein for the differentiation of intracerebral haemorrhage and ischaemic stroke. Cerebrovasc Dis. 2009;27:37–41. doi: 10.1159/000172632. [DOI] [PubMed] [Google Scholar]
- 29.Rankin J. Cerebral vascular accidents in patients over the age of 60. II. Prognosis. Scott Med J. 1957;2:200–15. doi: 10.1177/003693305700200504. [DOI] [PubMed] [Google Scholar]
- 30.Van Swieten JC, Koudstaal PJ, Visser MC, Schouten HJ, Van Gijn J. Interobserver agreement for the assessment of handicap in stroke patients. Stroke. 1988;19:604–7. doi: 10.1161/01.str.19.5.604. [DOI] [PubMed] [Google Scholar]
- 31.Côté R, Hachinski VC, Shurvell BL, Norris JW, Wolfson C. The Canadian Neurological Scale: a preliminary study in acute stroke. Stroke. 1986;17:731–7. doi: 10.1161/01.str.17.4.731. [DOI] [PubMed] [Google Scholar]
- 32.Côté R, Battista RN, Wolfson C, Boucher J, Adam J, Hachinski V. The Canadian Neurological Scale: validation and reliability assessment. Neurology. 1989;39:638–43. doi: 10.1212/wnl.39.5.638. [DOI] [PubMed] [Google Scholar]
- 33.Mahoney FI, Barthel DW. Functional evaluation: the Barthel Index. Md State Med J. 1965;14:61–5. [PubMed] [Google Scholar]
- 34.Granger CV, Dewis LS, Peters NC, Sherwood CC, Barrett JE. Stroke rehabilitation: analysis of repeated Barthel index measures. Arch Phys Med Rehabil. 1979;60:14–7. [PubMed] [Google Scholar]
- 35.Brott T, Adams HP, Olinger CP, Marler JR, Barsan WG, Biller J, Spilker J, Holleran R, Eberle R, Hertzberg V. Measurements of acute cerebral infarction: a clinical examination scale. Stroke. 1989;20:864–70. doi: 10.1161/01.str.20.7.864. [DOI] [PubMed] [Google Scholar]
- 36.Welsh P, Barber M, Langhorne P, Rumley A, Lowe GDO, Stott DJ. Associations of inflammatory and haemostatic biomarkers with poor outcome in acute ischaemic stroke. Cerebrovasc Dis. 2009;27:247–53. doi: 10.1159/000196823. [DOI] [PubMed] [Google Scholar]
- 37.Liao C-W, Cho W-L, Kao T-C, Su K-E, Lin Y-H, Fan C-K. Blood-brain barrier impairment with enhanced SP, NK-1R, GFAP and claudin-5 expressions in experimental cerebral toxocariasis. Parasite Immunol. 2008;30:525–34. doi: 10.1111/j.1365-3024.2008.01048.x. [DOI] [PubMed] [Google Scholar]
- 38.Foerch C, Curdt I, Yan B, Dvorak F, Hermans M, Berkefeld J, Raabe A, Neumann-Haefelin T, Steinmetz H, Sitzer M. Serum glial fibrillary acidic protein as a biomarker for intracerebral haemorrhage in patients with acute stroke. J Neurol Neurosurg Psychiatry. 2006;77:181–4. doi: 10.1136/jnnp.2005.074823. [DOI] [PMC free article] [PubMed] [Google Scholar]
- 39.Jin R, Yang G, Li G. Molecular insights and therapeutic targets for blood-brain barrier disruption in ischemic stroke: critical role of matrix metalloproteinases and tissue-type plasminogen activator. Neurobiol Dis. 2010;38:376–85. doi: 10.1016/j.nbd.2010.03.008. [DOI] [PMC free article] [PubMed] [Google Scholar]
- 40.Casas J, Bautista L, Smeeth L, Sharma P, Hingorani A. Homocysteine and stroke: evidence on a causal link from mendelian randomisation. Lancet. 2005;365:224–32. doi: 10.1016/S0140-6736(05)17742-3. [DOI] [PubMed] [Google Scholar]
- 41.Grotta JC, Welch KM, Fagan SC, Lu M, Frankel MR, Brott T, Levine SR, Lyden PD. Clinical deterioration following improvement in the NINDS rt-PA Stroke Trial. Stroke. 2001;32:661–8. doi: 10.1161/01.str.32.3.661. [DOI] [PubMed] [Google Scholar]
- 42.Kidwell CS, Saver JL, Starkman S, Duckwiler G, Jahan R, Vespa P, Villablanca JP, Liebeskind DS, Gobin YP, Vinuela F, Alger JR. Late secondary ischemic injury in patients receiving intraarterial thrombolysis. Ann Neurol. 2002;52:698–703. doi: 10.1002/ana.10380. [DOI] [PubMed] [Google Scholar]
- 43.Moldes O, Sobrino T, Millán M, Castellanos M, Pérez De La Ossa N, Leira R, Serena J, Vivancos J, Dávalos A, Castillo J. High serum levels of endothelin-1 predict severe cerebral edema in patients with acute ischemic stroke treated with t-PA. Stroke. 2008;39:2006–10. doi: 10.1161/STROKEAHA.107.495044. [DOI] [PubMed] [Google Scholar]
- 44.Wardlaw JM. Thrombolysis for acute ischaemic stroke. Cochrane Database Syst Rev. doi: 10.1002/14651858.CD000213. [DOI] [PubMed] [Google Scholar]
- 45.Capes SE, Hunt D, Malmberg K, Pathak P, Gerstein HC. Stress hyperglycemia and prognosis of stroke in nondiabetic and diabetic patients: a systematic overview. Stroke. 2001;32:2426–32. doi: 10.1161/hs1001.096194. [DOI] [PubMed] [Google Scholar]
- 46.Saenger AK, Christenson RH. Stroke biomarkers: progress and challenges for diagnosis, prognosis, differentiation, and treatment. Clin Chem. 2010;56:21–33. doi: 10.1373/clinchem.2009.133801. [DOI] [PubMed] [Google Scholar]
- 47.Bensalah K, Montorsi F, Shariat SF. Challenges of cancer biomarker profiling. Eur Urol. 2007;52:1601–9. doi: 10.1016/j.eururo.2007.09.036. [DOI] [PubMed] [Google Scholar]
- 48.Kirschenlohr HL, Griffin JL, Clarke SC, Rhydwen R, Grace AA, Schofield PM, Brindle KM, Metcalfe JC. Proton NMR analysis of plasma is a weak predictor of coronary artery disease. Nat Med. 2006;12:705–10. doi: 10.1038/nm1432. [DOI] [PubMed] [Google Scholar]
- 49.McShane LM, Altman DG, Sauerbrei W, Taube SE, Gion M, Clark GM. Reporting recommendations for tumor marker prognostic studies (REMARK) Exp Oncol. 2006;28:99–105. [PubMed] [Google Scholar]
- 50.Ioannidis JPA, Panagiotou OA. Comparison of effect sizes associated with biomarkers reported in highly cited individual articles and in subsequent meta-analyses. JAMA. 2011;305:2200–10. doi: 10.1001/jama.2011.713. [DOI] [PubMed] [Google Scholar]
- 51.May A, Wang TJ. Biomarkers for cardiovascular disease: challenges and future directions. Trends Mol Med. 2008;14:261–7. doi: 10.1016/j.molmed.2008.04.003. [DOI] [PubMed] [Google Scholar]
- 52.Hingorani AD, Shah T, Casas JP, Humphries SE, Talmud PJ. C-reactive protein and coronary heart disease: predictive test or therapeutic target? Clin Chem. 2009;55:239–55. doi: 10.1373/clinchem.2008.115923. [DOI] [PubMed] [Google Scholar]
- 53.Reynolds MA, Kirchick HJ, Dahlen JR, Anderberg JM, McPherson PH, Nakamura KK, Laskowitz DT, Valkirs GE, Buechler KF. Early biomarkers of stroke. Clin Chem. 2003;49:1733–9. doi: 10.1373/49.10.1733. [DOI] [PubMed] [Google Scholar]
- 54.Laskowitz DT, Blessing R, Floyd J, White WD, Lynch JR. Panel of biomarkers predicts stroke. Ann N Y Acad Sci. 2005;1053:30–30. doi: 10.1196/annals.1344.051. [DOI] [PubMed] [Google Scholar]
- 55.Tuttolomondo A, Pinto A, Corrao S, Di Raimondo D, Fernandez P, Di Sciacca R, Arnao V, Licata G. Immuno-inflammatory and thrombotic/fibrinolytic variables associated with acute ischemic stroke diagnosis. Atherosclerosis. 2009;203:503–8. doi: 10.1016/j.atherosclerosis.2008.06.030. [DOI] [PubMed] [Google Scholar]
- 56.Cha J-K, Jeong M-H, Kim E-K, Lim Y-J, Ha B-R, Kim S-H, Kim JW. Surface expression of P-selectin on platelets is related with clinical worsening in acute ischemic stroke. J Korean Med Sci. 2002;17:811–6. doi: 10.3346/jkms.2002.17.6.811. [DOI] [PMC free article] [PubMed] [Google Scholar]
- 57.Nadar SK, Lip GYH, Blann AD. Platelet morphology, soluble P selectin and platelet P-selectin in acute ischaemic stroke. The West Birmingham Stroke Project. Thromb Haemost. 2004;92:1342–8. doi: 10.1160/TH04-07-0433. [DOI] [PubMed] [Google Scholar]
- 58.Dambinova S, Khounteev G, Izykenova G, Zavolokov IG, Ilyukhina AY, Skoromets A. Blood test detecting autoantibodies to N-methyl-D-aspartate neuroreceptors for evaluation of patients with transient ischemic attack and stroke. Clin Chem. 2003;49:1752–62. doi: 10.1373/49.10.1752. [DOI] [PubMed] [Google Scholar]
- 59.Khan U, Crossley C, Kalra L, Rudd A, Wolfe CDA, Collinson P, Markus HS. Homocysteine and its relationship to stroke subtypes in a UK black population: the south London ethnicity and stroke study. Stroke. 2008;39:2943–9. doi: 10.1161/STROKEAHA.107.513416. [DOI] [PubMed] [Google Scholar]
- 60.Rodríguez-Yáñez M, Castellanos M, Blanco M, García MM, Nombela F, Serena J, Leira R, Lizasoain I, Dávalos A, Castillo J. New-onset hypertension and inflammatory response/poor outcome in acute ischemic stroke. Neurology. 2006;67:1973–8. doi: 10.1212/01.wnl.0000247064.53130.91. [DOI] [PubMed] [Google Scholar]
- 61.Sienkiewicz-Jarosz H, Gałecka-Wolska M, Bidziński A, Turzyńska D, Sobolewska A, Lipska B, Płaznik ARD. Predictive value of selected biochemical markers of brain damage for functional outcome in ischaemic stroke patients. Neurol Neurochir Pol. 2009;43:126–33. [PubMed] [Google Scholar]
- 62.Sobrino T, Hurtado O, Moro MA, Rodríguez-Yáñez M, Castellanos M, Brea D, Moldes O, Blanco M, Arenillas JF, Leira R, Dávalos A, Lizasoain I, Castillo J. The increase of circulating endothelial progenitor cells after acute ischemic stroke is associated with good outcome. Stroke. 2007;38:2759–64. doi: 10.1161/STROKEAHA.107.484386. [DOI] [PubMed] [Google Scholar]
- 63.Whiteley W, Jackson C, Lewis S, Lowe G, Rumley A, Sandercock P, Wardlaw J, Dennis M, Sudlow C. Inflammatory markers and poor outcome after stroke: a prospective cohort study and systematic review of interleukin-6. PLoS Med. 2009;6:e1000145. doi: 10.1371/journal.pmed.1000145. [DOI] [PMC free article] [PubMed] [Google Scholar]
- 64.Castillo J, Dávalos A, Noya M. Progression of ischaemic stroke and excitotoxic aminoacids. Lancet. 1997;349:79–83. doi: 10.1016/S0140-6736(96)04453-4. [DOI] [PubMed] [Google Scholar]
- 65.Serena J, Leira R, Castillo J, Pumar JM, Castellanos M, Dávalos A. Neurological deterioration in acute lacunar infarctions: the role of excitatory and inhibitory neurotransmitters. Stroke. 2001;32:1154–61. doi: 10.1161/01.str.32.5.1154. [DOI] [PubMed] [Google Scholar]
- 66.Vila N, Castillo J, Dávalos A, Chamorro A. Proinflammatory cytokines and early neurological worsening in ischemic stroke. Stroke. 2000;31:2325–9. doi: 10.1161/01.str.31.10.2325. [DOI] [PubMed] [Google Scholar]
- 67.Dávalos A, Castillo J, Marrugat J, Fernandez-Real JM, Armengou A, Cacabelos P, Rama R. Body iron stores and early neurologic deterioration in acute cerebral infarction. Neurology. 2000;54:1568–74. doi: 10.1212/wnl.54.8.1568. [DOI] [PubMed] [Google Scholar]
- 68.Gentile NT, Seftchick MW, Huynh T, Kruus LK, Gaughan J. Decreased mortality by normalizing blood glucose after acute ischemic stroke. Acad Emerg Med. 2006;13:174–80. doi: 10.1197/j.aem.2005.08.009. [DOI] [PubMed] [Google Scholar]
- 69.Shibazaki K, Kimura K, Okada Y, Iguchi Y, Uemura J, Terasawa Y, Kimura K, Okada Y, Iguchi Y, Uemura J, Terasawa Y, Aoki J. Plasma brain natriuretic peptide as an independent predictor of in-hospital mortality after acute ischemic stroke. Intern Med. 2009;48:1601–6. doi: 10.2169/internalmedicine.48.2166. [DOI] [PubMed] [Google Scholar]
- 70.Rallidis LS, Vikelis M, Panagiotakos DB, Liakos GK, Krania E, Kremastinos DT. Usefulness of inflammatory and haemostatic markers to predict short-term risk for death in middle-aged ischaemic stroke patients. Acta Neurol Scand. 2008;117:415–20. doi: 10.1111/j.1600-0404.2007.00971.x. [DOI] [PubMed] [Google Scholar]
- 71.Undén J, Strandberg K, Malm J, Campbell E, Rosengren L, Stenflo J, Norrving B, Romner B, Lindgren A, Andsberg G. Explorative investigation of biomarkers of brain damage and coagulation system activation in clinical stroke differentiation. J Neurol. 2009;256:72–7. doi: 10.1007/s00415-009-0054-8. [DOI] [PubMed] [Google Scholar]
- 72.Cocho D, Borrell M, Martí-Fàbregas J, Montaner J, Castellanos M, Bravo Y, Montaner J Molina-Porcel L, Belvís R, Díaz-Manera J-A, Martínez-Domeño A, Martínez-Lage M, Millán M, Fontcuberta J, Martí-Vilalta J-L. Pretreatment hemostatic markers of symptomatic intracerebral hemorrhage in patients treated with tissue plasminogen activator. Stroke. 2006;37:996–9. doi: 10.1161/01.STR.0000206461.71624.50. [DOI] [PubMed] [Google Scholar]
- 73.Alvarez-Sabín J, Molina CA, Ribó M, Arenillas JF, Montaner J, Huertas R, Santamarina E, Rubiera M. Impact of admission hyperglycemia on stroke outcome after thrombolysis: risk stratification in relation to time to reperfusion. Stroke. 2004;35:2493–8. doi: 10.1161/01.STR.0000143728.45516.c6. [DOI] [PubMed] [Google Scholar]
- 74.Bang OY, Saver JL, Liebeskind DS, Starkman S, Villablanca P, Salamon N, Buck B, Ali L, Restrepo L, Vinuela F, Duckwiler G, Jahan R, Razinia T, Ovbiagele B. Cholesterol level and symptomatic hemorrhagic transformation after ischemic stroke thrombolysis. Neurology. 2007;68:737–42. doi: 10.1212/01.wnl.0000252799.64165.d5. [DOI] [PubMed] [Google Scholar]
- 75.Katzan IL. Use of tissue-type plasminogen activator for acute ischemic stroke: the cleveland area experience. JAMA. 2000;283:1151–8. doi: 10.1001/jama.283.9.1151. [DOI] [PubMed] [Google Scholar]
- 76.Tanne D. Markers of increased risk of intracerebral hemorrhage after intravenous recombinant tissue plasminogen activator therapy for acute ischemic stroke in clinical practice: the multicenter rt-PA acute stroke survey. Circulation. 2002;105:1679–85. doi: 10.1161/01.cir.0000012747.53592.6a. [DOI] [PubMed] [Google Scholar]
- 77.Uyttenboogaart M, Koch MW, Koopman K, Vroomen PC, Luijckx GJ, De Keyser J. Lipid profile, statin use, and outcome after intravenous thrombolysis for acute ischaemic stroke. J Neurol. 2008;255:875–80. doi: 10.1007/s00415-008-0797-7. [DOI] [PubMed] [Google Scholar]
Associated Data
This section collects any data citations, data availability statements, or supplementary materials included in this article.
Supplementary Materials
Search strategy for extraction of relevant papers for review.
Material S2 Funnel plot and Egger Regression results to assess publication bias associated with results in Figures 2 and 3.
Funnel plot assessing publication bias for studies comparing C-reactive protein (CRP) levels in acute ischaemic stroke and healthy population. Egger Regression intercept probability value = 3.453; standard error = 0.799; P value (two-tailed) = 0.111. Performed using Comprehensive Meta-Analysis version 2 software.
Funnel plot showing association of high admission glucose levels with risk of ischaemic stroke patients developing symptomatic intracerebral haemorrhage (SICH) post-thrombolysis. Egger Regression intercept probability value = 1.167; standard error = 0.610; P value (two-tailed) = 0.128. Performed using Comprehensive Meta-Analysis version 2 software.
List of all biomarkers identified in literature search that met inclusion criteria. Results from RevMan meta-analysis output are detailed, and biomarkers of significance are highlighted in yellow.