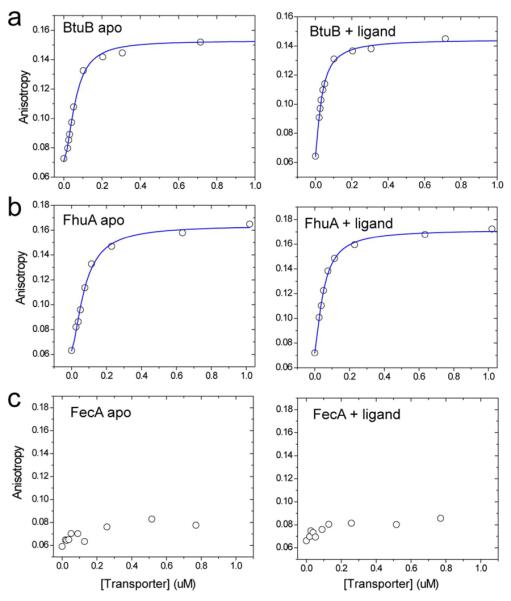
Figure 3.

Fluorescence anisotropy data for the association of TonBΔTMD 194-Bodipy FL to the wild-type transporters a) BtuB b) FhuA and c) FecA. Anistropy measurements were performed both in the absence (left panel) and presence (right panel) of ligand. The solid (blue) traces are fits to the data using Eq. 1, and yeilds the parameters listed in Table 1. Further increases in fluorescence anisotropy are observed when each of these transporters is added to concentrations exceeding 10 μM. But the anisotropy fails to saturate at 100 μM transporter and is likely the result of non-specific association of transporter to the TonBΔTMD preparation.
