Figure 2.
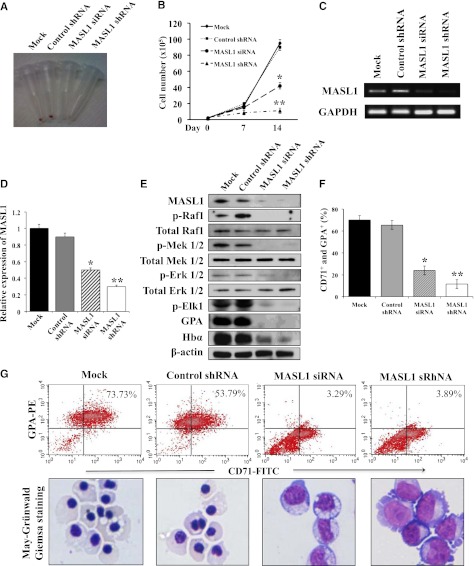
Knockdown of MASL1 reduces erythroid differentiation in human erythroid progenitor CD34+ cells. (A) Cell pellets at day 14 of EPO-induced erythroid differentiation for mock-, control shRNA-, MASL1 siRNA-, or MASL1 shRNA-transfected CD34+ cells. Induced erythroid differentiation is evident by the pink-red cell pellets. (B) Cell counts per mL in culture at day 0, 7, and 14 of EPO-induced erythroid differentiation for mock-, control shRNA-, MASL1 siRNA-, or MASL1 shRNA-transfected CD34+ cells. Error bars represent the SD from 3 individual experiments; *P < .05; **P < .01. (C) Semiquantitative RT-PCR of MASL1 mRNA expression in mock-, control shRNA-, MASL1 siRNA-, or MASL1 shRNA-transfected CD34+ cells at day 14 of EPO-induced differentiation. GAPDH was used as an internal control. (D) qRT-PCR analysis of MASL1 gene expression in mock-, control shRNA-, MASL1 siRNA-, or MASL1 shRNA-transfected CD34+ cells. Mean relative MASL1 expression levels shown as fold induction compared with levels in mock-transfected CD34+ cells at day 14 of EPO-induced differentiation. Values were normalized to the expression level of the housekeeping gene GAPDH. Error bars represent the SD from 3 individual experiments; *P < .05; **P < .01. (E) Western-blot analysis of protein lysates prepared from mock-, control shRNA-, MASL1 siRNA-, or MASL1 shRNA-transfected CD34+ cells at day 14 of EPO-induced differentiation. β-actin was used as an internal control. (F) Flow cytometry analysis of CD71+ and GPA+ expression in mock-, control shRNA-, MASL1 siRNA-, or MASL1 shRNA-transfected CD34+ cells at day 14 of EPO-induced differentiation. Error bars represent the SD from 3 individual experiments; *P < .05; **P < .01. (G) (Top), representative density plots for data presented in F. CD34+ cells were stained with FITC-conjugated anti-CD71 and PE-conjugated anti-GPA monoclonal antibodies. The percent of CD71+ and GPA+ cells is labeled on each density plot. (Bottom), morphology of cells corresponding to flow-cytometric analysis obtained by May-Grünwald-Giemsa staining (original magnification ×20). Results are representative of 3 independent experiments.

