
Figure 3.
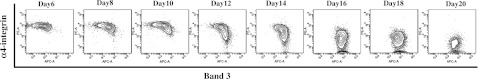
Flow cytometric analysis of in vitro differentiated human erythroid cells. The in vitro cultured erythroblasts at different days were stained with GPA, α4 integrin, and band 3. The plots of α4 integrin vs band 3 of all TER-positive cells are shown. Note the progressive change of α4 integrinhiband3neg population to α4 integrinnegband3hi population during terminal erythroid differentiation.