

Background: miR-663 is related to chemosensitivity in human breast cancer cells.
Results: Overexpression of miR-663 was associated with chemoresistance and accompanied by down-regulation of HSPG2.
Conclusion: Overexpression of hypomethylated miR-663 induces chemoresistance in breast cancer cells by down-regulating HSPG2.
Significance: Learning how miR-663 regulates chemoresistance may provide a potential target for the miRNA-based approach of breast cancer therapy.
Keywords: Breast Cancer, Chemoresistance, DNA Methylation, Gene Regulation, MicroRNA, HSPG2, miR-663
Abstract
MicroRNAs are involved in regulating the biology of cancer cells, but their involvement in chemoresistance is not fully understood. We found that miR-663 was up-regulated in our induced multidrug-resistant MDA-MB-231/ADM cell line and that this up-regulation was closely related to chemosensitivity. In the present study, we aimed to clarify the role of miR-663 in regulating the chemoresistance of breast cancer. MicroRNA microarray and quantitative RT-PCR assays were used to identify differentially expressed microRNAs. Cell apoptosis was evaluated by annexin V/propidium iodide staining, TUNEL, and reactive oxygen species generation analysis. The expression of miR-663 and HSPG2 in breast cancer tissues was detected by in situ hybridization and immunohistochemistry. The potential targets of miR-663 were defined by a luciferase reporter assay. Bisulfite sequencing PCR was used to analyze the methylation status. We found that miR-663 was significantly elevated in MDA-MB-231/ADM cells, and the down-regulation of miR-663 sensitized MDA-MB-231/ADM cells to both cyclophosphamide and docetaxel. The overexpression of miR-663 in breast tumor tissues was associated with chemoresistance; in MDA-MB-231 cells, this chemoresistance was accompanied by the down-regulation of HSPG2, which was identified as a target of miR-663. MDA-MB-231/ADM contained fewer methylated CpG sites than its parental cell line, and miR-663 expression in MDA-MB-231 cells was reactivated by 5-aza-29-deoxycytidine treatment, indicating that DNA methylation may play a functional role in the expression of miR-663. Our findings suggest that the overexpression of hypomethylated miR-663 induced chemoresistance in breast cancer cells by down-regulating HSPG2, thus providing a potential target for the development of an microRNA-based approach for breast cancer therapy.
Introduction
Resistance to chemotherapy remains a major obstacle to effective anti-cancer treatments, resulting in relapse and progression in most malignant tumors. Chemoresistance may be caused by drug efflux by transporters, inactivation by detoxification enzymes, the altered expression of pro-apoptosis proteins, changes in tumor suppressor gene expression, or the increased activity of DNA repair mechanisms (1–3). Recent evidence has demonstrated that microRNAs (miRNAs)5 take part in these processes (4, 5).
miRNAs are small endogenous noncoding RNAs, consisting of 21–24 nucleotides, that are processed from hairpin structures. These small non-coding single-stranded RNAs regulate gene expression at the post-transcriptional level through imperfect base pairing with the 3′-UTR, 5′-UTR, or coding regions of the target messenger RNAs (6, 7). They regulate the biology of cancer cells, including their chemosensitivity (8, 9). Aberrant miRNA expression is involved in a number of molecular pathways related to the mechanisms of chemoresistance. For example, miR-214 regulates ovarian cancer stem cell properties by targeting the p53/Nanog axis (5), and down-regulation of miR-15b or miR-16 results in BCL2 overexpression and multidrug resistance in gastric and breast cancer cells (10). Additionally, a decrease in miR-128 expression leading to Bmi-1 and ABCC5 overexpression is a stem cell-like feature of breast tumor-initiating cells that contributes to chemoresistance in breast cancers (11). Other miRNAs, like miR-663, were recently reported to be down-regulated and were identified to act as tumor suppressors in gastric cancer or as oncogenes in nasopharyngeal carcinoma by directly targeting p21 (12).
In this study, a multiple-drug-resistant cell line, MDA-MB-231/Adriamycin (ADM), was derived from MDA-MB-231 cells by exposing them to gradually increasing concentrations of ADM. We found that miR-663 was up-regulated in MDA-MB-231/ADM and that this up-regulation was correlated with chemoresistance; miR-663 expression was also significantly higher in chemoresistant breast cancer tissue than in chemosensitive samples. We therefore investigated the targets and regulatory mechanisms of miR-663. We predicted and confirmed that heparin sulfate proteoglycan 2 (HSPG2) was targeted by miR-663. Furthermore, we found a difference in DNA methylation between MDA-MB-231/ADM and MDA-MB-231 cells. We suggest that hypomethylated miR-663 overexpression induces chemoresistance in human breast cancer cells by targeting HSPG2.
EXPERIMENTAL PROCEDURES
Cell Cultures and Treatment
Three breast cancer cell lines, MDA-MB-231, BT-474, and MCF-7, were obtained from the American Type Culture Collection (Manassas, VA). MDA-MB-231-derived ADM-resistant sublines were induced by gradual exposure to 0.1–1.2 μm greater increments of ADM in culture medium. All cells were cultured in Dulbecco's modified Eagle's medium (DMEM) containing 10% fetal bovine serum (FBS) in a 5% CO2 atmosphere at 37 °C. An miR-663 mimic (100 nm) was transfected into MDA-MB-231 and BT-474 cells, and miR-663-antisense oligonucleotide (ASO; 200 nm) was transfected into MDA-MB-231/ADM and MCF-7 cells, using Lipofectamine 2000 (Invitrogen) in serum-free DMEM for 6 h. Transfection complexes were prepared according to the manufacturer's instructions (GenePharma Co., Shanghai, China).
Differentially Expressed miRNAs Detected by MicroRNA Microarray
MDA-MB-231 and MDA-MB-231/ADM cells were harvested and subsequently analyzed by miRNA microarray. Briefly, miRNA was separated from 30–50 mg of total RNA isolated using TRIzol reagent (Invitrogen), labeled with the miRCURYTM Hy3TM/Hy5TM Power Labeling kit (Exiqon), and hybridized to the miRCURYTM LNA Array (Exiqon, version 11.0). Scanning was performed with the Axon GenePix 4000B microarray scanner. GenePix pro version 6.0 was used to read the raw image intensity. Unsupervised hierarchical clustering was performed on the miRNA expression profile. Each miRNA present in the database was mapped to a precise location in the human genome using a BLAST search with the default parameters and the maps available from the National Center for Biotechnology Information Human Genome Resources. In addition, to validate our data, we identified the clones corresponding to each miRNA and mapped them to the human genome.
Quantitative Real-time PCR
Total RNA from treated cells was extracted using TRIzol reagent (Invitrogen) and quantified with an ultraviolet spectrophotometer (UVP Inc.) at a wavelength of 260 nm. The miRNA real-time PCR quantification process included two steps: reverse transcription (RT) and real-time PCR. The primers for the mature miR-663 miRNA and U6 snRNA were obtained from Ambion (Austin, TX). First, the stem-loop RT primer was hybridized to an miRNA molecule, followed by reverse transcription with Moloney murine leukemia virus reverse transcriptase. Next, the RT products were quantified using conventional TaqMan PCR (Bio-Rad). The 20-μl RT reaction was incubated at 25 °C for 30 min, followed by 94 °C for 3 min. The reaction then underwent 45 cycles of denaturation at 94 °C for 20 s, annealing at 50 °C for 25 s, and synthesis at 72 °C for 20 s, as recommended by the manufacturer.
Western Blot
Protein extracts were resolved by 8–12% SDS-PAGE, transferred to PVDF membranes, and probed with rabbit monoclonal antibody against HSPG2 (Abcam). Peroxidase-conjugated anti-rabbit IgG (Cell Signaling Technology) was used as the secondary antibody, and the antigen-antibody reaction was visualized by the enhanced chemiluminescence assay (ECL).
Measurement of Cell Viability by Cholecystokinin Octapeptide (CCK8) Assay
All cells were seeded in 96-well plates at a density of 2 × 10⁴ cells/well. After transfection with an miR-663 mimic or ASO for 12 h, docetaxel (DTX) or cyclophosphamide (CTX) was added, and after growth for 24, 48, and 72 h, 10 μl of the CCK8 reagent were added to each well. The plates were incubated for 4 h at 37 °C, and the difference in absorbance between 450 and 590 nm was measured as an indicator of cell viability.
Reactive Oxygen Species (ROS) Generation Analysis by Flow Cytometry
The cells were plated in 6-well plates at a density of 2 × 10⁶ cells/well. The cells were collected and incubated with a 10 μm concentration of the fluorescent probe 2′,7′-dichlorodihydrofluorescein diacetate for 30 min at 37 °C in the dark to measure the accumulation of intracellular ROS. After incubation, the cells were washed with PBS and analyzed within 30 min using a FACScan (BD Biosciences) equipped with an air-cooled argon laser tuned to 488 nm. The specific fluorescence signals corresponding to 2′,7′-dichlorodihydrofluorescein diacetate were collected with a 525-nm band pass filter. A total of 10,000 cells were counted in each assay.
Apoptosis Analysis by Annexin V/Propidium Iodide (PI) Staining
Apoptotic and dead cell counts were performed using FITC-labeled annexin V and PI staining (BD Biosciences), followed by flow cytometry. The cells were gently vortexed and resuspended in binding buffer at a concentration of 3 × 10⁶/ml, and then 100 μl of cell suspension was added to 5 μl of annexin V-FITC and 10 μl of PI and mixed for 15 min in the dark at room temperature. Next, 400 μl of PBS was added to the solution. A FACScan instrument (BD Biosciences) was used to count the cells (1 × 10³) at an excitation wavelength of 490 nm. CellQuest software was used for data collection and processing.
TUNEL Analysis by Fluorescence Microscopy
Apoptotic cells were also visualized by the terminal deoxytransferase-mediated dUTP-biotin nick end labeling (TUNEL) method. This assay was performed using the In Situ Cell Death Detection kit (Roche Applied Science) according to the manufacturer's recommendations. Briefly, cells were fixed with 4% paraformaldehyde for 15 min at room temperature, permeabilized with 25 μg/ml proteinase K for 30 min at 37 °C, and then incubated with 90 μl of labeling solution plus 10 μl of enzyme solution at 37 °C for 2 h. The cells were then washed three times with PBST for 5 min each and incubated with peroxidase at 37 °C for 30 min. Cell images were acquired by fluorescence microscopy (Axio-skop, Zeiss). The number of TUNEL-positive cells per 1000 cells was counted, and the percentage of apoptotic cells was calculated.
Human Apoptosis Antibody Array
We used the RayBio® Human Apoptosis Antibody Array kit (RayBiotech) to simultaneously detect the relative levels of 43 apoptosis-related proteins in lysates of MDA-MB-231 cells with or without miR-663 that were treated with 0.25 μm ADM. The protein extracts were prepared, and 300 μg of each were analyzed according to the kit manufacturer's suggestions.
In Vitro Luciferase Target Report Assay
We constructed PmiR-Check2 plasmids for the miR-663 target HSPG2 3′-UTR (NM_005529) containing the wild type (WT) pmiR-HSPG2 3′-UTR or a mutant pmiR-HSPG2 in which 3 nucleotides within the “seed sequence” were altered. The primers used to generate the pmiR-HSPG2 (968 bp) are as follows: forward primer, 5′-CCGCTCGAGGATGCCACGCTTTGCTGC-3′ (XhoI); reverse primer, 5′-ATAAGAATGCGGCCGCGGCGGGGATAGCACCGTTTA-3′ (NotI). The oligonucleotides were annealed and inserted into the pmiR-Check2 vector (Promega). Site-directed mutagenesis was performed using the QuikChange kit (Stratagene). In the mutant construct, the predicted miR-663 binding site, CCCCGCC, was replaced with CACAGCA. The empty vector (pmiR-Check2) was used as a negative control. HEK 293T cells were transfected with 0.2 μg of the reporter plasmid and 0.01 μg of the pmiR-Check2 control plasmid or a 200 nm concentration of either miR-663 or the NC control (GenePharma Co.) per well in 96-well plates. Following 24 h of incubation, the cells were subjected to a luciferase reporter assay using a luciferase assay system (Promega).
siRNA Preparation and Transfection
To further evaluate whether HSPG2 is the key factor regulated by miR-663, we transfected MDA-MB-231 cells with siRNA-1 to -4 targeting HSPG2 (GenePharma Co.) as follows: HSPG2 siRNA-1, sense (5′-GCCGCUGUAAGAACAAUGUTT-3′) and antisense (5′-ACAUUGUUCUUACAGCGGCTT-3′); HSPG2 siRNA-2, sense (5′-GCCCAUCAGAAUUGAGUCATT-3′) and antisense (5′-UGACUCAAUUCUGAUGGGCTT-3′); HSPG2 siRNA-3, sense (5′-GUGUCGAGAUGGAUUCAAATT-3′) and antisense (5′-UUUGAAUCCAUCUCGACACTT-3′); HSPG2 siRNA-4, sense (5′-CGAGCUAUGUGAAUGCAAUTT-3′) and antisense (5′-AUUGCAUUCACAUAGCUCGTT-3′).
Patients and Tumor Specimens
Thirty-nine patients with primary breast cancer who underwent consecutive neoadjuvant chemotherapy at the Breast Tumor Center of Sun Yat-Sen Memorial Hospital, Sun Yat-Sen University, from October 2003 to July 2010 were enrolled in the present study. The tumor specimens were obtained by core-needle biopsy prior to starting therapy. Informed consent was obtained from all patients following a protocol approved by the Ethics Committee of the Sun Yat-Sen Memorial Hospital, Sun Yat-Sen University.
The chemotherapy regimen consisted of four 21-day cycles of AC (doxorubicin, 60 mg/m2 on day 1; CTX, 600 mg/m2 on day 1) followed by four 21-day cycles of DTX (100 mg/m2 on day 1) or six 21-day cycles of TAC (DTX, 75 mg/m2 on day 1; doxorubicin, 50 mg/m2 on day 1; CTX, 500 mg/m2 on day 1). Tumor size was evaluated with ultrasound or computerized tomography scans at base line, 14–21 days after the last cycle of AC, and 21 days after the last cycle of DTX treatment. The effect of chemotherapy on the tumor was assessed as the three-dimensional volume reduction rate or tumor response rate. Tumor response was evaluated by the Response Evaluation Criteria in Solid Tumors (RECIST), which is defined as follows: complete response (CR; disappearance of the disease), partial response (PR; ≥30% reduction), stable disease (SD; <30% reduction or ≤20% enlargement), or progressive disease (PD; ≥20% enlargement).
In Situ Hybridization
MiR-663 expression was examined in 39 formalin-fixed paraffin-embedded breast cancer tissues by in situ hybridization. Briefly, the tissue slides were prehybridized in a hybridization solution (Boster Co., Wuhan, China) at 59 °C for 2 h. Ten picomoles of 5′-digoxigenin-labeled miRCURYTM locked nucleic acid detection probes (Exiqon, Denmark) complementary to miR-663 or scrambled microRNA were added and hybridized for 16 h at a temperature of 21 °C below the calculated melting temperature of the locked nucleic acid probe. After stringent washing, a mouse monoclonal anti-digoxigenin antibody (Abcam) and alkaline phosphatase-streptavidin (Zhongshan Golden Bridge Biotechnology Co., Beijing, China) were used to detect the biotinylated probes. The slides were counterstained with nuclear fast red (Enzo Diagnostics) to visualize the nuclei and then mounted in aqueous mounting medium (Maixin Biotechnology Co., Fuzhou, China). Then tissue sections were scored manually semiquantitatively for cytoplasmic staining. The dominant staining intensity in tumor cells was scored as follows: 0, negative; 1, weak; 2, intermediate; 3, strong.
Immunohistochemistry
Immunohistochemical analysis was performed as reported (13). The paraffin sections were incubated with primary antibody against HSPG2 (1:150; Abcam), For negative control, isotype-matched antibody was applied. Immunohistochemical scoring was performed without prior knowledge of the clinical response. Tissue sections were observed under a ZEISS AX10-Imager A1, and all pictures were captured using AxioVision version 4.7 microscopy software.
DNA Methylation Analysis
CpG islands were predicted using the UCSC Genome Browser. The miR-663 promoter is located in a region with significant CpG dinucleotide enrichment. Genomic DNA from MDA-MB-231 and MDA-MB-231/ADM cells was prepared using the MethylDetector kit (Active Motif Co.). The PCR primers were designed as follows with Methyl Primer Express version 1.0 software: forward primer, 5′-ATAACCAGCCACCTTGATCTG; reverse primer, 5′-ATTCGCCAATGACAAGACG. The PCR products were cloned using a T4 ligase cloning kit (Takara), and single clones were sent for sequencing. miR-663 expression in MDA-MB-231 cells with or without 3 mm 5-aza-2′-deoxycytidine (5-Aza-dC; Sigma) treatment for 72 h was analyzed by qRT-PCR.
Statistical Analysis
The data are expressed as the mean ± S.D. of at least three independent experiments. Student's t tests and one-way analysis of variance were used to test the differences between the means, whereas the χ2 test was applied to compare percentages. All p values are two-sided, and a value of 0.05 was considered to be statistically significant. All statistical calculations were performed using SPSS software (version 13.0; SPSS).
RESULTS
The Establishment of the ADM-resistant Cell Line MDA-MB-231
Over a period of 6 months, MDA-MB-231 cells in culture were continuously exposed to increasing concentrations of ADM. As shown in Fig. 1A, the IC50 of ADM in the MDA-MB-231 cell line was 0.09 μm, and the exposure dose was progressively increased by 0.1–1.2 μm every 21–28 days until seven doses had been applied. The IC50 of ADM in the established MDA-MB-231/ADM was 0.84 μm. The sensitivities of MDA-MB-231 and MDA-MB-231/ADM cells to various concentrations of CTX and DTX were determined by the CCK8 assay. The IC50 values for CTX and DTX were 23.86 and 70.04 nm, respectively, in MDA-MB-231 cells and 423.26 and 760 nm, respectively, in MDA-MB-231/ADM cells. Taken together, these data indicate that MDA-MB-231/ADM is a multiple-drug-resistant cell line.
FIGURE 1.

The up-regulation of miR-663 expression in chemoresistant breast cancer cell lines. A, establishment of the ADM-resistant MDA-MB-231 (MDA-MB-231/ADM) cell lines. The viability of MDA-MB-231 and MDA-MB-231/ADM cells at various concentrations of CTX and DTX was determined by a CCK8 assay (*, p < 0.001 compared with MDA-MB-231). B, miR-663 expression is up-regulated in MDA-MB-231/ADM cells. qRT-PCR for miR-663 shows that miR-663 expression is the lowest in MDA-MB-231 cells. The x axis labels (1–7) represent the different generations of MDA-MB-231/ADM selection. miR-663 expression was dramatically increased, by more than 5-fold, in the seventh generation of MDA-MB-231/ADM compared with MDA-MB-231 (*, p < 0.05; **, p < 0.01 compared with the MDA-MB-231 group). C, miR-663 expression is up-regulated in MCF-7 cells. miR-663 expression detected by qRT-PCR is the lowest in BT-474 cells. The level of miR-663 expression in MCF-7 was almost 5-fold higher than that in BT-474 cells (*, p < 0.01 compared with BT-474). Error bars, S.D.
miR-663 miRNA Is Up-regulated in MDA-MB-231/ADM Cells
Microarray analysis was used to compare the expression profiles of 703 miRNAs in MDA-MB-231/ADM and MDA-MB-231. Eight miRNAs were down-regulated by more than 2-fold, whereas 11 miRNAs were up-regulated by more than 2-fold (Table 1). The greatest up-regulation was observed for miR-663, which exhibited a 7.26-fold increase in expression in MDA-MB-231/ADM compared with the parental line. We then measured the miR-663 levels in the different generations of MDA-MB-231/ADM using qRT-PCR. miR-663 expression was dramatically increased, more than 5-fold, in the seventh generation of MDA-MB-231/ADM compared with MDA-MB-231, implying that miR-663 increased sharply under stringent drug stress and was related to drug sensitivity (Fig. 1B). In addition, we also measured the miR-663 levels in other breast tumor cell lines, including BT-474, MDA-MB-436, SKBR3, BT-549, and MCF-7. Because the level of miR-663 in MCF-7 was almost 5-fold higher than that in BT-474, we chose this pair of cell lines, MCF-7 and BT-474, to confirm our hypothesis (Fig. 1C).
TABLE 1.
The 11 most up-regulated miRNAs in MDA-MB-231/ADM (1) relative to MDA-MB-231 (2) identified by microRNA arrays
| MicroRNA name | 1, average | 2, average | 1, normalized | 2, normalized | 1/2 ratio |
|---|---|---|---|---|---|
| hsa-miR-663 | 4455 | 916 | 0.51 | 0.07 | 7.26 |
| hsa-miR-923 | 5938 | 1696 | 0.67 | 0.13 | 5.22 |
| hsa-miR-423-5p | 935 | 318 | 0.11 | 0.02 | 4.39 |
| hsa-miR-638 | 6422 | 3201 | 0.73 | 0.24 | 2.99 |
| hsa-miR-628-5p | 423 | 219 | 0.05 | 0.02 | 2.89 |
| hsa-miR-22 | 351 | 220 | 0.04 | 0.02 | 2.38 |
| hsa-miR-491-5p | 310 | 198 | 0.04 | 0.02 | 2.33 |
| hsa-miR-744 | 1479 | 947 | 0.17 | 0.07 | 2.33 |
| hsa-miR-768-5p | 241 | 162 | 0.03 | 0.01 | 2.22 |
| hsa-miR-765 | 1314 | 973 | 0.15 | 0.07 | 2.02 |
| hsa-miR-20a | 798 | 594 | 0.09 | 0.05 | 2.00 |
miR-663 Modulated the Chemoresistance of Human Breast Cancer Cells
We further investigated whether inhibiting or increasing miR-663 expression could modulate cell survival and the sensitivity of MDA-MB-231 and MDA-MB-231/ADM cells to chemotherapeutic drugs, including ADM, CTX, and DTX, all of which are currently used for the treatment of breast cancer. Following transfection of an miR-663 mimic into MDA-MB-231, we treated the cells with a series of concentrations of ADM, CTX, or DTX. The effect of miR-663 on the chemoresistance of MDA-MB-231 is shown in Fig. 2A. These results imply that the introduction of miR-663 notably reduced the chemosensitivity of MDA-MB-231 cells to ADM, CTX, and DTX. In addition, the inhibition of MDA-MB-231/ADM cell growth by the chemotherapeutic drugs was significantly increased by transfection with miR-663 ASO (Fig. 2B). To further investigate the function of miR-663, we also examined the toxicity of ADM, CTX, and DTX in BT-474 and MCF-7 cells, in which miR-663 was differentially expressed. BT-474 cells expressing an miR-663 mimic increased viability in response to treatment with ADM, CTX, or DTX compared with the control group (Fig. 2C), whereas MCF-7 cells transfected with miR-663 ASO exhibited significantly decreased viability in response to chemotherapeutic drugs (Fig. 2D).
FIGURE 2.

miR-663 modulates the resistance of human breast cancer cells to chemotherapeutic drugs. Following untransfection (UN), mock transfection (mock), or transfection with either the negative control RNA (NC) or miR-663 mimic (miR-663), MDA-MB-231 cells and BT-474 cells were treated with a series of concentrations of ADM, CTX, and DTX, respectively. The effect of the miR-663 mimic on the viability of MDA-MB-231 cells (A) and BT-474 cells (C) in response to these three chemotherapeutic drugs was determined using the CCK8 assay (*, p < 0.05; **, p < 0.01 compared with the control group). Following untransfection, mock transfection, or transfection with either the negative control RNA or miR-663 ASO, MDA-MB-231/ADM cells and MCF-7 cells were treated with a series of concentrations of ADM, CTX, and DTX. The effect of miR-663 ASO on the viability of MDA-MB-231/ADM (B) and MCF-7 cells (D) in response to these three chemotherapeutic drugs was determined using the CCK8 assay (*, p < 0.05; **, p < 0.01 compared with the control group). Error bars, S.D.
miR-663 Regulates ROS and Apoptosis in Human Breast Cancer Cells
To explore the effects of miR-663 on apoptosis, MDA-MB-231 cells were transfected with an miR-663 mimic and subsequently treated with CTX (5 nm) or DTX (80 nm). In parallel, MDA-MB-231/ADM cells were transfected with miR-663 ASO and then treated with CTX (30 nm) and DTX (450 nm). The cells were collected to assess the ROS levels by FACS and the apoptosis ratios by annexin V/PI staining and the TUNEL assay. The results demonstrated that miR-663 ASO induced cell apoptosis, accompanied by an increase in ROS level (Fig. 3, A and B). We also detected the effects of the miR-663 mimic and of miR-663 ASO on apoptosis and the ROS level in BT-474 cells and MCF-7 cells, respectively, upon treatment with CTX or DTX. Transfection with an miR-663 mimic notably decreased the apoptotic ratio and ROS levels of BT-474 cells undergoing treatment with CTX or DTX (Fig. 4A) compared with the control group, whereas transfection with miR-663 ASO increased the apoptotic ratio and ROS levels of MCF-7 cells (Fig. 4B) undergoing treatment with chemotherapeutic drugs. We further detected a change in apoptosis-related proteins after treatment of MDA-MB-231 with the miR-663 mimic, using the RayBio® human apoptosis antibody array. As shown in Fig. 3C, MDA-MB-231 cells transfected with the miR-663 mimic exhibited an obvious down-regulation of several pro-apoptosis proteins, including Bad, HTRA, IGFBP2, and p27, indicating that miR-663 suppresses the apoptotic response to chemotherapeutic chemicals in breast cancer cells.
FIGURE 3.

miR-663 regulates ROS level and apoptosis in human breast cancer cells. MDA-MB-231 cells were transfected with miR-663 and then treated with CTX (5 nm) or DTX (80 nm). MDA-MB-231/ADM cells were transfected with miR-663 ASO and then treated with CTX (30 nm) or DTX (450 nm). The ROS levels of MDA-MB-231 cells (A) and MDA-MB-231/ADM cells (B) were determined by FACS, and apoptotic cells were detected by annexin V/PI and TUNEL staining (*, p < 0.01 compared with the untransfected (Un) group). C, the levels of apoptosis-related proteins in MDA-MB-231 transfected with miR-663 undergoing ADM treatment were measured using the RayBio® human apoptosis antibody array. The -fold changes in each pro-apoptosis protein, including Bad, HTRA, IGFBP2, and p27, were calculated (*, p < 0.01 compared with the untransfected MDA-MB-231 group). NC, negative control. Error bars, S.D.
FIGURE 4.

miR-663 regulates apoptosis in BT-474 and MCF-7 cells. BT-474 cells were transfected with an miR-663 mimic and then treated with CTX and DTX. MCF-7 cells were transfected with miR-663 ASO and then treated with CTX and DTX. The ROS levels of BT-474 cells (A) and MCF-7 cells (B) were determined by FACS, and apoptotic cells were detected by annexin V/PI and TUNEL staining. Un, untransfected; NC, negative control.
miR-663 Regulates the Chemosensitivity of Human Breast Cancer Cells by Targeting HSPG2
Candidate miR-663 targets were predicted with TargetScan sequence analysis software, and HSPG2 was chosen for further examination (Fig. 5A). To further identify whether HSPG2 in breast cancer cells responded to miR-663 through direct interactions with its 3′-UTR, we cloned the WT 3′-UTR of the putative miR-663 target (Fig. 5B, WT 3′-UTR (Wt)) or mutated sequences (mut1 (Mu-1), mut2 (Mu-2), mut3 (Mu-3), mut1+mut2 (Mu-1+2), mut1+mut3 (Mu-1+3), mut2+mut3 (Mu-2+3), mut1+mut2+mut3 (Mu-1+2+3)) into a reporter plasmid downstream of the luciferase gene. These plasmids, together with miR-663 or miR-control and the Renilla luciferase vector (pRL-TK) (internal control), were transiently transfected into MDA-MB-231 cells. The Dual-Luciferase reporter assay system was used to detect luciferase expression 48 h after transfection. The results showed that the miR-663 mimic attenuated the fluorescence driven by the WT 3′-UTR by more than 2-fold compared with the negative control, whereas the mut1+mut2+mut3 3′-UTR mutant was not affected by miR-663 (Fig. 5B). To further confirm the potential role of miR-663 in the regulation of HSPG2, we evaluated the HSPG2 mRNA and protein expression levels in MDA-MB-231 and MDA-MB-231/ADM cells in which the miR-663 mimic was introduced or miR-663 ASO treatment had suppressed the endogenous miR-663 activity. As shown in Fig. 5, C and D, the up-regulation of endogenous miR-663 by the miR-663 mimic led to a notable decrease in the HSPG2 mRNA and protein levels, whereas miR-663 ASO transfection up-regulated the HSPG2 mRNA and protein levels. This inverse correlation between miR-663 and HSPG2 protein and mRNA levels provided sufficient evidence to support our conclusions. Collectively, these data demonstrated that HSPG2 was a direct target of miR-663 in breast cancer cells.
FIGURE 5.

miR-663 regulates the chemosensitivity of breast cancer cells by targeting HSPG2. A, the possible targets of miR-663, which has a GC-rich seed sequence, were chosen using TargetScan. Three seed sites (7-bp sequences) in miR-663 were complementary to the 3′-UTR of HSPG2. B, HEK 293T cells transfected with miR-663 or NC compared with those transfected with pmiR-Check2-HSPG2 wild type or mutant (*, p < 0.01 compared with pmiR). C, the HSPG2 mRNA expression levels in MDA-MB-231 cells transfected with an miR-663 mimic and MDA-MB-231/ADM cells transfected with miR-663 ASO were verified by qRT-PCR (*, p < 0.01 compared with the control group). D, the HSPG2 protein expression levels in MDA-MB-231 cells transfected with an miR-663 mimic and MDA-MB-231/ADM cells transfected with miR-663 ASO were verified by Western blotting. E, qRT-PCR for HSPG2 mRNA expression and Western blotting for HSPG2 protein expression in MDA-MB-231/ADM cells that were untransfected (Un) or transfected with NC-siRNA or one of the four HSPG2-siRNAs (*, p < 0.01 compared with the untransfected group). F, the effect of HSPG2 siRNAs on the viability of MDA-MB-231/ADM cells during ADM treatment was determined using the CCK8 assay (*, p < 0.01 compared with the untransfected group). The effect of HSPG2-siRNAs on apoptosis in MDA-MB-231/ADM cells (G) and BT474 cells (H) undergoing ADM treatment was determined by annexin V/PI staining, respectively (*, p < 0.01 compared with the untransfected group). Error bars, S.D.
To elucidate the functional contributions of HSPG2 to the chemosensitivity of breast cancer cells, we transfected MDA-MB-231 cells with siRNA1 to -4 to target HSPG2. The siRNA1 and siRNA4 sequences silenced the HSPG2 gene significantly (Fig. 5E). We examined the viability and apoptosis of HSPG2 siRNA-transfected MDA-MB-231 cells in response to treatment with ADM. The CCK8 assay and apoptosis analysis showed that the chemoresistance of MDA-MB-231 cells increased upon HSPG2 knockdown with siRNA (Fig. 5, F and G). Similar results were observed in BT-474 cells transfected with HSPG2 siRNA (Fig. 5H).
miR-663 Overexpression in Breast Cancer Tissue Correlates with Chemoresistance
To investigate whether miR-663 expression is related to chemoresistance in patients with breast cancer, we enrolled 39 breast cancer patients who underwent six or eight cycles of neoadjuvant chemotherapy and exhibited CR or PR, defined as chemosensitive, or PD, defined as chemoresistant, according to RECIST criteria. We employed in situ hybridization with a digoxigenin-labeled locked nucleic acid miR-663 probe to detect miR-663 expression in breast cancer tissues biopsied prior to neoadjuvant chemotherapy and analyzed the correlation between miR-663 level and clinical response to chemotherapy. A scrambled oligonucleotide was used to demonstrate the specificity of the hybridization. As shown in Fig. 6A and Table 2, miR-663 expression was up-regulated in chemoresistant breast cancer tissues but reduced in chemosensitive tissues (p < 0.001). Because HSPG2 is the target of miR-663, we further investigated the expression of HSPG2 in breast cancer tissues using immunohistochemistry. In contrast to miR-663, HSPG2 expression was higher in the chemosensitive than in the chemoresistant breast tumor tissues (Fig. 6A). We also investigated the correlation between miR-663 expression and chemoresistance using real-time RT-PCR in 15 patients with breast cancer (Table 3). Similarly, we found that miR-663 expression was significantly up-regulated in chemoresistant tumor tissues (Fig. 6B, p < 0.001). In addition, miR-663 expression was significantly positively correlated to tumor size (r = 0.425, p = 0.003) and has a strong negative relationship with Ki67 (r = 0.463, p = 0.042) but no significant correlations between miR-663 expression and ER, PR, or Her2 level (Table 2). The above results indicated that the overexpression of miR-663 in tumor tissues was associated with chemoresistance and the poor survival of some patients with breast cancer.
FIGURE 6.

miR-663 overexpression in breast cancer tissue correlates with chemoresistance. A, representative images of in situ hybridization for miR-663 and immunohistochemical staining for HSPG2 in breast cancer tissues. Scrambled probe and isotype IgG at the same concentration was used as a negative control for in situ hybridization and immunohistochemical staining, respectively. miR-663 was overexpressed in chemoresistant breast cancer tissues but reduced in chemosensitive tissues. Strong miR-663 staining, shown as navy blue grains widely distributed in the cytoplasm, was observed in the chemoresistant samples, whereas weakly positive staining scattered throughout the cytoplasm was observed in the chemosensitive samples. HSPG2 expression was higher in chemosensitive than in chemoresistant breast tumor tissues. B, miR-663 expression was reduced in chemosensitive breast cancer tissues but up-regulated in chemoresistant tissues, as shown by real-time RT-PCR with an miR-663-specific primer in samples from 15 patients with breast cancer.
TABLE 2.
Correlation of miR-663 expression with clinico pathological status in 39 patients with breast cancer
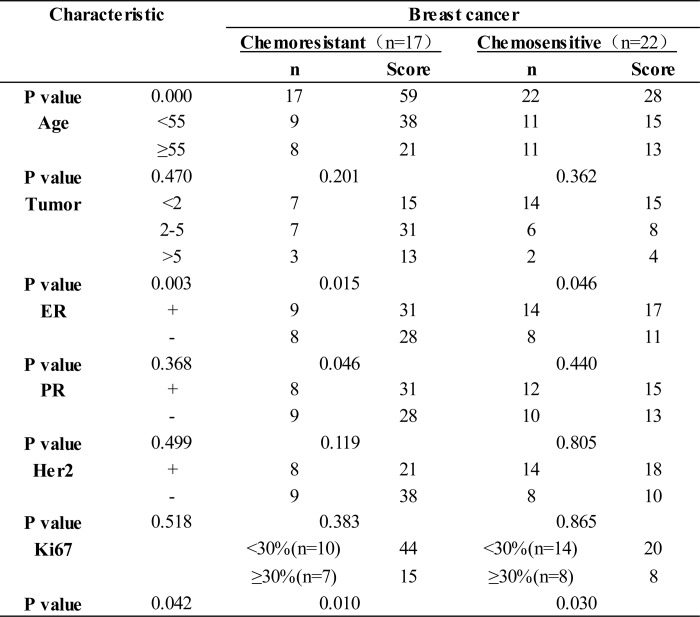
TABLE 3.
Correlation of clinical response and pretherapy miR-663 expression detected by real-time RT-PCR in 15 patients with breast cancer
| Patient no. | Age | Tumor size (pretherapy) | T tumor size (after therapy) | Chemotherapy regimen | miR-663 expression | Clinical response |
|---|---|---|---|---|---|---|
| years | cm2 | cm2 | ||||
| 1 | 46 | 4.5 × 5.0 | 1.6 × 1.2 | TCE | 1 | PR |
| 2 | 45 | 4.3 × 3.5 | 1.4 × 1.2 | TCE | 10.97 | PR |
| 3 | 36 | 3.0 × 3.3 | 1.0 × 0.8 | TCE | 5.63 | PR |
| 4 | 62 | 4.0 × 3.2 | 0 | TCE | 1.89 | CR |
| 5 | 42 | 2.8 × 1.6 | 1.0 × 0.5 | TCE | 3.51 | PR |
| 6 | 46 | 3.1 × 2.0 | 0.8 × 0.5 | TCE | 7.79 | PR |
| 7 | 38 | 2.6 × 2.0 | 1.5 × 1.0 | TCE | 31.83 | PR |
| 8 | 54 | 3.0 × 3.5 | 1.0 × 0.8 | TCE | 19.2 | PR |
| 9 | 59 | 3.3 × 4.2 | 2.0 × 1.5 | TCE | 26.07 | PR |
| 10 | 68 | 5.0 × 6.0 | 2.0 × 2.0 | TCE | 13.6 | PR |
| 11 | 30 | 4.5 × 3.2 | 3.0 × 3.8 | TCE | 33.32 | SD |
| 12 | 36 | 3.2 × 3.2 | 3.0 × 2.6 | TCE | 18.2 | SD |
| 13 | 60 | 2.8 × 3.6 | 2.0 × 3.0 | TCE | 81.09 | SD |
| 14 | 44 | 3.8 × 3.2 | 3.0 × 2.8 | TCE | 38.18 | SD |
| 15 | 42 | 3.6 × 2.4 | 3.8 × 3.0 | TCE | 167.68 | PD |
DNA Methylation Regulates the Expression of miR-663
We collected 10 colonies from methylation-filtered MDA-MB-231 and MDA-MB-231/ADM cells. The bacterial colonies were maintained as suspensions in 10% sterile glycerol at 4 °C. The miR-663 clones were selected by colony PCR on randomly selected colonies from each sample. Bisulfite sequencing PCR was used to analyze the methylation status of the chemoresistant cell line and the parental cell line. MDA-MB-231/ADM contained fewer methylated CpG sites than did the parental cell line MDA-MB-231 (Fig. 7A). Furthermore, qRT-PCR showed that the miR-663 expression level in MDA-MB-231 cells was increased 3–4-fold by 5-Aza-dC treatment (Fig. 7B), indicating that DNA methylation may play a functional role in the expression of miR-663.
FIGURE 7.

DNA methylation regulates the expression of miR-663. A, the methylation status of CpG islands in the miR-663 promoters of MDA-MB-231 cells and MDA-MB-231/ADM cells was detected by bisulfite sequencing PCR analysis. Each row of circles represents a single clone, and each circle represents a single CpG site. Open circles represent unmethylated cytosine; filled circles represent methylated cytosine. B, the effects of 5-Aza-dC on miR-663 expression in MDA-MB-231 cells, as determined by qRT-PCR (*, p < 0.01 compared with the control group). Error bars, S.D.
DISCUSSION
Individualized management for tumor patients is one of the most important therapeutic principles. The implementation of adjuvant therapy, hormonal therapy, and chemotherapy has had a major impact on the disease-free survival and overall survival of breast cancer patients (14). Unfortunately, many patients with breast cancer who are diagnosed and treated properly still suffer from recurrence and ultimately die of this disease (15). The essential factors that cause recurrence remain unknown. Researchers have long searched for prognosis-related markers. For many years, tumor size was the only criterion available with which to classify breast cancer stage. Later, a histological classification system and TNM staging information were developed. A more recent approach to classifying breast cancer subgroups is based on gene expression profiling. However, this subclassification has proven to be limited because it is unable to define subgroups with similar prognostic and therapeutic characteristics. Abnormal miRNA expression has been reported in many types of cancer, and much attention has been focused on understanding the roles of miRNAs in modulating cancer development (16). miRNAs were found to be useful biomarkers of tumorigenesis (17–19).
miR-663, which is located at human chromosome 20q11.1, is associated with cellular senescence, immunity, and cancer. This miRNA is increasingly thought to act as a tumor suppressor, and it was shown to be down-regulated in human gastric cancer cells and to induce growth arrest through mitotic catastrophe (10). miR-663 is also reported to be up-regulated in nasopharyngeal carcinoma cells and was determined to function as an oncogene in NPC by directly targeting p21 (12). However, the role of miR-663 in breast cancer, especially its correlation with chemosensitivity, has been unclear. In this paper, we identified miR-663 as the most pronouncedly up-regulated miRNA in MDA-MB-231/ADM cells compared with MDA-MB-231 cells. By modulating the miR-663 level in breast cancer cells, we revealed that miR-663 mediated the chemoresistance of breast cancer cells through the anti-apoptosis pathway. These observations were extended to clinical samples of breast cancer, where we found a positive correlation between miR-663 expression level and chemoresistance. In addition, it was exhibited that miR-663 expression was positively significantly associated with tumor size but negatively related to Ki67. In our opinion, the possible explanation is cancer stem cell percentage. As we know, the “cancer stem cell” is very powerful in self-renewal, differentiation, and drug resistance, but always in the G0 stage, during which it seldom proliferates. The asymmetric division is another key characteristic that involves stem cell division to new daughter stem cell and cells in different proliferation periods at the same time. Thus, the higher percentage of “stem cell” is the lower ratio of proliferation index. In fact, high Ki67 expression only used to define a subset of chemosensitive tumors within ER-positive breast cancer. Moreover, several studies show that it is not powerful enough to successfully address interaction between Ki67 and treatment efficacy in ER-positive breast cancer and is not predictive for cyclophosphamide and methotrexate (20). Here, it is worth noting that miR-663 might be a biomarker of chemosensitivity that is independent of ER, PR, and Her2 expression.
In our study, we detected a change in apoptosis-related proteins after treatment of MDA-MB-231 with the miR-663 mimic, using the RayBio® Human Apoptosis Antibody Array. It exhibited an obvious down-regulation of several pro-apoptosis proteins, including Bad, HTRA, IGFBP2, and p27, indicating that miR-663 suppresses the apoptotic response to chemotherapeutic chemicals in breast cancer cells. Then we predicted candidate miR-663 targets with TargetScan sequence analysis software and a luciferase reporter assay, and HSPG2 was chosen for further examination. Our findings from cell lines and clinical samples suggest that the overexpression of miR-663 induced chemoresistance in breast cancer cells by down-regulating HSPG2. miR-663 was overexpressed in chemoresistant breast cancer tissues but reduced in chemosensitive tissues, and on the contrary, HSPG2 expression was higher in chemosensitive than in chemoresistant breast tumor tissues. This inverse correlation between miR-663 and HSPG2 protein and mRNA levels provided sufficient evidence to indicate that HSPG2 was a target of miR-663 in breast cancer cells.
In addition, we delved into the mechanisms underlying the transcriptional regulation of miR-663. Common transcriptional regulation modes include DNA methylation (21), histone modification, and transcription factor binding (22). DNA methylation is one of the major epigenetic modification mechanisms that regulate gene expression, genomic imprinting, developmental timing, and tumorigenesis (23, 24). The methylation of CpG dinucleotides often results in transcriptional inactivation, which is important for the normal development or differentiation of various tissues. In this study, we compared the methylation levels of the CpG islands immediately upstream of pre-miR-663 in MDA-MB-231 and MDA-MB-231/ADM cells and found that there were fewer methylated CpG sites in the putative miR-663 promoter in MDA-MB-231/ADM cells. Furthermore, 5-Aza-dC treatment notably increased the miR-663 expression level in MDA-MB-231 cells, indicating that miR-663 is silenced in MDA-MB-231 cells through promoter hypermethylation. These results indicated that chemotherapy reagents could result in the demethylation of the miR-663 promoter and the up-regulation of the miR-663 expression level in breast cancer cells. This increase in miR-663 level mediates chemoresistance in breast cancer cells.
In summary, we identified the function, target, and upstream regulatory mechanism of miR-663, both in cell lines and in clinical samples, providing evidence that the demethylation of the miR-663 promoter induces miR-663 expression and that miR-663 targets HSPG2 to mediate the chemotherapeutic resistance of breast cancer cells. We extended the current knowledge by highlighting the role of miR-663 in the chemoresistance of breast cancer for the first time. Although chemotherapy is the backbone of systemic treatment for most malignancies, its efficacy is hindered by the development of drug resistance. Therefore, targeting the mechanisms involved in the chemoresistance of breast cancer will improve treatment efficacy. It is logical to predict that miR-663 could be a potential biomarker and that the inhibition of miR-663 may be a candidate strategy for new breast cancer therapies.
This work was supported by 973 Projects from the Ministry of Science and Technology of China Grants 2010CB912800 and 2011CB504203; National Science Foundation of China Grants 81230060, 81261140373, 81072176, 81072177, and 30800486; National S&T Major Special Project on New Drug Innovation of China Grant 2011ZX09102-010-02; Foundation of Ministry of Education of the People's Republic of China Grant 20120171110075; Science Foundation of Guangdong Province Grant S2012030006287; the special financial grant from the China Postdoctoral Science Foundation (Grants 201003379 and 201104379); Guangdong Natural Science Foundation Grant 10151503102000019; and Science and Technology Foundation of the Guangdong Province Grants 2008B030301238 and 2008B030301243.
- miRNA
- microRNA
- ADM
- Adriamycin
- HSPG2
- heparin sulfate proteoglycan 2
- ASO
- antisense oligonucleotide
- DTX
- docetaxel
- CTX
- cyclophosphamide
- CCK8
- cholecystokinin octapeptide
- ROS
- intracellular reactive oxygen species
- PI
- propidium iodide
- CR
- complete response
- PR
- partial response
- SD
- stable disease
- PD
- progressive disease
- 5-Aza-dC
- 5-aza-2′-deoxycytidine
- qRT-PCR
- quantitative RT-PCR
- AC
- doxorubicin, cyclophosphamide
- TAC
- docetaxel, doxorubicin, cyclophosphamide
- TCE
- topotecan, cyclophosphamide, and etoposide.
REFERENCES
- 1. Naci D., El Azreq M. A., Chetoui N., Lauden L., Sigaux F., Charron D., Al-Daccak R., Aoudjit F. (2012) α2β1 integrin promotes chemoresistance against doxorubicin in cancer cells through extracellular signal-regulated kinase (ERK). J. Biol. Chem. 287, 17065–17076 [DOI] [PMC free article] [PubMed] [Google Scholar]
- 2. Gogna R., Madan E., Kuppusamy P., Pati U. (2012) Chaperoning of mutant p53 protein by wild-type p53 protein causes hypoxic tumor regression. J. Biol. Chem. 287, 2907–2914 [DOI] [PMC free article] [PubMed] [Google Scholar]
- 3. Stark M., Bram E. E., Akerman M., Mandel-Gutfreund Y., Assaraf Y. G. (2011) Heterogeneous nuclear ribonucleoprotein H1/H2-dependent unsplicing of thymidine phosphorylase results in anticancer drug resistance. J. Biol. Chem. 286, 3741–3754 [DOI] [PMC free article] [PubMed] [Google Scholar]
- 4. Elhassan M. O., Christie J., Duxbury M. S. (2012) Homo sapiens systemic RNA interference-defective-1 transmembrane family member 1 (SIDT1) protein mediates contact-dependent small RNA transfer and microRNA-21-driven chemoresistance. J. Biol. Chem. 287, 5267–5277 [DOI] [PMC free article] [PubMed] [Google Scholar]
- 5. Xu C. X., Xu M., Tan L., Yang H., Permuth-Wey J., Kruk P. A., Wenham R. M., Nicosia S. V., Lancaster J. M., Sellers T. A., Cheng J. Q. (2012) MicroRNA miR-214 regulates ovarian cancer cell stemness by targeting p53/Nanog. J. Biol. Chem. 287, 34970–34978 [DOI] [PMC free article] [PubMed] [Google Scholar] [Retracted]
- 6. Corcoran C., Friel A. M., Duffy M. J., Crown J., O'Driscoll L. (2011) Intracellular and extracellular microRNAs in breast cancer. Clin. Chem. 57, 18–32 [DOI] [PubMed] [Google Scholar]
- 7. Kitade Y., Akao Y. (2010) MicroRNAs and their therapeutic potential for human diseases. MicroRNAs, miR-143 and -145, function as anti-oncomirs and the application of chemically modified miR-143 as an anti-cancer drug. J. Pharmacol. Sci. 114, 276–280 [DOI] [PubMed] [Google Scholar]
- 8. Majumder S., Jacob S. T. (2011) Emerging role of microRNAs in drug-resistant breast cancer. Gene Expr. 15, 141–151 [DOI] [PMC free article] [PubMed] [Google Scholar]
- 9. Nair V. S., Maeda L. S., Ioannidis J. P. (2012) Clinical outcome prediction by microRNAs in human cancer. A systematic review. J. Natl. Cancer Inst. 104, 528–540 [DOI] [PMC free article] [PubMed] [Google Scholar]
- 10. Pan J., Hu H., Zhou Z., Sun L., Peng L., Yu L., Sun L., Liu J., Yang Z., Ran Y. (2010) Tumor-suppressive mir-663 gene induces mitotic catastrophe growth arrest in human gastric cancer cells. Oncol. Rep. 24, 105–112 [DOI] [PubMed] [Google Scholar]
- 11. Zhu Y., Yu F., Jiao Y., Feng J., Tang W., Yao H., Gong C., Chen J., Su F., Zhang Y., Song E. (2011) Reduced miR-128 in breast tumor-initiating cells induces chemotherapeutic resistance via Bmi-1 and ABCC5. Clin. Cancer Res. 17, 7105–7115 [DOI] [PubMed] [Google Scholar]
- 12. Yi C., Wang Q., Wang L., Huang Y., Li L., Liu L., Zhou X., Xie G., Kang T., Wang H., Zeng M., Ma J., Zeng Y., Yun J. P. (2012) MiR-663, a microRNA targeting p21WAF1/CIP1, promotes the proliferation and tumorigenesis of nasopharyngeal carcinoma. Oncogene 31, 4421–4433 [DOI] [PubMed] [Google Scholar]
- 13. Chen J., Yao Y., Gong C., Yu F., Su S., Chen J., Liu B., Deng H., Wang F., Lin L., Yao H., Su F., Anderson K.S., Liu Q., Ewen M.E., Yao X., Song E. (2011) CCL18 from tumor-associated macrophages promotes breast cancer metastasis via PITPNM3. Cancer Cell 19, 541–555 [DOI] [PMC free article] [PubMed] [Google Scholar]
- 14. Lemos Duarte I., da Silveira Nogueira Lima J. P., Passos Lima C. S., Deeke Sasse A. (2012) Dose-dense chemotherapy versus conventional chemotherapy for early breast cancer. A systematic review with meta-analysis. Breast 21, 343–349 [DOI] [PubMed] [Google Scholar]
- 15. Krell J., Frampton A. E., Jacob J., Castellano L., Stebbing J. (2012) miRNAs in breast cancer. Ready for real time? Pharmacogenomics 13, 709–719 [DOI] [PubMed] [Google Scholar]
- 16. Lu J., Getz G., Miska E. A., Alvarez-Saavedra E., Lamb J., Peck D., Sweet-Cordero A., Ebert B. L., Mak R. H., Ferrando A. A., Downing J. R., Jacks T., Horvitz H. R., Golub T. R. (2005) MicroRNA expression profiles classify human cancers. Nature 435, 834–838 [DOI] [PubMed] [Google Scholar]
- 17. Landgraf P., Rusu M., Sheridan R., Sewer A., Iovino N., Aravin A., Pfeffer S., Rice A., Kamphorst A. O., Landthaler M., Lin C., Socci N. D., Hermida L., Fulci V., Chiaretti S., Foà R., Schliwka J., Fuchs U., Novosel A., Müller R. U., Schermer B., Bissels U., Inman J., Phan Q., Chien M., Weir D. B., Choksi R., De Vita G., Frezzetti D., Trompeter H. I., Hornung V., Teng G., Hartmann G., Palkovits M., Di Lauro R., Wernet P., Macino G., Rogler C. E., Nagle J. W., Ju J., Papavasiliou F. N., Benzing T., Lichter P., Tam W., Brownstein M. J., Bosio A., Borkhardt A., Russo J. J., Sander C., Zavolan M., Tuschl T. (2007) A mammalian microRNA expression atlas based on small RNA library sequencing. Cell 129, 1401–1414 [DOI] [PMC free article] [PubMed] [Google Scholar]
- 18. O'Day E., Lal A. (2010) MicroRNAs and their target gene networks in breast cancer. Breast Cancer Res. 12, 201. [DOI] [PMC free article] [PubMed] [Google Scholar]
- 19. Hummel R., Hussey D. J., Haier J. (2010) MicroRNAs. Predictors and modifiers of chemo- and radiotherapy in different tumour types. Eur. J. Cancer 46, 298–311 [DOI] [PubMed] [Google Scholar]
- 20. Penault-Llorca F., André F., Sagan C., Lacroix-Triki M., Denoux Y., Verriele V., Jacquemier J., Baranzelli M.C., Bibeau F., Antoine M., Lagarde N., Martin A. L., Asselain B., Roché H. (2009) Ki67 expression and docetaxel efficacy in patients with estrogen receptor-positive breast cancer. J. Clin. Oncol. 27, 2809–2815 [DOI] [PubMed] [Google Scholar]
- 21. Sato F., Tsuchiya S., Meltzer S. J., Shimizu K. (2011) MicroRNAs and epigenetics. FEBS J. 278, 1598–1609 [DOI] [PubMed] [Google Scholar]
- 22. Oliva C. R., Nozell S. E., Diers A., McClugage S. G., 3rd, Sarkaria J. N., Markert J. M., Darley-Usmar V. M., Bailey S. M., Gillespie G. Y., Landar A., Griguer C. E. (2010) Acquisition of temozolomide chemoresistance in gliomas leads to remodeling of mitochondrial electron transport chain. J. Biol. Chem. 285, 39759–39767 [DOI] [PMC free article] [PubMed] [Google Scholar]
- 23. Amant F., Deckers S., Van Calsteren K., Loibl S., Halaska M., Brepoels L., Beijnen J., Cardoso F., Gentilini O., Lagae L., Mir O., Neven P., Ottevanger N., Pans S., Peccatori F., Rouzier R., Senn H. J., Struikmans H., Christiaens M. R., Cameron D., Du Bois A. (2010) Breast cancer in pregnancy. Recommendations of an international consensus meeting. Eur. J. Cancer 46, 3158–3168 [DOI] [PubMed] [Google Scholar]
- 24. Ma K., He Y., Zhang H., Fei Q., Niu D., Wang D., Ding X., Xu H., Chen X., Zhu J. (2012) DNA methylation-regulated miR-193a-3p dictates resistance of hepatocellular carcinoma to 5-fluorouracil via repression of SRSF2 expression. J. Biol. Chem. 287, 5639–5649 [DOI] [PMC free article] [PubMed] [Google Scholar]