

Background: DNA polymerases use a multistep mechanism to faithfully replicate DNA.
Results: Replicative DNA polymerase PolB1 binds DNA in multiple conformations that are affected by nucleotide or mismatched DNA binding.
Conclusion: Modulation of conformational dynamics and DNA binding kinetics affects the replication fidelity of PolB1.
Significance: Single-molecule techniques can reveal subtle differences in substrate binding properties and conformational dynamics of a DNA polymerase.
Keywords: DNA Polymerase, Enzyme Kinetics, Enzyme Mechanisms, FRET, Single Molecule Biophysics, Conformational Dynamics, DNA Polymerase B1, PolB1, Sulfolobus solfataricus
Abstract
Replicative DNA polymerases use a complex, multistep mechanism for efficient and accurate DNA replication as uncovered by intense kinetic and structural studies. Recently, single-molecule fluorescence spectroscopy has provided new insights into real time conformational dynamics utilized by DNA polymerases during substrate binding and nucleotide incorporation. We have used single-molecule Förster resonance energy transfer techniques to investigate the kinetics and conformational dynamics of Sulfolobus solfataricus DNA polymerase B1 (PolB1) during DNA and nucleotide binding. Our experiments demonstrate that this replicative polymerase can bind to DNA in at least three conformations, corresponding to an open and closed conformation of the finger domain as well as a conformation with the DNA substrate bound to the exonuclease active site of PolB1. Additionally, our results show that PolB1 can transition between these conformations without dissociating from a primer-template DNA substrate. Furthermore, we show that the closed conformation is promoted by a matched incoming dNTP but not by a mismatched dNTP and that mismatches at the primer-template terminus lead to an increase in the binding of the DNA to the exonuclease site. Our analysis has also revealed new details of the biphasic dissociation kinetics of the polymerase-DNA binary complex. Notably, comparison of the results obtained in this study with PolB1 with those from similar single-molecule studies with an A-family DNA polymerase suggests mechanistic differences between these polymerases. In summary, our findings provide novel mechanistic insights into protein conformational dynamics and substrate binding kinetics of a high fidelity B-family DNA polymerase.
Introduction
Faithful genomic replication is of utmost importance to the survival of all organisms. Consequently, DNA polymerases, which are grouped into six families (A, B, C, D, X, and Y), must utilize distinct methods for selecting and incorporating correct nucleotides into a growing DNA chain. Biochemical and biophysical studies have elucidated many details of the kinetic mechanism of nucleotide incorporation catalyzed by high fidelity DNA polymerases (1–10). These studies have also provided evidence for multiple checkpoints in the process of nucleotide selection (11). X-ray crystallographic studies have shown that the polymerase core of any DNA polymerase adopts a “right hand” architecture with thumb, palm, and finger domains, the last of which undergoes a large closing motion upon nucleotide binding to the polymerase-DNA binary complex (12–15). Although this finger domain conformational change has been proposed to be both a major checkpoint for nucleotide selection and the rate-limiting step during each round of nucleotide incorporation (11), subsequent stopped-flow fluorescence studies have indicated that it is too rapid to limit nucleotide incorporation (16–20). Interestingly, our recent studies with the low fidelity Y-family Sulfolobus solfataricus DNA polymerase IV (Dpo4)2 indicate that nucleotide binding can induce global conformational changes in all of its four structural domains (20, 21).
In addition to the intrinsic fidelity associated with nucleotide selection by the polymerase activity, many DNA polymerases also contain 3′ → 5′ exonuclease proofreading activity, which can excise misincorporated nucleotides and further enhance replication fidelity by more than 100-fold (6, 10, 22). Notably, the exonuclease activity is contained in a separate structural domain, and binding of a DNA primer containing 3′-mismatched nucleotide(s) to the exonuclease active site requires partial melting from the template strand and a repositioning of the duplex DNA (12, 23–25).
Recently, single-molecule studies with several A-family DNA polymerases have begun to provide new insight into the details of nucleotide selection mechanisms and conformational dynamics utilized by DNA polymerases (26–30). Several of these studies have indicated that the finger domain of the Klenow fragment of Escherichia coli DNA polymerase I (KF) is in equilibrium between an open and a closed conformation even in the absence of nucleotide and that the binding of a correct nucleotide biases the equilibrium toward the closed state (27, 30). However, in a similar study with another A-family DNA polymerase from bacteriophage T7 (T7 Pol), the analogous closed finger conformation was only detected in the presence of a correct nucleotide (26). Interestingly, single-molecule total internal reflection fluorescence studies have also yielded conflicting results about whether or not KF is able to bind fully complementary DNA in an editing mode with the primer bound to the exonuclease active site. One study reported that the binding to the exonuclease site was observed in ∼13% of all binding events to fully matched DNA (30), whereas another suggested that binding to the exonuclease site was only possible in the presence of a mismatched primer terminus (29). Although single-molecule methods have begun to illuminate mechanistic aspects of the activities of several DNA polymerases that cannot be easily investigated by ensemble measurements, further study is necessary to resolve aforementioned discrepancies and to provide additional mechanistic insights. Additionally, single-molecule studies with different DNA polymerases can help illustrate nuances in the mechanism of each enzyme.
In this study, we have designed a Förster resonance energy transfer (FRET) system to investigate protein conformational dynamics and DNA binding kinetics of S. solfataricus DNA polymerase B1 (PolB1) at the single-molecule level. PolB1 represents an attractive model system because it is a B-family DNA polymerase with an established kinetic mechanism (5, 6) and is the lone replicative DNA polymerase in S. solfataricus (31). Our results suggest that PolB1 can bind to DNA in at least three distinct conformations and that the relative frequency of each conformation can be modulated by both the identity of the primer 3′ terminus and the presence of an incoming dNTP. Notably, our results highlight several similarities and differences between DNA binding properties of a B-family DNA polymerase and those described above for the A-family DNA polymerases at the single-molecule level.
EXPERIMENTAL PROCEDURES
Protein and DNA Substrate Preparation
Based on the PolB1 exonuclease-deficient triple point mutant (D231A, E233A, and D318A) plasmid described previously (WT PolB1 exo−) (6), we mutated the three native cysteine residues to serine (C67S, C538S, and C556S) to avoid ambiguity in labeling. Then, we introduced a single cysteine into the finger domain (S588C). The mutant protein was expressed in E. coli and purified as described previously (6). Labeling was carried out by incubation of PolB1 with a 10-fold molar excess of Cy5-maleimide (GE Healthcare) overnight at 4 °C in 50 mm sodium phosphate buffer (pH 7). Unincorporated free dye was then removed with two consecutive Micro Bio-Spin columns (Bio-Rad), and a labeling efficiency of ∼85% was determined by measuring absorption at 280 and 650 nm to determine protein and Cy5 concentrations according to the manufacturer's protocol.
Modified and unmodified oligonucleotides in Table 1 were purchased from Integrated DNA Technologies. The 30-mer template oligonucleotides used in single-molecule experiments contained a 3′-biotin to facilitate surface immobilization. Cy3 (GE Healthcare) was attached via a 5-C6-amino-2′-deoxythymidine on either the 9th base from the 3′ terminus of a DNA primer or the 19th base from the 5′-end of a DNA template according to the manufacturer's protocol.
TABLE 1.
Sequences of DNA substrates
“T” and “C” denote Cy3 attached to a 5-C6-amino-2′-deoxythymidine and 2′,3′-dideoxycytidine, respectively. Mismatched bases are indicated in red. All template strands except the one in A-1 also contained biotin on their 3′-ends for surface immobilization.

Fluorescence Anisotropy Titration
Cy3-labeled DNA (3 nm) was titrated with increasing amounts of PolB1, and the anisotropy signal was monitored to follow binding (32). Experiments were carried out at 25 °C in reaction buffer R containing 50 mm HEPES (pH 7.6), 15 mm MgCl2, 75 mm NaCl, and 0.1 mg/ml BSA. Excitation and emission were 540 and 568 nm, respectively, with a 10-nm band pass and 2-s integration time. Binding curves were fit to Equation 1,
 |
where ΔA is the change in anisotropy, ΔAT is the maximum anisotropy change, D0 is the total DNA concentration, E0 is the total PolB1 concentration, and KD is the dissociation constant.
Kinetic Assays
All experiments were performed at 25 °C in reaction buffer R using a rapid chemical-quench flow apparatus (KinTek). For burst assays, a preincubated solution of PolB1 (30 nm) and 5′-32P-labeled DNA substrate (120 nm) was mixed with dTTP-Mg2+ (100 μm). Reactions were quenched at the indicated time with the addition of EDTA to a final concentration of 0.37 m. Reaction products were analyzed by sequencing gel electrophoresis (17% acrylamide, 8 m urea, 1× Tris borate-EDTA running buffer), visualized using a Typhoon TRIO (GE Healthcare), and quantitated with ImageQuant software (GE Healthcare). For the burst assay, the product concentration was graphed as a function of time (t), and the data were fit to Equation 2,
where A represents the fraction of active enzyme, kburst represents the single-turnover burst rate constant, and kss represents the observed steady state rate constant.
Single-molecule Measurements
All single-molecule measurements were carried out at room temperature in the presence of an imaging buffer containing an oxygen scavenging system (0.8% (w/v) d-glucose, 1 mg/ml glucose oxidase, and 0.04 mg/ml catalase) and ∼2 mm Trolox (33) in addition to the polymerase reaction buffer R containing 50 mm HEPES (pH 7.6), 15 mm MgCl2, 75 mm NaCl, and 0.1 mg/ml BSA. Single-molecule sample chambers were assembled from quartz slides and coverslips that were cleaned, passivated, biotinylated, and coated with Neutravidin (0.2 mg/ml) as described previously (33). DNA was loaded into the sample chamber at 10–50 pm to allow sufficient separation for resolving fluorescence from single, immobilized DNA molecules. Single-molecule fluorescence studies were performed on a homemade prism-type total internal reflection microscope (33) based on an Eclipse Ts-i inverted microscope with a 1.2 numerical aperture 60× PlanAPO water emersion objective (Nikon). Molecules were excited with a 532 nm laser (CrystaLaser, 100 milliwatt), and fluorescence emission was passed through a set of optics including a high pass filter to reject scattered laser light (Et5421P, Chroma), dichroic mirrors to split donor and acceptor fluorescence (2x T6401p, Chroma), and band pass filters to minimize cross-talk between donor and acceptor channels (Et575/40m and Et685/70m, Chroma). Movies were recorded with an iXon 897 electron-multiplying charge-coupled device camera (Andor) with a 100-ms frame rate and were processed using IDL (ITT Visual Information Solutions) and a custom data acquisition and analysis software package (Center for the Physics of Living Cells, University of Illinois at Urbana-Champaign) to produce and analyze fluorescence intensity time traces. Individual traces showing anticorrelated donor and acceptor fluctuations for FRET measurements or fluctuation between high and low Cy3 intensity for protein-induced fluorescence enhancement (PIFE) measurements were selected for analysis and corrected for background signal using a custom written MATLAB (MathWorks) code included in the above mentioned software package.
Data Analysis
Reported FRET efficiency values were calculated as apparent FRET (Eapp) according to the equation Eapp = IA/(ID + IA) where ID and IA are the donor and acceptor fluorescence intensities, respectively. FRET efficiency values were binned for each selected time trace to generate histograms. Then, composite histograms were compiled from multiple time traces (>200) and only contained data points with the acceptor intensity clearly above the background level determined from the average background intensity in the acceptor channel after donor photobleaching. The histograms were fit using a sum of Gaussian functions in MATLAB, and the reported percentages of molecules in each state were determined by the total area under each peak. For dwell time analysis, a FRET efficiency of 0.1 was used as a lower threshold for the bound state. Histograms of the binding times or time between binding events were compiled from multiple time traces (>150). Histograms were then integrated and normalized to produce cumulative distribution functions (F(t)) and then inverted (1 − F(t)) to generate the survivor functions (f (t)). Survivor functions were then fit to single (Equation 3) or double (Equation 4) exponential functions,
where f (t) is the fraction of molecules remaining bound after time t, A1 and A2 are the amplitudes of each phase, and the k, k1, and k2 values are the decay rate constants.
RESULTS
Multiple Conformational States Occur during DNA Binding
To investigate the dynamic interactions between PolB1 and a DNA substrate at the single-molecule level, we designed a FRET system suitable for PolB1 by (i) starting with the previously characterized PolB1 exo− mutant, which has the three exonuclease active site residues (Asp-231, Glu-233, and Asp-318) replaced with alanine to eliminate complications in data analysis due to the strong 3′ → 5′ exonuclease activity of PolB1 (6), (ii) substituting three native cysteine residues (Cys-67, Cys-538, and Cys-556) with serine to allow for introduction of a unique labeling site, and (iii) engineering a Ser to Cys substitution at position 588, a surface residue at the tip of the finger domain that would be accessible for attaching a Cy5 acceptor fluorophore. A primer extension assay showed that the PolB1 mutant (S588C, C67S, C538S, C556S, D231A, E233A, and D318A) containing the single cysteine for labeling retained a high level of DNA polymerase activity (data not shown). Fluorescence anisotropy titration assays showed that the DNA dissociation constant of the single cysteine mutant (KD = 2.1 ± 0.8 nm) and the previously characterized PolB1 exo− (KD = 1.7 ± 0.3 nm) were the same within error (Fig. 1A) and were consistent with the value reported previously (KD = 1.8 nm) (5). Additionally, burst kinetics assays showed that the single turnover burst rate and the steady state rate of product formation for the fluorescently labeled mutant PolB1 were not significantly altered compared with the previously characterized PolB1 exo− (Fig. 1B). A Cy3 donor fluorophore was attached to either the 9th base from the 3′ terminus of a DNA primer 21-mer or the 19th base from the 5′-end of a DNA template 30-mer via a modified thymine base (Table 1). The approximate positions of the donor and acceptor fluorophores in the PolB1-DNA complex are shown in Fig. 2A. The DNA template was biotinylated at the 3′-end to allow for immobilization on a passivated microscope slide with a biotin-Neutravidin linkage (33). The DNA labeling had no significant effect on DNA polymerase activity (data not show).
FIGURE 1.
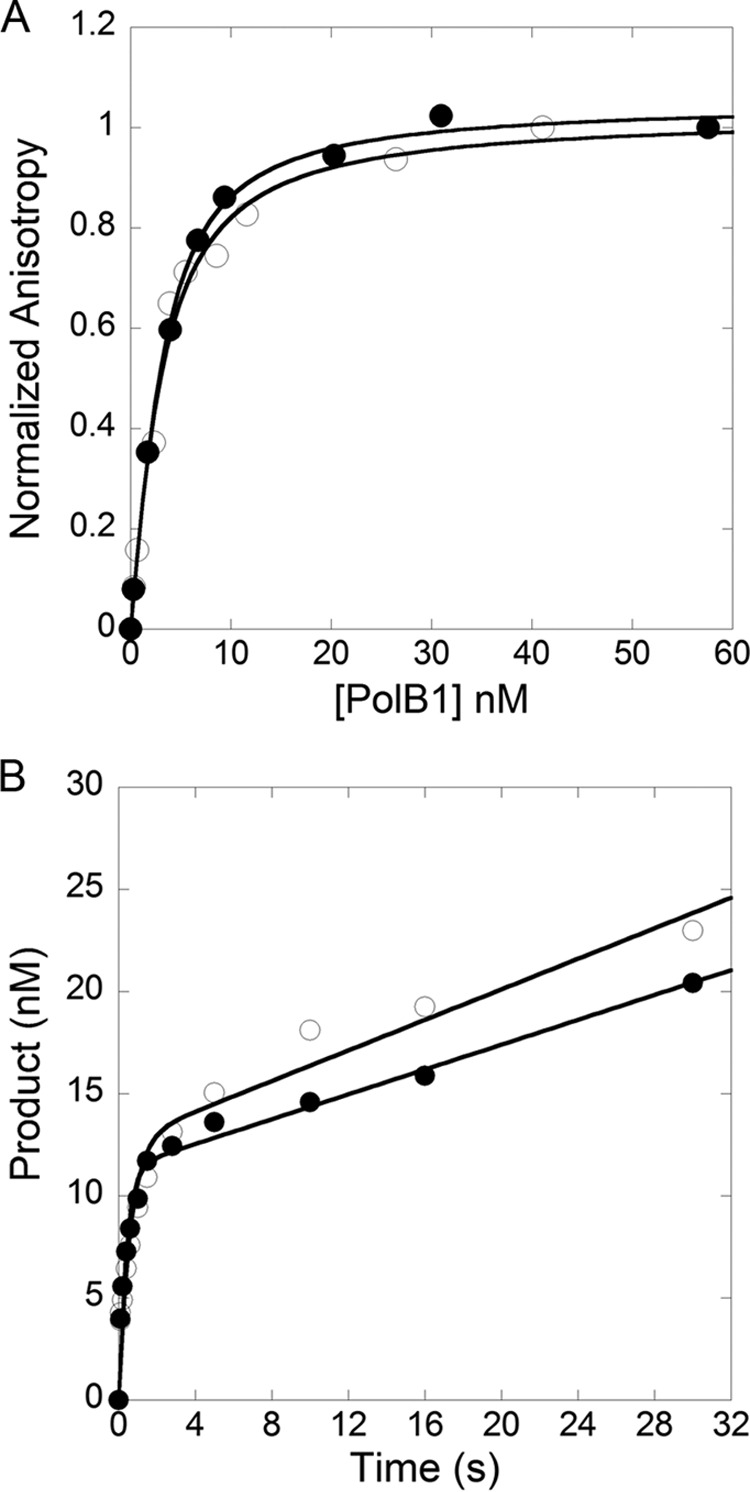
Comparison of kinetic parameters of PolB1 single cysteine mutant and previously characterized PolB1 exo−. A, anisotropy versus concentration of the unlabeled single cysteine mutant (○) and the previously characterized PolB1 exo− (●) were fit to Equation 1 (“Experimental Procedures”), which yielded KD values of 1.7 ± 0.3 and 2.1 ± 0.8 nm, respectively, for binding to Cy3-labeled DNA substrate A-1 (Table 1). B, a preincubated solution of PolB1 (30 nm) and 5′-32P-labeled D-1 DNA (Table 1) (120 nm) was mixed with dTTP-Mg2+ (100 μm), and the reaction was quenched at various times with 0.37 m EDTA. A fit of product formation versus time to Equation 2 (“Experimental Procedures”) resolved the following parameters: kburst = 1.7 ± 0.3 s−1 and kss = 0.030 ± 0.007 s−1 for the Cy5-labeled single cysteine mutant (○) and kburst = 2.6 ± 0.3 s−1 and kss = 0.027 ± 0.004 s−1 for PolB1 exo− (●).
FIGURE 2.

FRET from PolB1 binding to single DNA molecules. A, the PolB1-DNA complex was modeled by structural alignment of the apoPolB1 structure (Protein Data Bank code 1S5J) with the ternary structure of RB69 Pol bound to DNA and dNTP (Protein Data Bank code 1IG9) using PyMOL. The finger (blue), palm (green), thumb (pink), exonuclease (yellow), and N-terminal (brown) domains are shown with the approximate positions of the Cy3 donor in the C-1 DNA substrate (Table 1) and Cy5 acceptor on PolB1 shown as cyan and red spheres, respectively. The DNA is shown in orange. B, a schematic representation of the low, mid, and high FRET PolB1-DNA complexes. The protein domains and DNA are colored as in A with the positions of the Cy3 donor and Cy5 acceptor shown as cyan and red spheres, respectively, with the relative size of the spheres corresponding to the fluorescent intensities of each dye. C, a representative time trajectory is shown for PolB1 binding to DNA with donor and acceptor intensities shown in green and red, respectively (top), whereas the corresponding FRET signal is shown in blue (bottom). Black dashed lines at 0.3, 0.45, and 0.75 FRET efficiencies are shown for ease of visual inspection. Two clear transitions can be seen between the high and mid FRET efficiency levels. D, the FRET efficiency histogram compiled from 286 time traces showing PolB1 binding to the C-1 DNA substrate (Table 1) with the listed percentages corresponding to the area of each peak. Dashed red lines represent individual Gaussian peak fits, and the solid line represents the sum of the individual Gaussian peak fits.
A custom built prism-type total internal reflection fluorescence microscopy system (33) was used to monitor the change in FRET upon the interaction of PolB1 with immobilized DNA substrate molecules. Fluorescence intensity from both donor and acceptor channels was recorded simultaneously for time intervals up to 150 s. In the absence of PolB1, the Cy3 emission intensity from individual DNA molecules remained at a constant level until undergoing irreversible photobleaching (data not shown). Upon the introduction of 10 nm Cy5-labeled PolB1 to a slide containing immobilized Cy3-labeled C-1 DNA substrate molecules (Table 1), anticorrelated fluctuations of donor (green) and acceptor (red) fluorescence were observed, indicating binding of PolB1 to the DNA substrate (Fig. 2C). Analysis of individual FRET trajectories revealed transitions between several distinct FRET efficiency values including transitions between two non-zero FRET efficiencies (Figs. 2B and 3). These results suggest that PolB1 is capable of binding to the DNA substrate in several distinct conformational states and that transitions between these conformations within a single binding event are possible (Scheme 1).
FIGURE 3.

Examples of time trajectories showing transition between conformations in a single binding event. Traces including transitions between the EPolOpen-DNAn (low FRET) and EPolClosed-DNAn (mid FRET) conformations (A), EExo-DNAn* (high FRET) and EPolOpen-DNAn (low FRET) conformations (B), and EExo-DNAn* (high FRET) and EPolClosed-DNAn (mid FRET) conformations (C) are shown. Donor and acceptor intensities are shown in green and red, respectively (top), and the corresponding FRET signal is shown in blue (bottom).
SCHEME 1.

A histogram compiled from binding events from ∼300 individual traces shows three distinct peaks centered at low (0.24), mid (0.46), and high (0.79) FRET efficiencies (Fig. 2D). Each peak corresponds to a unique conformational state of PolB1 bound to DNA. Similar results were found in a recent study with KF in which some states were identified to correspond to different conformations of the finger domain, whereas an additional state was believed to result from DNA binding to the exonuclease site of KF (30). As described below, this was also the case for PolB1 in this study with the low and mid FRET states corresponding to open (EPolOpen-DNAn) and closed conformations (EPolClosed-DNAn) of the finger domain, respectively, and the high FRET state corresponding to DNA binding to the exonuclease site (EExo-DNAn*) (Scheme 1 and Fig. 2B).
We performed dwell time analysis on single-molecule binding traces (>200 traces for each condition) to investigate the DNA association and dissociation kinetics of the labeled PolB1 using the C-1 DNA substrate (Table 1). In this dwell time analysis, histograms were compiled from the durations of non-zero FRET states (bound state lifetimes) and the durations between the non-zero FRET states (unbound state lifetime). Integration of these histograms then produced a survivor function that was then fit to an exponential decay function to calculate kinetic parameters for the association and dissociation of the PolB1-DNA complex (see “Experimental Procedures”). Because of the overlap between the peaks in the FRET distribution histogram (Fig. 2D), binding kinetics were not extrapolated for each FRET efficiency state separately. The survivor function of the lifetimes of the bound state was best fit with a double exponential equation with 93 ± 2% of molecules dissociating with a fast rate (k1) of 1.53 ± 0.05 s−1 and the remaining 7 ± 2% of molecules dissociating with a slower rate (k2) of 0.44 ± 0.08 s−1 (Fig. 4A). This indicates that a small number of PolB1 molecules were bound to DNA in a more stable state. An observed association rate of 0.69 ± 0.04 s−1 was obtained from a single exponential fit of the survivor function calculated from the time between binding events (Fig. 4B). To determine the effect of the concentration of PolB1 on the DNA binding kinetics, we made use of a technique known as PIFE in which the binding of an unlabeled DNA polymerase to Cy3-labeled DNA has been shown to lead to an increase in fluorescence intensity (26, 29). This technique allows for the use of protein concentrations above what can be used for single-molecule FRET as we have observed that concentrations above ∼15 nm Cy5-labeled PolB1 result in a high background fluorescence that makes data analysis difficult. Single-molecule PIFE traces showed that the binding of PolB1 to the C-2 substrate leads to a ∼1.8-fold increase in Cy3 fluorescence (Fig. 5A). Dwell time analysis indicated that the lifetime of the bound state was independent of PolB1 concentration, whereas the association rate increased linearly with increasing PolB1 concentration (Fig. 5, B and C). A second order binding constant of 6.7 ± 0.1 × 10⁷ m−1 s−1 was determined from a linear fit of the association rate versus the concentration of PolB1. KD values of 6 ± 1 and 23 ± 1 nm were calculated using the aforementioned dissociation rates of k2 and k1, respectively (Fig. 4). The lower KD value is similar to that determined previously by ensemble level kinetic assays (KD = 1.8 nm) (5).
FIGURE 4.

Dwell time analysis of binary complex formation. Survivor functions for the bound state (A) and unbound state (B) were computed from histograms of binding times and time between binding events, respectively, for multiple time trajectories (see “Experimental Procedures”) with 10 nm PolB1 binding to DNA substrate C-1 (Table 1). The black lines represent fits to either a double (A) or single (B) exponential equation (Equations 3 and 4 under “Experimental Procedures”). The bound state was best fit with a double exponential equation to yield the following parameters: A1 = 0.93 ± 0.02, k1 = 1.53 ± 0.05 s−1, A2 = 0.07 ± 0.02, and k2 = 0.44 ± 0.09 s−1. The unbound state was fit to a single exponential equation with a rate of 0.69 ± 0.04 s−1.
FIGURE 5.

Concentration-dependent dwell times based on PIFE. Representative PIFE time trajectories are shown for fluorescence intensity from Cy3-labeled C-2 DNA substrate molecules in the presence of 5 nm (top) or 45 nm (bottom) unlabeled PolB1. The dissociation (B) and association (C) rates extrapolated from PIFE data are shown as a function of PolB1 concentration. The indicated concentration-independent dissociation rates (k1 and k2) are the average of the rates determined at each concentration (B), and the association rate (kon = 6.7 ± 0.1 × 10⁷ m−1 s−1) was determined from a linear fit of the observed rate versus PolB1 concentration (C).
Binding of a Correct or an Incorrect Nucleotide Alters the Conformational Dynamics of PolB1 Complexes
Previous studies have shown that binding to a correct nucleotide stabilizes a closed conformation for the finger domains of A-family DNA polymerases (27, 30). To determine whether such a conformational change may be partially responsible for the multiple binding conformations observed for PolB1, we performed single-molecule binding assays with the C-1 DNA substrate in the presence of 1 mm correct dTTP. Notably, the C-1 DNA substrate (Table 1) contains a dideoxy-terminated primer to prevent the covalent incorporation of the nucleotide. The presence of the correct nucleotide altered the FRET efficiency distribution, leading to a 14% decrease in the low FRET peak and a corresponding increase in the mid FRET peak, whereas the highest peak remained relatively unchanged (Fig. 6A). This suggests that the low FRET efficiency state indeed corresponded to an open finger conformation (EPolOpen-DNAn; Fig. 2B), whereas the mid FRET efficiency state corresponded to a closed finger conformation (EPolClosed-DNAn; Fig. 2B). Additionally, dwell time analysis showed that the presence of a correct nucleotide led to a modest increase in the average lifetime of binding events. Extracting the double exponential decay parameters from the dwell time survivor function indicated that the increase in the average lifetime was due to a 5-fold increase in the amplitude of the slow phase (0.07 ± 0.02 versus 0.38 ± 0.02) rather than a change in the dissociation rates (1.53 ± 0.05 and 0.44 ± 0.09 s−1 versus 1.79 ± 0.07 and 0.48 ± 0.02 s−1) (Fig. 6C). This suggests that correct nucleotide binding promotes formation of a more stable complex that is accessible but occupied less frequently in the absence of any nucleotide. These results are also consistent with our previous ensemble level kinetic studies that provide evidence for distinct rapidly and slowly dissociating E-DNA-dNTP ternary complexes (5).
FIGURE 6.

FRET efficiency histograms and bound state survivor functions for PolB1 binding to DNA substrate C-1 in the presence of a correct or an incorrect nucleotide. The FRET efficiency histograms (A and B) and bound state survivor functions (C and D) were compiled from FRET time trajectories recorded with 10 nm PolB1 in the presence of 1 mm correct dTTP (A and C) or incorrect dATP (B and D). The survivor functions were fit with a double exponential equation (Equation 3). For correct dTTP, the following kinetic parameters were resolved: A1 = 0.62 ± 0.01, k1 = 1.79 ± 0.07 s−1, A2 = 0.38 ± 0.02, and k2 = 0.48 ± 0.02 s−1. For incorrect dATP, the following kinetic parameters were resolved: A1 = 0.67 ± 0.03, k1 = 7.5 ± 0.5 s−1, A2 = 0.32 ± 0.03, and k2 = 1.5 ± 0.1 s−1.
Interestingly, in the presence of 1 mm incorrect dATP, the increase in the mid FRET peak frequency was not observed (Fig. 6B). Instead, when compared with the results obtained in the absence of any nucleotide, there was a reduction in the frequency of both open and closed states and an increase in the highest FRET state. This suggests that binding to an incorrect nucleotide has minimal effect on the conformational dynamics of the finger domain. Dwell time analysis showed a biphasic dissociation rate in the presence of dATP (Fig. 6D) with the amplitudes of fast (67 ± 3%) and slow (32 ± 3%) phases similar to those observed (62 ± 1 and 38 ± 2%) in the presence of the correct nucleotide only with dramatically faster rates (∼7 and 1.5 s−1). Notably, the calculated rate of the fast phase (Fig. 6D) may be less accurate than suggested by the curve fitting error (7.5 ± 0.5 s−1) because the inverse of this rate corresponds to a lifetime of 140 ms, which is near the experimental time resolution (100 ms). Nevertheless, this result indicates that the incorrect nucleotide greatly decreased the stability of the PolB1-DNA binary complex.
Substrates with a Mismatched Primer Terminus Destabilize the Binding of PolB1 to DNA
Next, we investigated the binding of PolB1 to DNA substrates containing mismatched primer termini. To facilitate the use of different primers, a DNA construct was used with both the fluorescent label and biotin on the template strand (Table 1). Notably, results with a fully matched DNA primer and the labeled template produced results essentially identical to those with the donor fluorophore on the primer strand (Fig. 7). With a single terminal mismatch, a 2-fold increase in the high FRET population accompanied by a decrease in the low FRET peak and a minor reduction of the mid FRET peak was observed (Fig. 8A). A similar increase in the frequency of binding to the exonuclease site upon introduction of a single mismatch has been reported in ensemble studies for KF (34). It is therefore likely that the high FRET peak is due to the binding of DNA to the exonuclease site of PolB1 (EExo-DNAn*; Fig. 2B) and that this binding configuration is more likely in the presence of a terminal mismatch (Fig. 8A) than with fully matched DNA (Fig. 2D). The crystal structure of the related B-family polymerase RB69 Pol indicates that several nucleotides at the primer terminus must be melted from the template strand to allow for binding of the DNA substrate to the exonuclease site (13). Therefore, we investigated the effects of a substrate with three terminal mismatches on the binding of DNA to PolB1. Interestingly, when the DNA substrate contained three mismatched base pairs, not only was the high FRET state even more densely populated but also the low and mid FRET efficiency peaks were no longer easily distinguishable, instead appearing as an asymmetric single peak with a FRET efficiency of 0.3 (Fig. 8B). This suggests that the presence of three mismatches distorts the DNA substrate in such a way that the finger domain motion is disrupted. Furthermore, the high FRET peak was broadened and centered at a lower value (0.64; Fig. 8B) than for the fully matched DNA (0.79; Fig. 2D). This indicates that the multiple mismatches also affect the exonuclease binding mode, which may be more conformationally flexible, leading to the broadening of the FRET distribution. It is possible that this broadened peak may represent multiple distinct conformations; however, they do not give rise to easily distinguishable FRET states and thus were not fit to individual peaks. Dwell time analysis revealed that the lifetime of PolB1 bound to the mismatch-containing substrates still exhibited a double exponential decay but with the rates of both phases significantly increased for the single- (5.4 ± 0.1 and 1.24 ± 0.07 s−1; Fig. 8C) and triple-mismatch (7.8 ± 0.1 and 1.49 ± 0.08 s−1; Fig. 8D) substrates compared with the fully complementary substrate (1.53 ± 0.05 and 0.44 ± 0.09 s−1; Fig. 4A). As described above, the fast rates may be less accurate than indicated by the curve fitting in Fig. 8 due to limited experimental time resolution. These data suggest that the binding of PolB1 to DNA is affected significantly by the presence of multiple mismatches at the primer-template junction.
FIGURE 7.

FRET efficiency histogram for PolB1 (10 nm) binding to the C-3 DNA substrate with the Cy3 label on the template strand. The peak position and frequency are similar to those observed with the C-1 substrate labeled with Cy3 on the primer strand.
FIGURE 8.

FRET efficiency histograms and bound state survivor functions for PolB1 binding to mismatched DNA substrates. The FRET efficiency histograms (A and B) and bound state survivor functions (C and D) were compiled from FRET time trajectories recorded with 10 nm PolB1 binding to DNA substrates containing a single mismatch (M-1) (A and C) or three mismatches (M-3) (B and D). The survivor functions were fit with a double exponential equation (Equation 4). For M-1, the following kinetic parameters were resolved: A1 = 0.82 ± 0.01, k1 = 5.4 ± 0.1 s−1, A2 = 0.18 ± 0.03, and k2 = 1.24 ± 0.07 s−1. For M-3, the following kinetic parameters were resolved: A1 = 0.84 ± 0.01, k1 = 7.8 ± 0.1 s−1, A2 = 0.12 ± 0.01, and k2 = 1.49 ± 0.08 s−1.
DISCUSSION
DNA polymerases utilize a complex kinetic mechanism and undergo various conformational changes to bind substrates and catalyze DNA polymerization. Although a minimal kinetic mechanism has been established for all DNA polymerases through ensemble level kinetic studies (11), important mechanistic differences exist between the six families of DNA polymerase as well as between members within the same family. Single-molecule techniques are powerful tools for providing additional details on the mechanism of DNA polymerization and the unique characteristics of individual polymerases. To date, there have been only a handful of single-molecule fluorescence studies of DNA polymerase activities, and they have largely focused on the A-family members (26–30) or HIV reverse transcriptase (35). Here we have developed a single-molecule FRET system to monitor the interaction between DNA and PolB1, a model B-family DNA polymerase.
In the absence of nucleotides, we have shown that PolB1 is able to bind to a DNA substrate in conformations that give rise to three distinguishable FRET states, which we have assigned to an open (EPolOpen-DNAn) and a closed (EPolClosed-DNAn) finger conformation and an exonuclease site (EExo-DNAn*) binding conformation (Scheme 1 and Figs. 2, 6, and 8). Notably, some single protein binding events exhibit detectable transitions between these states, indicating that PolB1 is able to transition between these states without dissociating from the DNA substrate (Scheme 1 and Figs. 2 and 3). Single-molecule FRET studies have revealed that the finger domain of KF also adopts multiple conformations in the absence of an incoming nucleotide (27, 30), whereas a similar study with T7 Pol, another A-family DNA polymerase, only detected the closed finger conformation after nucleotide binding (26). This may be due to actual differences in the mechanism of each DNA polymerase or in the experimental design of each published study. Despite the similarities between the observed FRET distributions in our studies with PolB1 and those with KF (30), there are several notable differences. First, with KF, an “ajar” conformation was observed at a FRET efficiency intermediate between the open and closed states (30), whereas no such conformation was resolved here for PolB1. The binding of a correct nucleotide shifts the conformational equilibrium toward the closed state for both PolB1 and KF. However, the closed conformation is slightly preferred over the open conformation for PolB1 when bound to DNA in the absence of an incoming nucleotide (Fig. 2D), whereas the open state was found to be preferred for KF (30). Furthermore, a smaller majority of PolB1 (66%) molecules are bound in the closed conformation in the presence of a correct dNTP (Fig. 6A) than observed for KF (∼90%) (30). These observations suggest that the presence of a correct dNTP had less effect on the conformation of the finger domain of PolB1 than observed previously for KF. Some of the observed differences in the conformational dynamics may be due to the unique structure of the finger domain of PolB1. The crystal structure of PolB1 shows that two α helices from the N-terminal domain are inserted into the finger domain, leading to an unusual extended finger structure not observed in other A- or B-family DNA polymerases (36). Notably, this distinctive structural feature has not been observed in the structures of other B-family DNA polymerases including RB69 Pol (13) as well as those from other thermophilic archaea including Thermococcus (37, 38), Desulfurococcus (39), and Pyrococcus (40). However, sequence alignment suggests that this feature may be present in more closely related crenarchaeal species (36) and may therefore define a distinct subfamily of DNA polymerases. This unique structure may facilitate PolB1 to use different strategies than KF or other B-family DNA polymerases with respect to finger domain conformational dynamics to achieve a similar level of replication fidelity and efficiency. Additionally, although our results show a 5-fold increase in the population of slowly dissociating complexes of PolB1 bound to DNA in the presence of the correct dNTP, the overall increase in the binding time is more modest than that observed for KF (30). This difference is supported by our ensemble level studies that provide evidence for two types of PolB-DNA-dNTP ternary complexes, one that dissociates more rapidly than the binary complex alone and one that dissociates more slowly (5). On the other hand, ensemble level studies with KF have provided evidence for only a single type of ternary complex with a dissociation rate similar to that observed in the single-molecule studies (41). The observed differences between KF and PolB1 are not entirely unexpected as the two enzyme perform different in vivo functions in very different organisms. KF is a truncated form of a bacterial DNA polymerase predominantly involved in filling DNA gaps introduced during repair and lagging strand synthesis (42), whereas PolB1 is the main replicative polymerase of a hyperthermophilic archaeon (31). Additionally, stopped-flow FRET studies have suggested that there are also significant difference between KF (41) and a homologous bacterial A-family DNA polymerase, Thermus aquaticus Klentaq (17), with respect to the finger domain conformational dynamics. This illustrates that careful investigation can reveal variations in conformational change mechanisms even for closely related DNA polymerases.
Interestingly, the binding of a correct nucleotide had no effect on the relative population of PolB1 molecules bound in the exonuclease conformation (Fig. 6A). This may indicate that when initially bound to DNA in this proofreading conformation (EExo-DNAn*) PolB1 must dissociate or convert to a polymerase site-bound conformation (EPolOpen-DNAn or EPolClosed-DNAn) prior to nucleotide binding and that the presence of the correct nucleotide does not affect the initial preference of PolB1 to bind DNA in the polymerase site or the exonuclease site. Additionally, there is an overall increase in the frequency of the editing complex conformation (EExo-DNAn*) in the presence of an incorrect nucleotide (33%; Fig. 6B) when compared with the results with DNA alone (16%; Fig. 2D). It is possible that the mismatched dNTP may somehow induce a shift to the exonuclease binding mode (EExo-DNAn*) as was suggested for KF (30). However, when considering only molecules bound to DNA in the polymerase mode, the frequency of the closed conformation (EPolClosed-DNAn) relative to the open conformation (EPolOpen-DNAn) is largely unaffected by the presence of the incorrect nucleotide. This suggests an alternative explanation whereby the mismatched dNTP does not have any direct effect on the conformation of the finger domain but rather has an overall destabilizing effect on the binding of DNA to the polymerase active site, allowing for a higher likelihood of binding in the exonuclease mode without actively forcing the complex into this conformation.
Our results with the mismatched DNA substrates (Fig. 8) suggest that DNA binding by PolB1 may be disrupted at both the polymerase and exonuclease sites due to an increase in the conformational flexibility of the primer-template terminus. However, it is apparent that binding to the polymerase site still accounts for a significant portion of binding events with the triple mismatch at the primer-template junction. This result is in contrast to those from similar studies that suggest that KF binds DNA exclusively in the exonuclease site in the presence of a double mismatch (29). This difference between KF and PolB1 in the preference of mismatched DNA for binding to the exonuclease site may be the result of structural differences between the enzymes including the interactions between the finger and exonuclease domains that are unique to crenarchaeal B-family DNA polymerases such as PolB1 (36). Additionally, as with the other archaeal B-family DNA polymerases (37–40), the exonuclease domain of PolB1 lies on the opposite side of the palm domain than observed for DNA polymerases from other families. Furthermore, the three mutations required to inactivate the exonuclease of PolB1 (see “Experimental Procedures”) may be more disruptive to DNA binding to the exonuclease site than the single mutation used to remove this activity in KF (29). Nevertheless, our studies clearly demonstrate that binding to the exonuclease site of PolB1 is increasingly favored with increasing destabilization of the primer-template terminus.
Dwell time analysis revealed that the PolB1-DNA complex exhibited two apparent characteristic lifetimes, which were altered in the presence of nucleotides and mismatched primer-template termini. However, the dissociation rates determined in this study (k1 = 1.53 ± 0.05 s−1 and k2 = 0.44 ± 0.09 s−1) were much faster than the rate determined previously by ensemble level kinetic measurement (koff = 0.043 s−1) (5). There is a similar difference in the rates of dissociation of KF from DNA as determined by single-molecule FRET (1.3 or 1.6 s−1) (28, 30) or ensemble level kinetic methods (0.06 s−1) (2). Interestingly, the DNA dissociation rate for the B-family DNA polymerase from bacteriophage T4 was measured to be 6 s−1 (7), which is much closer to the rate determined in the single-molecule studies. The fluorescent labeling and surface attachment required for the single-molecule FRET measurements as well as triple mutations at the active site of the exonuclease domain may have some effect on the DNA binding kinetics of these enzymes. Alternatively, the large discrepancy in rates determined by the two methods may indicate that the formation of a stable, catalytically active polymerase-DNA complex involves a multistep mechanism (Scheme 2). The kinetic assays that were used to determine the slower dissociation rates (k−Pr; Scheme 2) are designed to monitor only the dissociation from a productive complex (EPolPr-DNAn; Scheme 2) capable of incorporating an incoming nucleotide into the DNA substrate. In contrast, single-molecule assays measure dissociation of both the productive complex and any non-productive complexes (EPolN-DNAn; Scheme 2). Therefore, the apparent biphasic dissociation observed in this study (kapp = A1exp(−k1t) + A2exp(−k2t)) may be a complex function of many microscopic rate constants for the dissociation from and interconversion between multiple binding complexes (kapp = f(kN, k−N, kPr, k−Pr, kN→Pr, kPr→N); Scheme 2). In fact, evidence for this type of multistep DNA binding mechanism involving multiple E-DNA binary complexes has been observed by ensemble level stopped-flow fluorescence measurements with HIV reverse transcriptase (43, 44) and T. aquaticus Klentaq1. In these studies, it was suggested that the difference between the proposed binary complex conformations might be the result of a subtle repositioning of the DNA substrate within the polymerase active site rather than large conformational changes in the protein structure. Similarly, our results from crystallographic (45) and stopped-flow FRET (20) studies with a Y-family DNA polymerase, Dpo4, indicate that the DNA substrate can translocate by 1 base pair relative to the polymerase active site prior to nucleotide binding. Notably, in stopped-flow FRET studies with KF, no evidence was found for the existence of more than one binary complex conformation (41) as was observed in similar studies with the homologous Klentaq1 (17). Interestingly, the frequencies of the two different bound state lifetimes observed here (Figs. 4; 6, C and D; and 8, C and D) are not correlated with the relative frequencies of the open and closed conformations in the presence or absence of an incoming dNTP (Figs. 2D; 6, A and B; and 8, A and B). This suggests that the E-DNA binding complexes described in Scheme 2 (EPolN-DNAn and EPolPr-DNAn) may also be related to subtle changes in the interaction between the DNA substrate and polymerase active site rather than the conformational state of the finger domain (EPolOpen-DNAn and EPolClosed-DNAn; Scheme 1). The apparent dissociation rate observed in the single-molecule assays is also further complicated by the potential for formation of a complex with the primer bound to the exonuclease site (EExo-DNAn*; Scheme 1), which has been shown to dissociate more than 1,000-fold faster than when the substrate is bound to the polymerase active site for KF (10). We are planning to perform additional stopped-flow and single-molecule FRET studies with fluorescent probes at different locations to verify the conclusions of this study as well as help shed additional light on the relationship between the conformational states and observed dissociation rates for PolB1. In addition, we will use the single-molecule FRET system established here as a foundation for our future single-molecule level studies on the switching between PolB1 and Dpo4 during DNA lesion bypass.
SCHEME 2.

Acknowledgments
We thank Dr. Peng Chen (Department of Chemistry and Chemical Biology, Cornell University) for providing software to complete the dwell time analysis and Drs. Xinghua Shi and Taekjip Ha (Department of Physics, University of Illinois at Urbana-Champaign) for technical advice during initial total internal reflection fluorescence instrument setup.
This work was supported by National Science Foundation Grant MCB-0960961 (to Z. S.).
- Dpo4
- S. solfataricus DNA polymerase IV
- KF
- Klenow fragment of E. coli DNA polymerase I
- PIFE
- protein-induced fluorescence enhancement
- PolB1
- S. solfataricus DNA polymerase B1
- RB69 Pol
- DNA polymerase from bacteriophage RB69
- T7 Pol
- DNA polymerase from bacteriophage T7
- exo
- exonuclease.
REFERENCES
- 1. Kuchta R. D., Benkovic P., Benkovic S. J. (1988) Kinetic mechanism whereby DNA polymerase I (Klenow) replicates DNA with high fidelity. Biochemistry 27, 6716–6725 [DOI] [PubMed] [Google Scholar]
- 2. Kuchta R. D., Mizrahi V., Benkovic P. A., Johnson K. A., Benkovic S. J. (1987) Kinetic mechanism of DNA polymerase I (Klenow). Biochemistry 26, 8410–8417 [DOI] [PubMed] [Google Scholar]
- 3. Eger B. T., Kuchta R. D., Carroll S. S., Benkovic P. A., Dahlberg M. E., Joyce C. M., Benkovic S. J. (1991) Mechanism of DNA replication fidelity for three mutants of DNA polymerase I: Klenow fragment KF(exo+), KF(polA5), and KF(exo−). Biochemistry 30, 1441–1448 [DOI] [PubMed] [Google Scholar]
- 4. Wong I., Patel S. S., Johnson K. A. (1991) An induced-fit kinetic mechanism for DNA replication fidelity: direct measurement by single-turnover kinetics. Biochemistry 30, 526–537 [DOI] [PubMed] [Google Scholar]
- 5. Brown J. A., Suo Z. (2009) Elucidating the kinetic mechanism of DNA polymerization catalyzed by Sulfolobus solfataricus P2 DNA polymerase B1. Biochemistry 48, 7502–7511 [DOI] [PubMed] [Google Scholar]
- 6. Zhang L., Brown J. A., Newmister S. A., Suo Z. (2009) Polymerization fidelity of a replicative DNA polymerase from the hyperthermophilic archaeon Sulfolobus solfataricus P2. Biochemistry 48, 7492–7501 [DOI] [PubMed] [Google Scholar]
- 7. Capson T. L., Peliska J. A., Kaboord B. F., Frey M. W., Lively C., Dahlberg M., Benkovic S. J. (1992) Kinetic characterization of the polymerase and exonuclease activities of the gene 43 protein of bacteriophage T4. Biochemistry 31, 10984–10994 [DOI] [PubMed] [Google Scholar]
- 8. Zhang H., Rhee C., Bebenek A., Drake J. W., Wang J., Konigsberg W. (2006) The L561A substitution in the nascent base-pair binding pocket of RB69 DNA polymerase reduces base discrimination. Biochemistry 45, 2211–2220 [DOI] [PMC free article] [PubMed] [Google Scholar]
- 9. Patel S. S., Wong I., Johnson K. A. (1991) Pre-steady-state kinetic analysis of processive DNA replication including complete characterization of an exonuclease-deficient mutant. Biochemistry 30, 511–525 [DOI] [PubMed] [Google Scholar]
- 10. Donlin M. J., Patel S. S., Johnson K. A. (1991) Kinetic partitioning between the exonuclease and polymerase sites in DNA error correction. Biochemistry 30, 538–546 [DOI] [PubMed] [Google Scholar]
- 11. Joyce C. M., Benkovic S. J. (2004) DNA polymerase fidelity: kinetics, structure, and checkpoints. Biochemistry 43, 14317–14324 [DOI] [PubMed] [Google Scholar]
- 12. Franklin M. C., Wang J., Steitz T. A. (2001) Structure of the replicating complex of a polα family DNA polymerase. Cell 105, 657–667 [DOI] [PubMed] [Google Scholar]
- 13. Wang J., Sattar A. K., Wang C. C., Karam J. D., Konigsberg W. H., Steitz T. A. (1997) Crystal structure of a polα family replication DNA polymerase from bacteriophage RB69. Cell 89, 1087–1099 [DOI] [PubMed] [Google Scholar]
- 14. Li Y., Korolev S., Waksman G. (1998) Crystal structures of open and closed forms of binary and ternary complexes of the large fragment of Thermus aquaticus DNA polymerase I: structural basis for nucleotide incorporation. EMBO J. 17, 7514–7525 [DOI] [PMC free article] [PubMed] [Google Scholar]
- 15. Doublié S., Sawaya M. R., Ellenberger T. (1999) An open and closed case for all polymerases. Structure 7, R31–R35 [DOI] [PubMed] [Google Scholar]
- 16. Rothwell P. J., Mitaksov V., Waksman G. (2005) Motions of the fingers subdomain of klentaq1 are fast and not rate limiting: implications for the molecular basis of fidelity in DNA polymerases. Mol. Cell 19, 345–355 [DOI] [PubMed] [Google Scholar]
- 17. Rothwell P. J., Waksman G. (2007) A pre-equilibrium before nucleotide binding limits fingers subdomain closure by Klentaq1. J. Biol. Chem. 282, 28884–28892 [DOI] [PubMed] [Google Scholar]
- 18. Allen W. J., Rothwell P. J., Waksman G. (2008) An intramolecular FRET system monitors fingers subdomain opening in Klentaq1. Protein Sci. 17, 401–408 [DOI] [PMC free article] [PubMed] [Google Scholar]
- 19. Purohit V., Grindley N. D., Joyce C. M. (2003) Use of 2-aminopurine fluorescence to examine conformational changes during nucleotide incorporation by DNA polymerase I (Klenow fragment). Biochemistry 42, 10200–10211 [DOI] [PubMed] [Google Scholar]
- 20. Xu C., Maxwell B. A., Brown J. A., Zhang L., Suo Z. (2009) Global conformational dynamics of a Y-family DNA polymerase during catalysis. PLoS Biol. 7, e1000225. [DOI] [PMC free article] [PubMed] [Google Scholar]
- 21. Maxwell B. A., Xu C., Suo Z. (2012) DNA lesion alters global conformational dynamics of Y-family DNA polymerase during catalysis. J. Biol. Chem. 287, 13040–13047 [DOI] [PMC free article] [PubMed] [Google Scholar]
- 22. Johnson A. A., Johnson K. A. (2001) Exonuclease proofreading by human mitochondrial DNA polymerase. J. Biol. Chem. 276, 38097–38107 [DOI] [PubMed] [Google Scholar]
- 23. Shamoo Y., Steitz T. A. (1999) Building a replisome from interacting pieces: sliding clamp complexed to a peptide from DNA polymerase and a polymerase editing complex. Cell 99, 155–166 [DOI] [PubMed] [Google Scholar]
- 24. Beese L. S., Derbyshire V., Steitz T. A. (1993) Structure of DNA polymerase I Klenow fragment bound to duplex DNA. Science 260, 352–355 [DOI] [PubMed] [Google Scholar]
- 25. Freemont P. S., Friedman J. M., Beese L. S., Sanderson M. R., Steitz T. A. (1988) Cocrystal structure of an editing complex of Klenow fragment with DNA. Proc. Natl. Acad. Sci. U.S.A. 85, 8924–8928 [DOI] [PMC free article] [PubMed] [Google Scholar]
- 26. Luo G., Wang M., Konigsberg W. H., Xie X. S. (2007) Single-molecule and ensemble fluorescence assays for a functionally important conformational change in T7 DNA polymerase. Proc. Natl. Acad. Sci. U.S.A. 104, 12610–12615 [DOI] [PMC free article] [PubMed] [Google Scholar]
- 27. Santoso Y., Joyce C. M., Potapova O., Le Reste L., Hohlbein J., Torella J. P., Grindley N. D., Kapanidis A. N. (2010) Conformational transitions in DNA polymerase I revealed by single-molecule FRET. Proc. Natl. Acad. Sci. U.S.A. 107, 715–720 [DOI] [PMC free article] [PubMed] [Google Scholar]
- 28. Christian T. D., Romano L. J., Rueda D. (2009) Single-molecule measurements of synthesis by DNA polymerase with base-pair resolution. Proc. Natl. Acad. Sci. U.S.A. 106, 21109–21114 [DOI] [PMC free article] [PubMed] [Google Scholar]
- 29. Markiewicz R. P., Vrtis K. B., Rueda D., Romano L. J. (2012) Single-molecule microscopy reveals new insights into nucleotide selection by DNA polymerase I. Nucleic Acids Res. 40, 7975–7984 [DOI] [PMC free article] [PubMed] [Google Scholar]
- 30. Berezhna S. Y., Gill J. P., Lamichhane R., Millar D. P. (2012) Single-molecule Förster resonance energy transfer reveals an innate fidelity checkpoint in DNA polymerase I. J. Am. Chem. Soc. 134, 11261–11268 [DOI] [PMC free article] [PubMed] [Google Scholar]
- 31. Choi J. Y., Eoff R. L., Pence M. G., Wang J., Martin M. V., Kim E. J., Folkmann L. M., Guengerich F. P. (2011) Roles of the four DNA polymerases of the crenarchaeon Sulfolobus solfataricus and accessory proteins in DNA replication. J. Biol. Chem. 286, 31180–31193 [DOI] [PMC free article] [PubMed] [Google Scholar]
- 32. Heyduk T., Ma Y., Tang H., Ebright R. H. (1996) Fluorescence anisotropy: rapid, quantitative assay for protein-DNA and protein-protein interaction. Methods Enzymol. 274, 492–503 [DOI] [PubMed] [Google Scholar]
- 33. Selvin P. R., Ha T. (2008) Single-molecule Techniques: a Laboratory Manual, pp. 3–36, Cold Spring Harbor Laboratory Press, Cold Spring Harbor, NY [Google Scholar]
- 34. Carver T. E., Jr., Hochstrasser R. A., Millar D. P. (1994) Proofreading DNA: recognition of aberrant DNA termini by the Klenow fragment of DNA polymerase I. Proc. Natl. Acad. Sci. U.S.A. 91, 10670–10674 [DOI] [PMC free article] [PubMed] [Google Scholar]
- 35. Ortiz T. P., Marshall J. A., Meyer L. A., Davis R. W., Macosko J. C., Hatch J., Keller D. J., Brozik J. A. (2005) Stepping statistics of single HIV-1 reverse transcriptase molecules during DNA polymerization. J. Phys. Chem. B 109, 16127–16131 [DOI] [PubMed] [Google Scholar]
- 36. Savino C., Federici L., Johnson K. A., Vallone B., Nastopoulos V., Rossi M., Pisani F. M., Tsernoglou D. (2004) Insights into DNA replication: the crystal structure of DNA polymerase B1 from the archaeon Sulfolobus solfataricus. Structure 12, 2001–2008 [DOI] [PubMed] [Google Scholar]
- 37. Hopfner K. P., Eichinger A., Engh R. A., Laue F., Ankenbauer W., Huber R., Angerer B. (1999) Crystal structure of a thermostable type B DNA polymerase from Thermococcus gorgonarius. Proc. Natl. Acad. Sci. U.S.A. 96, 3600–3605 [DOI] [PMC free article] [PubMed] [Google Scholar]
- 38. Rodriguez A. C., Park H. W., Mao C., Beese L. S. (2000) Crystal structure of a polα family DNA polymerase from the hyperthermophilic archaeon Thermococcus sp. 9°N-7. J. Mol. Biol. 299, 447–462 [DOI] [PubMed] [Google Scholar]
- 39. Zhao Y., Jeruzalmi D., Moarefi I., Leighton L., Lasken R., Kuriyan J. (1999) Crystal structure of an archaebacterial DNA polymerase. Structure 7, 1189–1199 [DOI] [PubMed] [Google Scholar]
- 40. Hashimoto H., Nishioka M., Fujiwara S., Takagi M., Imanaka T., Inoue T., Kai Y. (2001) Crystal structure of DNA polymerase from hyperthermophilic archaeon Pyrococcus kodakaraensis KOD1. J. Mol. Biol. 306, 469–477 [DOI] [PubMed] [Google Scholar]
- 41. Joyce C. M., Potapova O., Delucia A. M., Huang X., Basu V. P., Grindley N. D. (2008) Fingers-closing and other rapid conformational changes in DNA polymerase I (Klenow fragment) and their role in nucleotide selectivity. Biochemistry 47, 6103–6116 [DOI] [PubMed] [Google Scholar]
- 42. Kornberg A. (1980) DNA Replication, pp. 101–166, W. H. Freeman, San Francisco [Google Scholar]
- 43. Rittinger K., Divita G., Goody R. S. (1995) Human immunodeficiency virus reverse transcriptase substrate-induced conformational changes and the mechanism of inhibition by nonnucleoside inhibitors. Proc. Natl. Acad. Sci. U.S.A. 92, 8046–8049 [DOI] [PMC free article] [PubMed] [Google Scholar]
- 44. Wöhrl B. M., Krebs R., Goody R. S., Restle T. (1999) Refined model for primer/template binding by HIV-1 reverse transcriptase: pre-steady-state kinetic analyses of primer/template binding and nucleotide incorporation events distinguish between different binding modes depending on the nature of the nucleic acid substrate. J. Mol. Biol. 292, 333–344 [DOI] [PubMed] [Google Scholar]
- 45. Wong J. H., Fiala K. A., Suo Z., Ling H. (2008) Snapshots of a Y-family DNA polymerase in replication: substrate-induced conformational transitions and implications for fidelity of Dpo4. J. Mol. Biol. 379, 317–330 [DOI] [PubMed] [Google Scholar]