Abstract
Purpose.
To study sequential changes in retinal ganglion cell (RGC) morphology in mice after optic nerve crush and after induction of experimental glaucoma.
Methods.
Nerve crush or experimental glaucoma was induced in mice that selectively express yellow fluorescent protein (YFP) in RGCs. Mice were euthanized 1, 4, and 9 days after crush and 1, 3, and 6 weeks after induction of glaucoma by bead injection. All YFP-RGCs were identified in retinal whole mounts. Then confocal images of randomly selected RGCs were quantified for somal fluorescence brightness, soma size, neurite outgrowth, and dendritic complexity (Sholl analysis).
Results.
By 9 days after crush, 98% of RGC axons died and YFP-RGCs decreased by 64%. After 6 weeks of glaucoma, 31% of axons died, but there was no loss of YFP-RGC bodies. All crush retinas combined had significant decreases in neurite outgrowth parameters (P ≤ 0.036, generalized estimating equation [GEE] model) and dendritic complexity was lower than controls (P = 0.017, GEE model). There was no change in RGC soma area after crush. In combined glaucoma data, the RGC soma area was larger than control (P = 0.04, GEE model). At 3 weeks, glaucoma RGCs had significantly larger values for dendritic structure and complexity than controls (P = 0.044, GEE model), but no statistical difference was found at 6 weeks.
Conclusions.
After nerve crush, RGCs and axons died rapidly, and dendritic structure decreased moderately in remaining RGCs. Glaucoma caused an increase in RGC dendrite structure and soma size at 3 weeks.
Retinal ganglion cell morphology after optic nerve crush and experimental glaucoma.
Introduction
Glaucoma represents a group of neurodegenerative diseases whose pathological hallmark is retinal ganglion cell (RGC) death. In human and experimental models of glaucoma RGCs undergo apoptosis, a programmed cell death.1–4 There are likely to be initial signals of injury, probably from the site or sites of damage, one of which is the optic nerve head.5 Although there are clearly destructive events in RGC anatomy that precede death, it is not clear what the time course or specific features of such changes might be. Functional losses in presumed RGC behavior have been reported in human eyes6 and in primate7,8 and mouse9,10 models of glaucoma using pattern-evoked electroretinography (ERG) and intracellular recordings from individual cells. If these functional deficits are accompanied by early structural alterations in RGC anatomy, earlier or more objective identification of glaucoma injury may be facilitated.
Since the nineteenth century, when Golgi introduced silver staining to permit a view of the dendritic structure of single neurons, different approaches to visualize detailed dendritic neuronal morphology have been developed. These include intracellular single-cell dye injections11 and biolistic delivery of lipophilic dye-coated particles12 among others. Feng and colleagues13 generated mouse strains that express fluorescent proteins only in a subset of cells and allow detail and precise visualization of cell soma, axon, and dendritic tree branches. One such strain with RGC-specific yellow fluorescent protein (YFP) labeling has been used to image the same RGC over time in vivo.14,15 We reported a semiautomated method to evaluate RGC morphology in these selective YFP-expressing mice,16 describing the total number of YFP-expressing RGCs and their distribution within the retina. In this study, we applied this method to evaluate quantitatively the RGC morphology in mice that selectively express YFP after optic nerve crush or the induction of experimental glaucoma.
Materials and Methods
Animals
Mice that express YFP in a small subset of RGCs were used [B6.Cg-Tg(Thy1-YFPH)2Jrs/J strain; Jackson Laboratory, Bar Harbor, ME]. All animals were treated in accordance with the ARVO Statement for the Use of Animals in Ophthalmic and Vision Research and the EC Directive 86/609/EEC for animal experiments, using protocols approved and monitored by the Johns Hopkins University School of Medicine Animal Care and Use Committee. A total of 22 female and 14 male mice, all between 4 and 10 months old, were used in this study.
Optic Nerve Crush
Mice were anesthetized with an intraperitoneal (IP) injection of ketamine, xylazine, and acepromazine (50, 10, and 2 mg/kg, respectively), and 0.5% proparacaine hydrochloride ophthalmic drops were applied to the eye. Ophthalmic ointment was applied to both eyes to ensure corneas did not dry out during the procedure. An incision was made in the superior conjunctiva to allow gentle outward retraction of the globe using fine forceps. The muscle cone was entered and the optic nerve was exposed and crushed with self-closing forceps for 3 seconds. Animals were euthanized after 1 day (n = 5), 4 days (n = 5), and 9 days (n = 4).
Experimental Glaucoma
Experimental glaucoma was induced by polystyrene bead injection in the anterior chamber using a protocol that was recently updated.17 Briefly, a glass cannula with a 50–μm-diameter tip was connected by polyethylene tubing to a precision fluid measuring syringe (Hamilton Company, Reno, NV). We drew into the cannula 1 μL of viscoelastic solution (10 mg/mL sodium hyaluronate; Healon; Advanced Medical Optics Inc., Santa Ana, CA), followed by 2 μL of 1-μm-diameter beads (Polybead Microspheres; Polysciences, Inc., Warrington, PA), and finally 2 μL of 6-μm-diameter beads (the 4 + 1 protocol). The mice were euthanized 1 week (n = 7), 3 weeks (n = 8), and 6 weeks (n = 7) after the bead injection.
Intraocular Pressure Measurement
Intraocular pressure (IOP) measurements were taken using a commercial tonometer (TonoLab; TioLat, Inc., Helsinki, Finland). In the optic nerve crush group, IOPs were taken of both eyes. The animals were under IP ketamine, xylazine, and acepromazine sedation as described earlier. Measurements were taken just prior to surgery and immediately before euthanasia. In the experimental glaucoma group, IOP measurements were made in both eyes under this IP anesthesia or with 2.5% isoflurane in oxygen inhalation anesthesia using a commercial rodent circuit controller anesthesia system (RC2–Rodent Circuit Controller; VetEquip, Inc., Pleasanton, CA).17 IOP was measured before bead injection, on the first and third days after injection and weekly thereafter until euthanasia.
Tissue Preparation
Animals were anesthetized as before (IP) and perfused transcardially for 1 minute with saline followed by 9 minutes with 4% paraformaldehyde in 0.1 M phosphate buffer solution (PB), pH 7.2. The superior pole of each eye was marked for orientation, the eyes were enucleated, and their retinas were detached from the sclera. Retinas were postfixed as whole mounts for 24 hours in the same fixative solution. Next, retinas were washed with 0.1 M PB, pH 7.2, flat mounted on a glass slide in glycerol with the RGC layer up, and coverslipped.
YFP-Positive RGC Quantification and Distribution
The number and distribution of RGCs expressing YFP were measured with a commercial software system (Stereo Investigator software; MicroBrightField [MBF] Bioscience, Williston, VT) in an integrated hardware-software apparatus (ECLIPSE E600 microscope; Nikon, Inc., Melville, NY), with a charge-coupled device color video camera (3-Chip, HV-C20; Hitachi, Inc., Pleasanton, CA) and motorized stage with a microcator attachment providing a 0.1-μm resolution in the z axis. Approximately 90% of YFP-expressing cells had a visible axon, confirming their identity. RGCs were subjectively characterized based on their level of YFP expression as bright or dim. The validation of this qualitative distinction of cell soma brightness was evaluated in our initial study.16 All RGCs were segregated relative to their position within each retinal quadrant (superior, inferior, nasal, and temporal), or central versus peripheral regions (defined by a demarcation that was halfway from the optic disc to the periphery of the whole mount).
Confocal Imaging, Neurite Outgrowth Parameters, and Sholl Analysis
Four to six randomly selected RGCs from each of the eight areas of the retina (e.g., peripheral/nasal, central/superior, etc.) were recorded as z-stack images (Zeiss LSM510 Meta Confocal Microscope; Zeiss MicroImaging, Thornwood, NY). In general, this was comprised of more than half of all detectable RGCs in each retina. Images were taken to include the entire dendritic field of each cell in a series along the z axis (perpendicular to the optic axis). The following channel settings for imaging were used: excitation at 514 nm = 17.9, pinhole = 1 Airy unit, detector gain = 764, amplifier offset = 0.057, amplifier gain = 1. A measurement was made of the thickness of the dendritic fields in the z axis by noting the distance (in μm) from the axon hillock at the cell body to the last plane in which the dendrites were still visible. No cells were used in which the dendritic fields of two RGCs overlapped. The captured z stack images were converted into a 2-dimensional (2D) single projection image. This 2D image was then exported as a 16-bit TIFF format grayscale image using commercial software for further analysis (Zeiss LSM510).
Confocal images contained only one cell of interest and each cell was outlined, copied, and pasted into a new image with a black background using commercial photo-editing software (Adobe Photoshop software, version 7.0; Adobe Systems, San Jose, CA). Next, the image of each RGC was imported using an automated macro16 to determine features of cell morphology and the mean intensity of YFP expression in its soma using commercial image analysis software (MetaMorph Offline, version 7.7.0.0; Molecular Devices, Sunnyvale, CA). This included both a proprietary neurite outgrowth measurement program (MetaMorph) and our specially designed Sholl analysis based on a template of 10 concentric circles centered on the soma, from 50 to 500 μm, increasing in 50-μm steps.
Because of the diversity of YFP expression among RGCs, the analysis settings were customized for the two subjective brightness levels. For brighter cells, the minimum intensity of the neurite outgrowth analysis was set to 3500 gray levels. The latter intensity level was too high for dimmer cell details to be recognized by the software. Therefore, the minimum intensity of neurite outgrowth for dim cells was set to 2000 gray levels. In the majority of cases only the primary dendritic processes of dim YFP cells were detectable either to the observer or using commercial software (MetaMorph). The quantitative data for both bright and dim cells were then combined in the overall analysis.
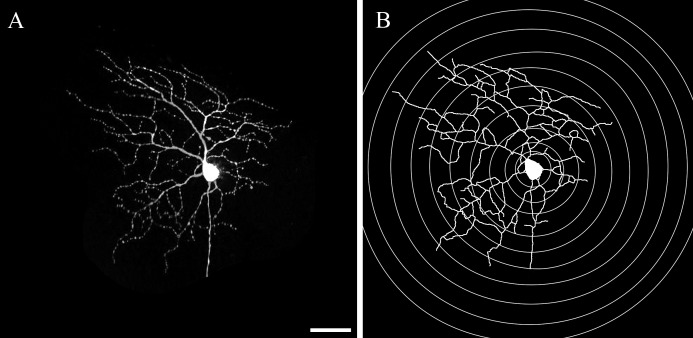
The neurite outgrowth analysis provided the cell soma area; total length of all dendrites (outgrowth); number of primary processes that emanated from the cell soma; number of branches of all the processes; and the mean, median, and maximum process lengths (Fig. 1).
Figure 1. .
The neurite outgrowth and Sholl analysis from 16-bit TIFF image. (A) A 2-dimensional 16-bit TIFF image was generated from the z-stack of images that were captured using confocal miscroscopy. (B) The automated macro contains both a proprietary neurite outgrowth measurement and Sholl analysis. Scale bar: 50 μm.
The Sholl analysis counts the number of dendritic processes that intersect each of the 10 increasingly larger concentric rings centered on the soma, which allows evaluation of cell dendritic branching (Fig. 1).18 For this approach, the investigator exported the data for each ring into newly generated log images. Then, the automated Sholl macro determined the sum of intersections between each ring and dendritic processes.19 In the biostatistical analysis, a graph was made of the number of processes at each incremental, 50-μm ring outside the cell body. The area under the curve for these data was used as the parameter of interest.
Statistical Analysis
We compared the mean values of outcomes that were normally distributed with parametric statistical tests and used median values with nonparametric testing or performed a square-root transformation for parameters that were not normally distributed. Independent samples t-test was used to compare the IOPs between experimental glaucoma eyes and their contralateral controls at each time point. One-way ANOVA with Bonferroni post hoc test for multiple comparisons was used to compare numbers of YFP-expressing RGCs between different retinal quadrants from different treatment groups. From the neurite outgrowth data, only cell body area and number of processes were normally distributed, so initial evaluations of these two parameters were performed by t-test to compare the mean difference between control and treatment group. For the other parameters, we used Wilcoxon rank-sum tests. RGCs from the eyes of a single mouse were presumed to be correlated in structure more than RGCs from two random eyes. To account for correlation of data within an eye, we constructed generalized estimating equation (GEE) models. Since it was possible that parameters would be affected by the degree of overall RGC damage, we also constructed GEE models with adjustment for the degree of axon loss in individual eyes. The data were analyzed using a commercial analytical software program (SPSS for Windows, v. 19.0; SPSS Inc., Chicago, IL or SAS software, v. 9.2; SAS Inc., Cary, NC).
Results
Intraocular Pressure
The IOP under anesthesia and before induction of experimental glaucoma was 9.9 ± 0.5 (mean ± SEM). Injection of beads with viscoelastic solution significantly increased IOPs at all time points except for the 1-week time point in the 1-week group; 3-week time point in the 3-week group; and 2-, 5-, and 6-week time points in the 6-week group (Fig. 2; independent samples t-test, all values of P ≤ 0.05).
Figure 2. .
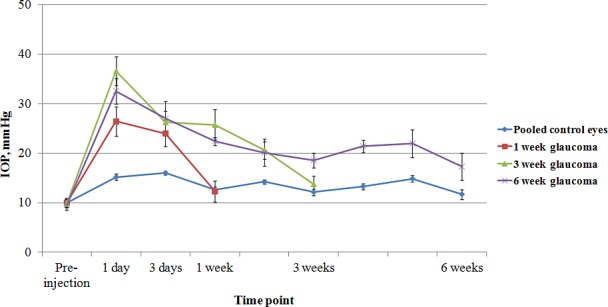
The IOP from the 1-, 3-, and 6-week glaucoma groups and the pooled controls from all groups (mean ± SEM).
Axon Loss
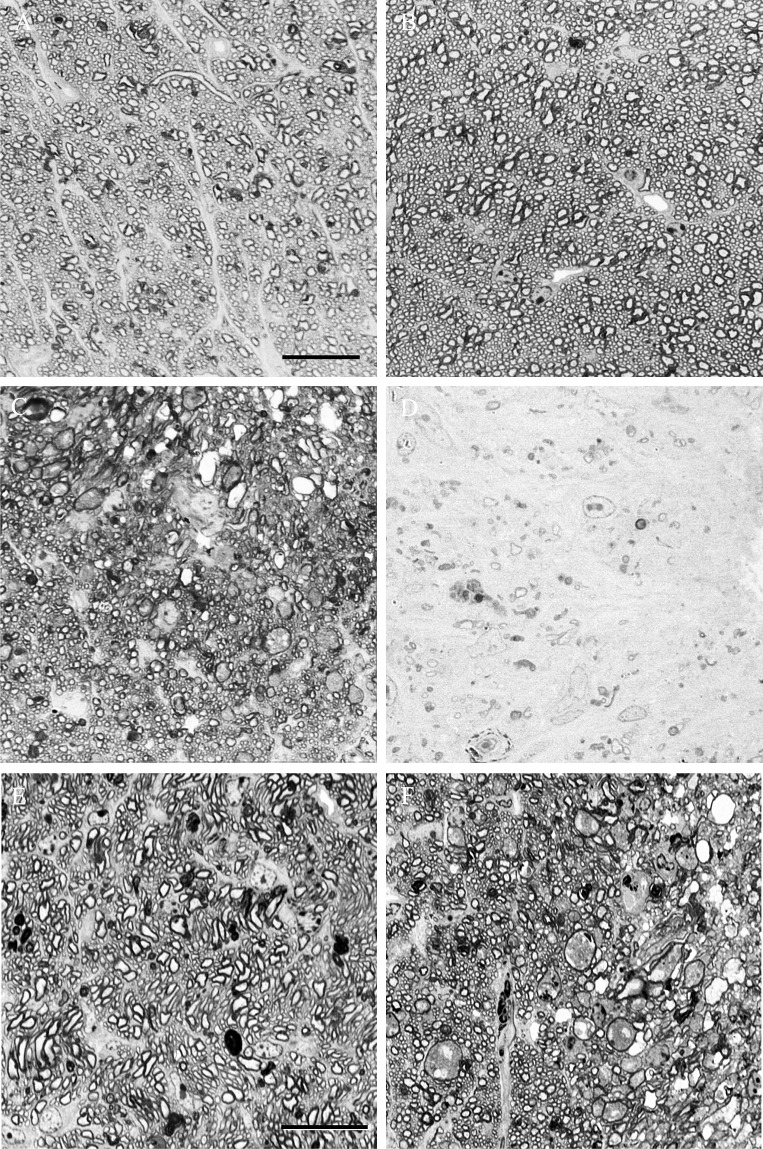
The decrease in axons in the retrobulbar optic nerve was substantially greater and more rapid in the crush model than that in glaucoma eyes (Fig. 3, Table 1). All groups except the 1-week glaucoma nerves had statistically significant RGC axon loss.
Figure 3. .
High-magnification photomicrographs showing optic nerve sections from the control eye (A) and optic nerve crush eyes that were graded as having mild (B), moderate (C), and severe (D) optic nerve damage. Scale bar: 20 μm. Moderate optic nerve damage in experimental glaucoma (E) and optic nerve crush (F). Scale bar: 20 μm.
Table 1. .
Axon Loss in Crush and Glaucoma Optic Nerves
|
n
(Mice) |
Axon Loss |
P
Value* |
||
|
Mean ± SD |
Median |
|||
| Optic nerve crush | ||||
| 1 day | 5 | 44 ± 30% | 52% | 0.03 |
| 4 days | 4 | 87 ± 13% | 94% | 0.0008 |
| 9 days | 3 | 98 ± 1.0% | 98% | <0.0001 |
| Experimental glaucoma | ||||
| 1 week | 5 | 21 ± 24% | 10% | 0.12 |
| 3 weeks | 8 | 17 ± 11% | 17% | 0.004 |
| 6 weeks | 7 | 31 ± 24% | 23% | 0.01 |
t-test compared each time point group to its matched control group in axon number; optic nerves were not successfully prepared in four treated eyes.
Distribution and Number of YFP-Expressing RGCs
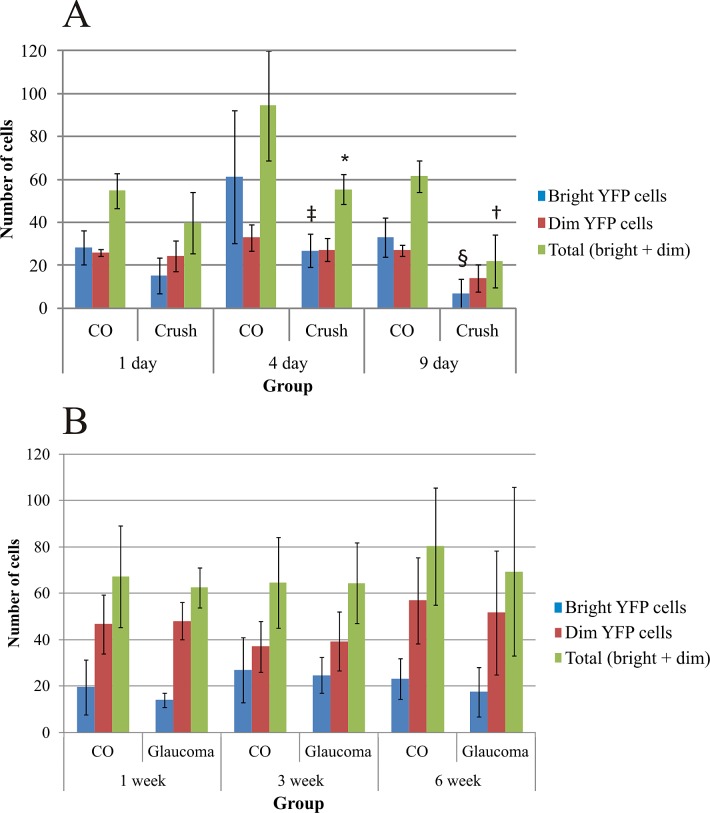
Distribution of YFP-expressing RGCs in the retina was the highest in the temporal quadrant and the lowest in the nasal quadrant as described previously.16 Optic nerve crush significantly decreased the number of YFP cells in the superior, nasal, and inferior quadrants (ANOVA, all values of P ≤ 0.05), but a nonsignificant decrease from 32 ± 8 (mean ± SD) YFP cells from the 1-day crush eyes to 20 ± 6 YFP-expressing RGCs from the 9-day crush eyes was found in the temporal quadrant. No statistically significant changes were found in the experimental glaucoma eyes. We randomly selected for analysis 589 RGCs in optic nerve crush groups: 360 from contralateral, control eyes and 229 RGCs from the optic nerve crush eyes. Likewise, we analyzed 736 RGCs in the glaucoma groups, 382 control RGCs, and 354 RGCs from glaucoma eyes. The total number of YFP-positive RGCs per control eye varied from 54.8 to 94.4 in the six experimental groups (Fig. 4). From 1 to 4 to 9 days after nerve crush, the total number of YFP-expressing RGCs in the experimental eyes decreased monotonically as a percentage of controls, from 72.6% to 58.7% to 35.8%, respectively. The 4- and 9-day decreases in YFP-expressing RGCs were significant (Fig. 4A; independent samples t-tests, P = 0.024 and P = 0.001, respectively), whereas the decrease at 1 day was not (P = 0.077). The proportion of bright cells compared with dim cells decreased in crush eyes compared with controls at all three time points, and the declines in bright cells at 4 and 9 days were significant (Fisher's exact test, P = 0.03 and P = 0.002, respectively).
Figure 4. .
The total number of YFP-expressing RGCs and the number of bright and dim YFP cells as counted from the whole-mounted retinas from the eyes of optic nerve crush (A) and glaucoma (B) groups. Data are presented as mean ± SD. The statistically significant differences were found in the total number of YFP RGCs between the 4 (*independent samples t-test, P = 0.024) and 9 (†P = 0.001) day control and optic nerve crush eyes, and in the bright YFP cell numbers between the 4 (‡Fisher's exact test, P = 0.03) and 9 (§P = 0.002) day control and optic nerve crush eyes.
In glaucoma eyes, there was no significant change from control in the total number of bright plus dim YFP cells at 1, 3, or 6 weeks. Nor was the ratio of bright to dim cells significantly different between glaucoma and control eyes at any of the three time points (Fig. 4B; Fisher's exact test, all values of P > 0.05).
In addition to dividing cells into two groups by brighter and dimmer cell body fluorescence, RGC data were analyzed with individual cell soma intensity as a continuous parameter, compared quantitatively and graphically between experimental and control groups (Figs. 5, 6). In the commercial measurement software (MetaMorph), the peak level for the brightness is 65,535 gray levels. As seen graphically in the crush data, at 4 and 9 days, when the number of RGCs had significantly decreased, the curve describing the distribution of maximum brightness level per RGC shifted to the left, especially when compared with its time-matched control eyes. The falloff in the proportion of RGCs with the brightest level declined at all three time points, particularly at 9 days. This confirms the shift to fewer RGCs subjectively classified as bright seen above for crush data.
Figure 5. .
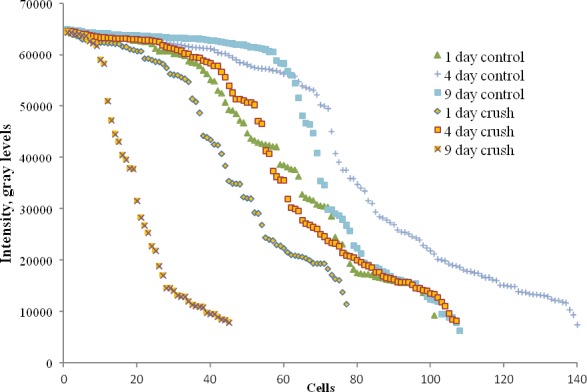
RGC soma intensity in crush and control eyes.
Figure 6. .
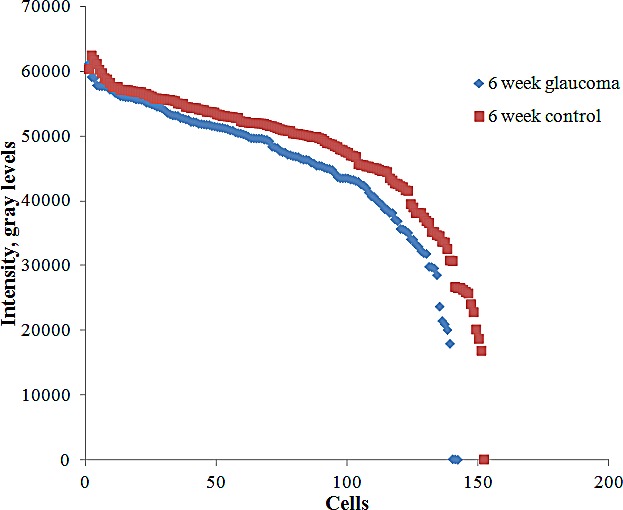
Cell soma intensity in 6-week glaucoma and control groups.
When we compared the somal intensity by time after crush against controls statistically, the 9-day crush value was significantly different from fellow eye data, but this difference was not significant at 1 and 4 days (Table 2).
Table 2. .
RGC Soma Intensity in Crush and Control Groups
|
1 Day Control |
1 Day Crush |
4 Day Control |
4 Day Crush |
9 Day Control |
9 Day Crush |
|
| N | 101 | 77 | 140 | 107 | 108 | 45 |
| Median | 43,721 | 43,977 | 50,172 | 46,593 | 61,203 | 25,344 |
| P value* | NS | NS | 0.0003 | |||
Mann-Whitney Utest.
In experimental glaucoma eyes, the soma intensity of RGCs from experimental glaucoma eyes did not differ significantly from contralateral control eyes at 1 and 3 weeks, but was significantly decreased at 6 weeks, although the difference was only 5% (Table 3, P = 0.04, Mann–Whitney U test). The distribution of brightness for the 6-week glaucoma and control eyes is shown in Figure 6.
Table 3. .
RGC Soma Intensity in Glaucoma and Control
|
Median Intensity |
P
Value* |
||
|
Control |
Glaucoma |
||
| 1 week | 24,296 | 20,728 | 0.4 |
| 3 weeks | 40,442 | 43,328 | 0.5 |
| 6 weeks | 50,946 | 48,422 | 0.04 |
Mann-Whitney Utest.
Quantitative RGC Morphology Measurements
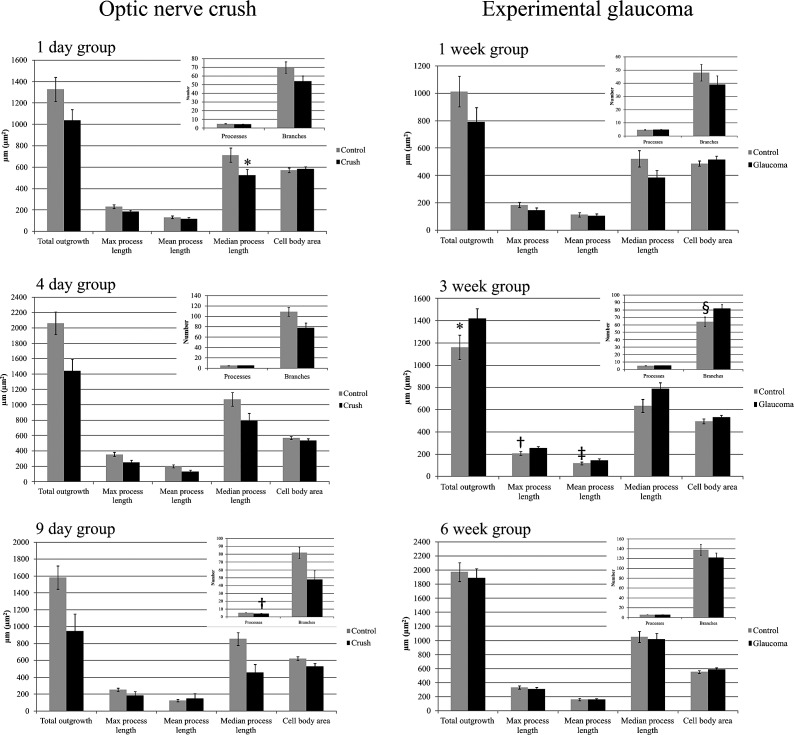
In the crush groups, RGCs in injured retinas had decreased values for all time points combined in total outgrowth, maximum process length, mean process length, median process length, and number of dendritic branches (all values of P ≤ 0.036, GEE model; see Table 4 and Figs. 7, 8). At individual time points, the crush eyes had significantly decreased values compared with controls in number of processes at 9 days and median process length at 1 day (Figs. 7, 8). The Sholl analysis in crush eyes showed lower dendritic tree complexity values in RGCs from experimental eyes for all time points combined as compared with control eyes (P = 0.017, GEE model). Cell body area did not change significantly at any time point. The percentage change in selected parameters at the three time points showed somewhat greater declines at 9 days compared with earlier times in some values, but no monotonic trends (Table 5). When neurite outgrowth data from different retinal quadrants were compared, the cell somal area in the superior and nasal quadrants as well as the total outgrowth, number of primary processes, mean process length, and maximum process length in the nasal quadrant were significantly lower as compared with the same parameters from the temporal quadrant (Mann–Whitney U test, P ≤ 0.05 for all). However, this effect was seen only in the 1-day optic nerve crush group.
Table 4. .
Overall Comparison of Dendritic Structure Analysis between Crush and Control Eyes
|
Parameter |
Control |
Crush |
P
Value* |
||
|
Mean ± SD |
Median |
Mean ± SD |
Median |
||
| Total outgrowth | 1658 ± 1458 | 1417 | 1164 ± 1282 | 635 | 0.014 |
| Processes | 5.2 ± 2.1 | 5.0 | 4.7 ± 2.0 | 5.0 | 0.053 |
| Max process length | 858 ± 830 | 636 | 638 ± 782 | 310 | 0.032 |
| Mean process length | 281 ± 241 | 244 | 206 ± 225 | 122 | 0.021 |
| Median process length | 161 ± 185 | 81 | 117 ± 184 | 52 | 0.036 |
| Branches | 86.7 ± 80.9 | 69.0 | 63.1 ± 77.4 | 24.0 | 0.024 |
| Cell body area | 591 ± 223 | 578 | 551 ± 232 | 527 | 0.121 |
| Sholl: area under the curve | 43.6 ± 40.8 | 36.5 | 29.9 ± 34.9 | 12.5 | 0.017 |
Statistically significant P values are in bold.
Generalized estimating equation model.
Figure 7. .
RGC body area (in μm2) and neurite outgrowth parameters for crush and glaucoma eyes. GEE model for optic nerve crush groups: *P < 0.001, †P = 0.007; GEE model for experimental glaucoma groups: *P = 0.042, †P = 0.026, ‡P = 0.017, §P = 0.015.
Figure 8. .
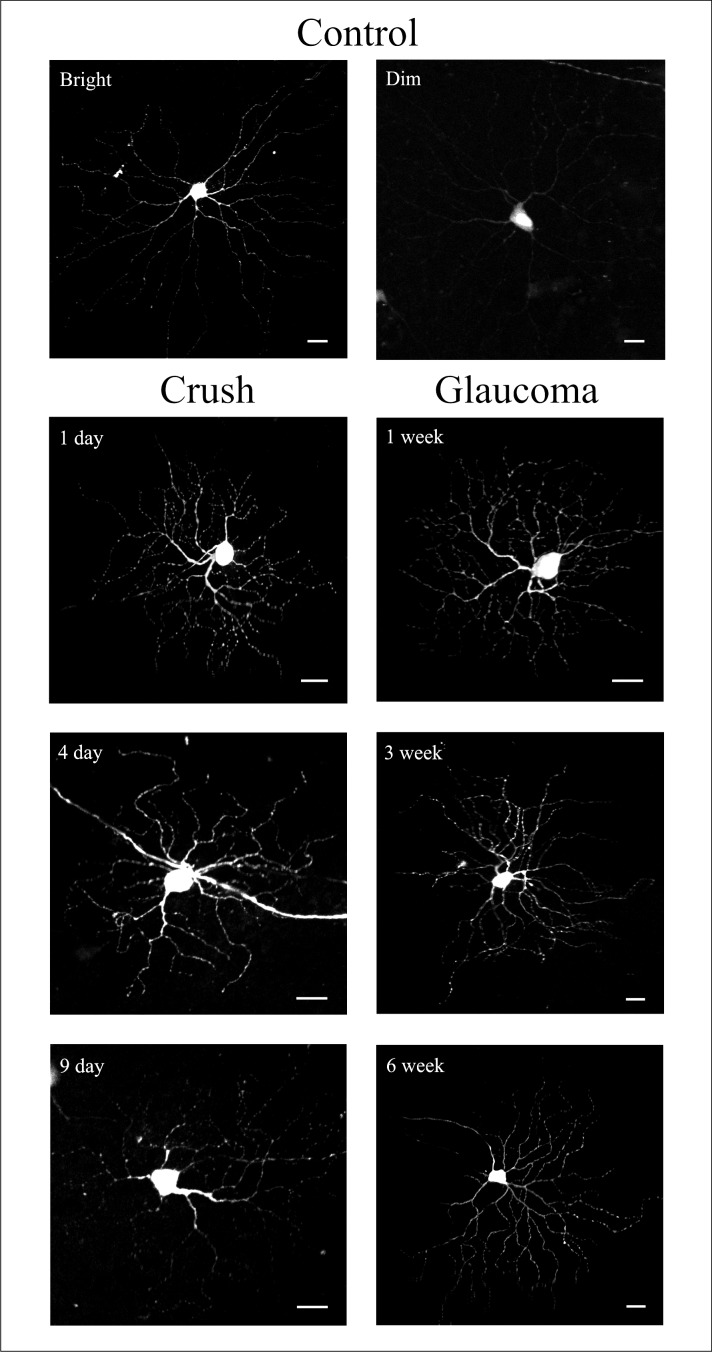
YFP-expressing RGCs from control eyes and experimental groups. YFP-containing RGCs were subjectively classified into bright and dim cells (Control group panel). Crush and glaucoma panels show only bright RGCs from different experimental groups. Scale bar: 20 μm.
Table 5. .
Selected Parameters of Crush Eyes Compared with Control (Percentage Change)
|
Total Outgrowth (μm) |
Processes
(n) |
Median Length
(μm) |
Branches
(n) |
Soma Area (μm2) |
|
| 1 day | ↓22% | ↓10% | ↓26% | ↓23% | ↑2% |
| 4 days | ↓30% | ↓2% | ↓26% | ↓28% | ↓6% |
| 9 days | ↓40% | ↓20% | ↓47% | ↓41% | ↓15% |
↓ - decrease; ↑ - increase.
We also examined whether the degree of axon loss in each eye was associated with any changes in the parameters of RGC morphology. GEE models were constructed that evaluated each parameter in association with percentage loss of axons. There was no significant association between axon loss and any neurite outgrowth parameter for crush or glaucoma eyes.
Discussion
We found that RGCs after optic nerve crush had significant decreases in morphologic measurements after injury. These decreases included a decline in the overall fluorescence of the population of remaining RGCs, as well as decreases in total outgrowth, length of dendritic processes, and number of branches compared with contralateral controls. As might be expected, the changes were greater in magnitude at 9 days than initially. By 9 days, nearly all axons in the optic nerve were either gone or degenerate. Conversely, 9-day crush retinas retained 36% of the control number of YFP RGC bodies. Clearly, these represented RGCs with severe axonal injury that, although showing declines in fluorescence from control, still retained much of their basic dendritic structure. The dissociation in time between earlier axon loss and later RGC body death has been frequently documented in mammalian retina.20 Dendritic shrinkage after optic nerve crush has been documented histologically in cats.21 Leung et al.22 studied the same YFP-expressing mouse strain after nerve crush with in vivo imaging of the same RGCs over time. They documented dendritic constriction in 68% of 125 RGCs studied in 12 mice. We were not able to compare directly the data from their study with ours, because the outcomes for various dendritic parameters were not presented. We can note that both in vivo and in vitro studies of the same model give generally similar findings.
In experimental glaucoma eyes, RGCs had a dendritic and somal structure that was not significantly decreased from controls. In fact, in some select features, the RGCs at 3 weeks after induction of elevated IOP had greater dendritic complexity than that of control eyes. The fact that this trend was not present at 6 weeks could be interpreted in two ways. First, it could be that our large data set of RGCs led to a finding of increase due to random variation in YFP expression that nonetheless achieved statistical significance. Second, there may be a phase after injury from elevated IOP in which RGCs are stimulated to expand their dendritic range, possibly only temporarily. If there is an initial phase of glaucomatous pathology that induces morphologic plasticity,23 it will require further study to determine if this involves an increased number of synaptic contacts and compensatory functional activity. Presumably, the expansion of dendritic range, if confirmed, might be an attempt by some RGCs to occupy the abandoned receptive field coverage of RGCs that have died by 3 weeks.
The general lack of change in RGC dendritic structure and the insignificant change in number of YFP-positive RGCs after 6 weeks of experimental glaucoma is in contrast to the loss of nearly a third of the axons in the optic nerve of these eyes. Clearly, a substantial minority of RGCs were injured sufficiently that terminal axon loss (and ultimately somal loss) had been induced. Yet, we found no significant decrease in dendritic structure, as was seen in the retinas of optic nerve crush eyes. There are several possible explanations for this finding. First, it could be that there is a longer delay than 6 weeks in RGC change in the retina after glaucoma injury. However, in the one third of RGCs whose axons had degenerated at 6 weeks this would suggest that no anatomic change was present or at least was detectable by our methods. Second, it could be that anatomic change happens in the dendrites of glaucoma-injured RGCs, but the cell dies so quickly thereafter that few altered, but still surviving (temporarily), RGCs were seen in our specimens. Finally, it might be that YFP-expressing RGCs are selectively insensitive to glaucoma injury. We have no evidence that they represent some particular class of RGCs and, in fact, they were present centrally and peripherally, as well as showing anatomic features of a variety of RGC types that we identified by cluster analysis.16 There is evidence in DBA/2J glaucoma mice that RGC loss is not selective for particular RGC types in murine models.24
The RGC somal area did not differ at any time point studied in either crush or glaucoma retinas among RGCs that were detectable. Since overall fluorescence declined in both models in injured retinas, it is feasible that the cell soma in a few cells became so dimly fluorescent that it was not detectable, and these could have had a reduced cell body area. However, this would occupy only a very small number of RGCs, particularly in the glaucoma retinas where the number of detectable RGCs did not decline from controls. Whether there is “shrinkage” of RGC body size or dendritic structure prior to their death from glaucoma has been studied by a variety of techniques, and in both human postmortem tissue and animal models. With regard to cell body size, there are a number of reports suggesting that, although all RGCs are ultimately susceptible to glaucoma, larger RGCs with larger axon diameter die preferentially in human glaucoma25–27 and in experimental glaucoma in monkey,28–33 cat,34 and quail.35 One investigator36,37 studied six experimental monkey eyes and proposed a hypothesis that RGCs shrink prior to death, a finding supported by studies of dye-injected RGCs in glaucomatous monkeys.38 Certainly, the soma shrinks as it dies from apoptosis, a fact known since Kerr et al.39 first described the process. However, from initiation to cell disappearance, the apoptotic process generally occurs rapidly, and the present data are not compatible with a prolonged phase of death in many RGCs in which RGC bodies shrink slowly.
Decreases in dendritic structure of RGCs were seen in crush retinas, but not in glaucoma eyes. Weber et al.38 reported that the dendritic fields of RGCs in glaucoma monkeys that were intracellularly labeled with Lucifer yellow were smaller than those in normal eyes, although substantial differences were seen only in severely injured retinas. Backfilling of human postmortem retinas with DiI suggested lower bifurcation frequency in RGC dendrites in glaucoma compared with control retinas.40 These investigators found no change in somal size in glaucoma. In DBA/2J glaucoma mice, Jakobs et al.24 reported fewer dendritic branches and shrinkage of RGC soma. Retrograde labeling of RGCs in experimental rat glaucoma, on the other hand, found an increase in soma diameter and dendritic field.41 It will be important to conduct more studies of this question as technological improvements in methodology occur. If there are significant decreases in the dendritic field of RGCs prior to their death, this could be detected by segmented retinal morphometry using optical coherence tomography as developed by Huang and colleagues.42 If such shrinkage occurs, and if it is at a stage where RGCs are reversibly injured, it could be a finding that greatly facilitates studies of neuroprotective treatments in glaucoma.
Optic nerve crush represents a useful model of acute RGC injury that produces rapid degeneration of axons and significant changes in the RGC morphology that are easily standardized. We note that the axon loss in our specimens was somewhat greater than that seen in some previous reports, and the differences may relate to degree or duration of crushing, or to strain differences in response to experimental models, as we have recently found in experimental glaucoma among mouse strains.32 It is not surprising that nerve crush and experimental glaucoma give different findings. Although both involve injuries to the optic nerve at or near the nerve head, the mechanisms are clearly different, as evidenced by the more rapid and severe RGC effects seen here in crush compared with the glaucoma model. In primate models of glaucoma and optic nerve transection, there is upregulation of specific extracellular matrix components at the site of optic nerve transection, but not in the optic nerve head,43 and gene expression changes in substantially different ways in the retina after transaction compared with glaucoma in the rat.44 Thus, although both optic nerve crush and glaucoma lead to RGC death, the mechanisms of action probably differ in important ways.
The methods by which RGC dendritic and somal changes can be studied are diverse and some differences in findings may derive from technical issues. A primary difference is study of the same RGC in vivo, as performed by Leung et al.15 on nerve crush YFP mice and our laboratory.14 The study of the same RGC over time is a powerful tool that eliminates many variables that exist in cross-sectional studies such as reported here. There are substantial variations in the number and brightness of YFP-expressing RGCs in this mouse strain. Even with concurrent, fellow eye controls, this requires the study of much larger numbers of neurons to derive useful estimates of effects in the histologic approach. However, the use of confocal microscopy on whole-mounted retina provides clear advantages in detail and 3-dimensional reconstruction of dendritic detail over living tissue photographic imaging. More RGCs can be studied, including those in the retinal periphery in the histologic approach. Furthermore, we have documented in retinal explants tissues that repeated imaging of the same cell with laser energy may decrease fluorescence irreversibly (data not shown). This is a possible factor in considering in vivo methods. Finally, the models of glaucoma in mice, both induced and DBA/2J, with which we are familiar, lead to significant enlargement, clouding, and vascularization of the cornea. These effects make repeated in vivo imaging at best difficult and may induce artifacts into the quantification of dendritic structure.
We and others have back-filled RGCs with dyes to study cell structure, but this leads to the inability in many cases to distinguish the processes of one RGC from another. Weber et al.8,21,38 have individually identified RGCs electrically, then filled them with dye for postmortem study in cats and monkeys. This elegant approach has yielded important findings, but is limited by the number of neurons that can be injected per eye and by possible selectivity in which RGCs are more likely to be successfully penetrated.
Our approach has limitations that have to some extent already been described. The variation in the YFP-expressing mouse strain in number and brightness of fluorescent RGCs is an issue that expands the needed sample size for determination of significant results. Moreover, this approach lacks power to discriminate morphologic changes between different subtypes of RGCs. We16 and others22,45–47 showed that different subtypes of RGCs do not have such substantial differences in their morphology as RGCs from primates and humans. Thus, in vivo imaging of the same cell over time would provide more meaningful data. The degree of RGC death in our glaucoma model has been increased with improvement in the method of bead injection over our original report, but still leads to loss of only 30% of RGCs in 6 weeks.17 Since mice have substantial differences in number, distribution, and type of RGCs from those of humans, as well as differences in optic nerve head structure, findings of detailed change in dendritic structure may not be fully applicable to the human disease.
Supplementary Material
Footnotes
Supported in part by Public Health Service/National Eye Institute Research Grants EY-02120 and EY-01765; Academy of Finland, Evald and Hilda Nissi Foundation; Saastamoinen Foundation; by unrestricted gifts from Research to Prevent Blindness; William T. Forrester; Saranne and Livingston Kosberg; and the Leonard Wagner Trust, New York.
Disclosure: G. Kalesnykas, None; E.N. Oglesby, None; D.J. Zack, None; F.E. Cone, None; M.R. Steinhart, None; J. Tian, None; M.E. Pease, None; H.A. Quigley, None
References
- 1. Quigley HA, Nickells RW, Kerrigan LA, Pease ME, Thibault DJ, Zack DJ. Retinal ganglion cell death in experimental glaucoma and after axotomy occurs by apoptosis. Invest Ophthalmol Vis Sci. 1995;36:774–786 [PubMed] [Google Scholar]
- 2. Garcia-Valenzuela E, Shareef S, Walsh J, Sharma SC. Programmed cell death of retinal ganglion cells during experimental glaucoma. Exp Eye Res. 1995;61:33–44 [DOI] [PubMed] [Google Scholar]
- 3. Kerrigan LA, Zack DJ, Quigley HA, Smith SD, Pease ME. TUNEL-positive ganglion cells in human primary open-angle glaucoma. Arch Ophthalmol. 1997;115:1031–1035 [DOI] [PubMed] [Google Scholar]
- 4. Okisaka S, Murakami A, Mizukawa A, Ito J. Apoptosis in retinal ganglion cell decrease in human glaucomatous eyes. Jpn J Ophthalmol. 1997;41:84–88 [DOI] [PubMed] [Google Scholar]
- 5. Quigley HA, Addicks EM, Green WR, Maumenee AE. Optic nerve damage in human glaucoma. II. The site of injury and susceptibility to damage. Arch Ophthalmol. 1981;99:635–649 [DOI] [PubMed] [Google Scholar]
- 6. Ventura LM, Golubev I, Feuer WJ, Porciatti V. Pattern electroretinogram progression in glaucoma suspects. [published online ahead of print November 7, 2011] J Glaucoma. [DOI] [PMC free article] [PubMed] [Google Scholar]
- 7. Johnson MA, Drum BA, Quigley HA, Sanchez RM, Dunkelberger GR. Pattern-evoked potentials and optic nerve fiber loss in monocular laser-induced glaucoma. Invest Ophthalmol Vis Sci. 1989;30:897–907 [PubMed] [Google Scholar]
- 8. Weber AJ, Harman CD. Structure-function relations of parasol cells in the normal and glaucomatous primate retina. Invest Ophthalmol Vis Sci. 2005;46:3197–3207 [DOI] [PMC free article] [PubMed] [Google Scholar]
- 9. Nagaraju M, Saleh M, Porciatti V. IOP-dependent retinal ganglion cell dysfunction in glaucomatous DBA/2J mice. Invest Ophthalmol Vis Sci. 2007;48:4573–4579 [DOI] [PMC free article] [PubMed] [Google Scholar]
- 10. Holcombe DJ, Lengefeld N, Gole GA, Barnett NL. Selective inner retinal dysfunction precedes ganglion cell loss in a mouse glaucoma model. Br J Ophthalmol. 2008;92:683–688 [DOI] [PubMed] [Google Scholar]
- 11. Tauchi M, Masland RH. Local order among the dendrites of an amacrine cell population. J Neurosci. 1985;5:2494–2501 [DOI] [PMC free article] [PubMed] [Google Scholar]
- 12. Gan WB, Grutzendler J, Wong WT, Wong RO, Lichtman JW. Multicolor “DiOlistic” labeling of the nervous system using lipophilic dye combinations. Neuron. 2000;27:219–225 [DOI] [PubMed] [Google Scholar]
- 13. Feng G, Mellor RH, Bernstein M, et al. Imaging neuronal subsets in transgenic mice expressing multiple spectral variants of GFP. Neuron. 2000;28:41–51 [DOI] [PubMed] [Google Scholar]
- 14. Walsh MK, Quigley HA. In vivo time-lapse fluorescence imaging of individual retinal ganglion cells in mice. J Neurosci Methods. 2008;169:214–221 [DOI] [PMC free article] [PubMed] [Google Scholar]
- 15. Leung CK, Lindsey JD, Crowston JG, et al. In vivo imaging of murine retinal ganglion cells. J Neurosci Methods. 2008;168:475–478 [DOI] [PubMed] [Google Scholar]
- 16. Oglesby E, Quigley HA, Zack DJ, et al. Semi-automated, quantitative analysis of retinal ganglion cell morphology in mice selectively expressing yellow fluorescent protein. Exp Eye Res. 2012;96:107–115 [DOI] [PMC free article] [PubMed] [Google Scholar]
- 17. Cone FE, Steinhart MR, Oglesby EN, Kalesnykas G, Pease ME, Quigley HA. The effects of anesthesia, mouse strain and age on intraocular pressure and an improved murine model of experimental glaucoma. Exp Eye Res. 2012;99C:27–35 [DOI] [PMC free article] [PubMed] [Google Scholar]
- 18. Sholl DA. Dendritic organization in the neurons of the visual and motor cortices of the cat. J Anat. 1953;87:387–406 [PMC free article] [PubMed] [Google Scholar]
- 19. Gensel JC, Schonberg DL, Alexander JK, McTigue DM, Popovich PG. Semi-automated sholl analysis for quantifying changes in growth and differentiation of neurons and glia. J Neurosci Methods. 2010;190:71–79 [DOI] [PMC free article] [PubMed] [Google Scholar]
- 20. Quigley HA, Davis EB, Anderson DR. Descending optic nerve degeneration in primates. Invest Ophthalmol Vis Sci. 1977;16:841–849 [PubMed] [Google Scholar]
- 21. Weber AJ, Harman CD. BDNF preserves the dendritic morphology of alpha and beta ganglion cells in the cat retina after optic nerve injury. Invest Ophthalmol Vis Sci. 2008;49:2456–2463 [DOI] [PubMed] [Google Scholar]
- 22. Leung CK, Weinreb RN, Li ZW, et al. Long-term in vivo imaging and measurement of dendritic shrinkage of retinal ganglion cells. Invest Ophthalmol Vis Sci. 2011;52:1539–1547 [DOI] [PubMed] [Google Scholar]
- 23. Morgan JE, Datta AV, Erichsen JT, Albon J, Boulton ME. Retinal ganglion cell remodelling in experimental glaucoma. Adv Exp Med Biol. 2006;572:397–402 [DOI] [PubMed] [Google Scholar]
- 24. Jakobs TC, Libby RT, Ben Y, John SW, Masland RH. Retinal ganglion cell degeneration is topological but not cell type specific in DBA/2J mice. J Cell Biol. 2005;171:313–325 [DOI] [PMC free article] [PubMed] [Google Scholar]
- 25. Asai T, Katsumori N, Mizokami K. Retinal ganglion cell damage in human glaucoma. 2. Studies on damage pattern. Nihon Ganka Gakkai Zasshi. 1987;91:1204–1213 [PubMed] [Google Scholar]
- 26. Quigley HA, Dunkelberger GR, Green WR. Chronic human glaucoma causing selectively greater loss of large optic nerve fibers. Ophthalmology. 1988;95:357–363 [DOI] [PubMed] [Google Scholar]
- 27. Chaturvedi N, Hedley-Whyte ET, Dreyer EB. Lateral geniculate nucleus in glaucoma. Am J Ophthalmol. 1993;116:182–188 [DOI] [PubMed] [Google Scholar]
- 28. Quigley HA, Sanchez RM, Dunkelberger GR, L'Hernault NL, Baginski TA. Chronic glaucoma selectively damages large optic nerve fibers. Invest Ophthalmol Vis Sci. 1987;28:913–920 [PubMed] [Google Scholar]
- 29. Glovinsky Y, Quigley HA, Dunkelberger GR. Retinal ganglion cell loss is size dependent in experimental glaucoma. Invest Ophthalmol Vis Sci. 1991;32:484–491 [PubMed] [Google Scholar]
- 30. Dandona L, Hendrickson A, Quigley HA. Selective effects of experimental glaucoma on axonal transport by retinal ganglion cells to the dorsal lateral geniculate nucleus. Invest Ophthalmol Vis Sci. 1991;32:1593–1599 [PubMed] [Google Scholar]
- 31. Vickers JC, Schumer RA, Podos SM, Wang RF, Riederer BM, Morrison JH. Differential vulnerability of neurochemically identified subpopulations of retinal neurons in a monkey model of glaucoma. Brain Res. 1995;680:23–35 [DOI] [PubMed] [Google Scholar]
- 32. Cone FE, Gelman SE, Son JL, Pease ME, Quigley HA. Differential susceptibility to experimental glaucoma among 3 mouse strains using bead and viscoelastic injection. Exp Eye Res. 2010;91:415–424 [DOI] [PMC free article] [PubMed] [Google Scholar]
- 33. Glovinsky Y, Quigley HA, Pease ME. Foveal ganglion cell loss is size dependent in experimental glaucoma. Invest Ophthalmol Vis Sci. 1993;34:395–400 [PubMed] [Google Scholar]
- 34. Shou TD, Zhou YF. Y cells in the cat retina are more tolerant than X cells to brief elevation of IOP. Invest Ophthalmol Vis Sci. 1989;30:2093–2098 [PubMed] [Google Scholar]
- 35. Takatsuji K, Tohyama M, Sato Y, Nakamura A. Selective loss of retinal ganglion cells in albino avian glaucoma. Invest Ophthalmol Vis Sci. 1988;29:901–909 [PubMed] [Google Scholar]
- 36. Morgan JE, Uchida H, Caprioli J. Retinal ganglion cell death in experimental glaucoma. Br J Ophthalmol. 2000;84:303–310 [DOI] [PMC free article] [PubMed] [Google Scholar]
- 37. Morgan JE. Retinal ganglion cell shrinkage in glaucoma. J Glaucoma. 2002;11:365–370 [DOI] [PubMed] [Google Scholar]
- 38. Weber AJ, Kaufman PL, Hubbard WC. Morphology of single ganglion cells in the glaucomatous primate retina. Invest Ophthalmol Vis Sci. 1998;39:2304–2320 [PubMed] [Google Scholar]
- 39. Kerr JF, Wyllie AH, Currie AR. Apoptosis: a basic biological phenomenon with wide-ranging implications in tissue kinetics. Br J Cancer. 1972;26:239–257 [DOI] [PMC free article] [PubMed] [Google Scholar]
- 40. Pavlidis M, Stupp T, Naskar R, Cengiz C, Thanos S. Retinal ganglion cells resistant to advanced glaucoma: a postmortem study of human retinas with the carbocyanine dye DiI. Invest Ophthalmol Vis Sci. 2003;44:5196–5205 [DOI] [PubMed] [Google Scholar]
- 41. Ahmed FA, Chaudhary P, Sharma SC. Effects of increased intraocular pressure on rat retinal ganglion cells. Int J Dev Neurosci. 2001;19:209–218 [DOI] [PubMed] [Google Scholar]
- 42. Tan O, Li G, Lu AT, Varma R, Huang D. Advanced Imaging for Glaucoma Study Group. Mapping of macular substructures with optical coherence tomography for glaucoma diagnosis. Ophthalmology. 2008;115:949–956 [DOI] [PMC free article] [PubMed] [Google Scholar]
- 43. Agapova OA, Kaufman PL, Lucarelli MJ, Gabelt BT, Hernandez MR. Differential expression of matrix metalloproteinases in monkey eyes with experimental glaucoma or optic nerve transection. Brain Res. 2003;967:132–143 [DOI] [PubMed] [Google Scholar]
- 44. Yang Z, Quigley HA, Pease ME, et al. Changes in gene expression in experimental glaucoma and optic nerve transection: the equilibrium between protective and detrimental mechanisms. Invest Ophthalmol Vis Sci. 2007;48:5539–5548 [DOI] [PubMed] [Google Scholar]
- 45. Sun W, Li N, He S. Large-scale morphological survey of mouse retinal ganglion cells. J Comp Neurol. 2002;451:115–126 [DOI] [PubMed] [Google Scholar]
- 46. Kong JH, Fish DR, Rockhill RL, Masland RH. Diversity of ganglion cells in the mouse retina: unsupervised morphological classification and its limits. J Comp Neurol. 2005;489:293–310 [DOI] [PubMed] [Google Scholar]
- 47. Badea TC, Nathans J. Quantitative analysis of neuronal morphologies in the mouse retina visualized by using a genetically directed reporter. J Comp Neurol. 2004;480:331–351 [DOI] [PubMed] [Google Scholar]
Associated Data
This section collects any data citations, data availability statements, or supplementary materials included in this article.


