

Abstract
We asses the ability of a distance correlation coefficient (DiCC), calculated from distance covariance, for detecting long-range concerted motion in proteins. We establish a set of criteria for ideal correlation coefficient values based on the coefficient of determination in multi-dimension, R2. We compare in detail DiCC and conventional coefficients against these criteria. We demonstrate that in contrast to conventional correlation coefficients, which capture long-distance correlation adequately only with certain restrictions in multi-dimension, DiCC reflects appropriate correlation in both one- and multi-dimension. Finally we demonstrate the usefulness of DiCC for assessing long-distance correlated fluctuation in protein dynamics.
1 Introduction
Concerted, low-frequency motions are inherent to large or multi-domain proteins, and can be essential for proteins to carry out their function; 1 particularly those involving allosteric processes. Large-scale, concerted motion implies correlated fluctuation of different parts of the protein separated by relatively long-distance. Atomistic molecular dynamics (MD) simulation of proteins has the potential for revealing concerted motions in great detail. Nonetheless the assessment of long-range correlated motion from simulations has so far been elusive except for a small number of cases.2 A correlation coefficient (CC) can be defined to quantify correlation between two random variables, including atomic fluctuations in the case of proteins. The most widely used CC between scalar variables is Pearson’s correlation coefficient (PCC). The displacement vector correlation coefficient (VCC) is an extension of PCC to quantify correlation between two positional vectors. Some recent insightful usages of VCC are reported in references. 3–5 VCC depends on the cosine of the angle between the vectors and is most sensitive when the vectors are parallel. 2,6,7 To overcome this shortcoming of VCC, a few studies have used the generalized correlation co-efficient (GCC)7–9 or radial correlation coefficient (RCC) 2 to detect correlation between atomic fluctuations of proteins. In previous work, 2 we exploited the radial symmetry of icosahedral viral capsids and found long-range correlated motions between residues 55 Å apart in human rhinovirus using RCC, which is a PCC on the norm of position vectors. RCC is highly useful when applied to systems with radial symmetry, but is insensitive to azimuthal fluctuation. GCC is an excellent CC between scalar random variables, however in multi-dimensions GCC does not combine the one-dimensional CCs in a suitable way to investigate concerted motions. In this article we asses the ability of a distance correlation coefficient (DiCC), 10,11 calculated from distance covariance, to capture correlation without imposing any assumption on the time series of the vectors. A comparison of DiCC with VCC, RCC and GCC elucidates the merit and weaknesses of each and the potential of DiCC for detecting long-range concerted motion in proteins.
2 Results
2.1 Correlation coefficients
DiCC between two vector series, {A} and {B}, is defined as
| (1) |
where ν(A.B) is the distance covariance between the vectors. Let us assume that the vector series, {A} and {B} have n entries each and the ith entry in {A} is denoted by Ai. If {A} and {B} are position vectors of two atoms from a simulation study then Ai is the ith saved position vector of one atom. Distance covariance is defined as
| (2) |
The following steps are needed to calculate αi j from {A}.
Build the n × n matrix, a, from {A}, where ai j is the distance between the ith and jth entries of {A}: ai j = |Ai − A j|.
Average the rows of a: .
Average the columns of a: .
Average all elements of a: .
Build the n × n matrix α from a where αi j = ai j − ai. − a.j + a...
VCC and GCC between the vector series {A} and {B}, and RCC between {Ar} and {Br}, the norms of A and B respectively, are defined as follows.
| (3) |
where 〈…〉 is the ensemble average or average over all entries in {A} and {B}, I is the mutual information between {A} and {B}, calculated using the method developed by Kraskov, Stogbauer and Grassberger, 12,13 and d is the dimension of vectors A and B.
It should be noted that calculation of VCC and GCC require the dimensions of A and B to be the same, while the calculation of RCC and DiCC does not impose any such restriction.
2.2 Coefficient of determination
If the dependency between two scalar random variables is known, then the coefficient of determination,14 R2, can be considered a measure of correlation between the variables. In the case of a linear dependency R2 is 1 when the variation in one of the variables can be determined exactly by the variation in the other, and R2 is zero when the variation in one cannot be determined at all by the variation in the other. If the dependency is non-linear we can refer to Nagelkerke. 15
R2 between two scalar variables is a scalar quantity. In the case of two vectors of dimension m and n, we can define R2 as a m × n matrix where , the i jth component of the matrix, is the coefficient of determination between the ith component of one vector and the jth component of another vector. An example of such a matrix is given later in the article.
A CC indicates the strength of the relationship between random variables. For a CC to be practical, physically meaningful and robust in the context of atomic fluctuations, it should satisfy the following criteria.
Be a scalar quantity.
Equal 1 when R2 is a unity matrix, and the dependency between the random variables is linear.
Equal 0 when R2 is a null matrix.
If R2 between a pair of vectors is identical to R2 between another pair of vectors, then the CC should be similar in both cases.
Be independent of coordinate system.
While we were developing this assessment based on R2 of coefficients for detecting concerted motions in proteins, a study appeared 16 in which similar criteria were proposed to establish associations between scalar data sets. Reshef et al. showed that for non-linearly dependent random variables, none of the established CCs becomes 1 even when R2 is 1, and the sensitivity of CC calculated with different methods depends on the specific functional form of the dependency. 16 Accordingly for practical purposes we demanded the second criteria stated above be true only for linearly dependent random variables, although we would like it to be true in general.
2.3 Correlation coefficients in multi-dimensions
To compare the performances of different CCs, we calculated the CC between the positions of two particles A and B specified by their two-dimensional position vectors, A and B, as shown in 1.
We can write,
| (4) |
where, î and ĵ are unit vectors in Cartesian coordinate system and r̂ and θ̂ are unit vectors in the spherical coordinate system. The value of the CC obtained from the different parameters are compared to the known coefficient of determination between the components of the vector. If Br can be expressed as a linear function of Ar, f (Ar), then the coefficient of determination, R2(Br.Ar) is14
| (5) |
In the two-dimensional model we define
| (6) |
where Δr and Δθ are constants and δr is a random variable normally distributed, with mean zero and variance .
To build a series {A} we generated 100,000 normally distributed values of Ar with mean value of 10 and variance of . We fixed the value of Aθ to π. 4. We independently generated another 100,000 normally distributed values, with a mean of 0 and variance of , to build {δr}. For a particular value of Δθ we built {B} from 6 with Δr = 3.0. We generated 90 such series of {A} and {B} while varying the value of Δθ from 0 to π. 2. In all 90 series and in Br. Hence . Variances of Bθ and Aθ are zero as their values are fixed. Also, is zero in Bθ. We can still define R2(Bθ.Aθ) in such a case from the limit , R2(Bθ. Aθ) becomes 1 when . Since angular and radial components are independent of each other, R2(Bθ.Ar) and R2(Br.Aθ) are zero. So the expected R2 between r̂ and θ̂ components are
We calculated the DiCC, VCC, and GCC of (B.A) and DiCC, RCC and GCC of (Br.Ar). The values of the correlation coefficients between (B.A) are plotted as a function of Δθ in 2. For reference, the PCC of two linearly dependent random scalars is equal to , the square root of the coefficient of determination between them, which is 0.83 here. DiCC of (Br.Ar) and (B.A), dotted and solid blue lines in 2 respectively, have identical values of 0.81. Uncertainty in determining Br from Ar in one dimension and B from A in multi-dimension appears only due to the random variable δr and the DiCC values in one dimension and multi-dimension correctly reflects that. In 2, RCC of (Br.Ar) (red dotted line) and VCC when Δθ = 0 (green solid line) become exactly . VCC, however, decreases monotonically to 0 as Δθ increases from 0 to π. 2 and changes sign for π. 2 < Δθ < π. In multi-dimensions, VCC between two random vectors is the the VCC value when the vectors are parallel multiplied by the cosine of the angle between them.
RCC is independent of Δθ and reproduces R; however it depends on the position of the origin of the coordinate system as the definition of the radial component of motion depends on the position of the origin. To illustrate this limitation we used the series of {A} and {B} for Δθ = π. 2 and calculated RCC of (Br.Ar) while moving the origin along the x-axis. The inset of 2 shows how RCC changes as a function of the position of the origin on the x-axis of original coordinate frame.
That a GCC-like quantity can be used to define correlation between Gaussian random scalars was first suggested by Joe. 17 For this case GCC of (Br,Ar ) becomes exactly R(Br.Ar) as evident in 2. However in multi-dimension GCC of (B.A) is much higher even though the source of uncertainty in determining Br from Ar is the same in determining B from A. If R2 matrix is diagonal and are it’s diagonal elements then , where d is the dimension of the vectors. The derivation and the physical meaning of the above relation is explained in the Supporting information Note 1. Accordingly GCC of . Irrespective of the value of R2(Br.Ar), GCC of (B.A) is 1 as R2(Bθ.Aθ) = 1. The scheme with which GCC combines one-dimensional PCC values is not suitable to find association between positional fluctuations.
In the model illustrated with 1, ρAxAy and ρBxBy are close to one. In protein dynamics however CCs between the components of a vector are usually much smaller. Distribution of CCs between the components of position vectors calculated from a protein dynamics simulation is given in the Supporting information Note 2 and Supporting information Figure S1. To check the performance of DiCC and GCC as the correlation between the components changes, we generated (B.A) with
while varying the correlation between ρAxAy from 0.0 to 0.99.
DiCC of (B,A), shown in solid blue line in 3, changes very slightly as ρAxAy varies from 0 to 0.99. GCC of (B,A), shown in solid red line in 3, is 0.93 for ρAxAy equal to 0 and approaches DiCC of (B,A) as ρAxAy tends toward 1. For the same R2 matrix in 3 DiCC of (B,A) varies slightly, from 0.63 to 0.52, while GCC by contrast varies greatly from 0.93 to 0.52.
2.4 Long-range correlated fluctuations in protein
We further compared the capability of the various CC parameters using the example of Src SH2 domain in complex with a conformationally constrained mimetic of a phosphotyrosyl tetra-peptide ligand pYEEI,18,19 and show that DiCC detects long-range concerted motions that are underestimated by VCC. VCC and DiCC were calculated between 106 Cα atoms from the cumulative 80,000 conformations. In 4a, VCC and DiCC are plotted against the average i.stance between the Cα pairs. The DiCC values are overall much greater than VCC values. No Cα pairs, with average distances between them greater than 7.5 Å, have a VCC value greater than 0.6. On the other hand, there are more than 40 pairs of Cα pairs, shown as circles in 4a, separated by more than 7.5 Å and have DiCCs greater than 0.6. One Cα pair, shown as a diamond in 4a, with an average distance equal to 24.8 Å has a DiCC value of 0.58.
The GCC values are also much greater than VCC values, and the distribution is less disperse (4b, 5). The GCC value is also greater in general than the DiCC value (4c, 5). The increased value of GCC arises because GCC is dominated by the largest element of R2 calculated in a coordinate system where vector components are independent, as explained earlier and in the Supporting information Note 1. Accordingly GCC, without an effective scheme of combining one-dimensional PCC values, does not characterize correlated behavior in a manner suitable to find association between positional fluctuations. GCC reflects some kind of correlation between random vectors, but it is not clear given the tight distribution in 4b and the variation with respect to non-independent vector components (3), how useful it is to detect long-range concerted fluctuations in protein dynamics.
2.5 Convergence of correlation coefficient values
We investigated convergence behavior of different CCs of five pairs of Cα atoms whose DiCC values fall within 0.9–1.0, 0.8–0.9, 0.7–0.8, 0.6–0.7 & 0.5–0.6 respectively and have the highest intra-pair average distances among all Cα pairs with DiCC in their respective ranges. The five pairs of Cα atoms are from residues 164 & 165, residues 153 & 154, residues 206 & 215, residues 206 & 216 and residues 193 & 203 with average intra-pair distances 3.87 Å, 3.85 Å, 11.13 Å, 11.08 Å & 24.71 Å respectively. We combined n ps form the beginning of the 40 trajectories and calculated VCC, GCC and DiCC and their bootstrap standard deviation of the five Cα pairs from the combined data while varying n from 10 to 2000 with a step of 20. Mean values of CCs calculated from the combine data stabilizes with 40 × 400 ps of data (6). Standard deviations calculated from 400 bootstrap sample change by less than 0.01 for all CCs during last 40 × 1 ns of data (6). Convergence behavior of all CCs are similar and they converge well with 40 × 1 ns of data.
3 Discussion
A correlation coefficient should be able to characterize correlation between displacement vectors due to concerted motion in a protein regardless of the distance of separation. VCC depends on the angle between the position vectors and hence underestimates correlation when vectors are not parallel. While RCC is highly suitable for detecting radial motion in spherically symmetric system, it depends on the position of origin of the coordinates axis and is insensitive to azimuthal correlation. When radial symmetry does not dominate the concerted motion, RCC does not reflect the full correlation between positional vectors.
The CC best matching the criteria outlined above is DiCC calculated from distance covariance. DiCC was found here to capture the true correlation between positional vectors based on agreement with R2, is insensitive to the angle between the displacement vectors and has limited sensitivity to the dependence between the vector components. Further DiCC reflects both linear and non-linear correlation.16 Using DiCC we observe long-distance concerted motions in a protein that was not revealed by VCC. Detection of such collective motion, which has mostly been elusive in analyses of molecular dynamics simulation, can be insightful for understanding allosteric function and other long-distance effects in proteins.
4 Methods
4.1 Generating correlated Gaussian
We determine {B} and {A} with a specified covariance matrix C between Ax, Ay, Bx by defining
| (7) |
where v1, v2 and v3 are three independent Gaussian random variables with variance one and W† is the transpose of W. The actual R2(Ax.Bx) and R2(Ay.Bx) calculated from the generated {B} and {A} were 0.48 to 0.50.
4.2 Molecular dynamics of Src SH2
In the simulation system the natural phosphotyrosine (pY) residue was replaced by one with the main-chain amide nitrogen, Cα and Cβ substituted by a cyclopropane moiety which effectively constrains the side-chain conformation of the residue to that of the protein-bound state. 18,19 The details of the MD simulations of the Src SH2 complex have been reported previously. 19 Briefly, five sets of initial coordinates for the complex in explicit water were obtained from the multiple copies of the complex in the crystallographic asymmetric unit (PDB identifier 1IS0 and 1SPS). Eight simulations were initiated from each conformation by varying the initial velocities, yielding a total of 40 independent simulations. Each simulation was equilibrated for 500 ps and extended for 2 ns of production MD under constant temperature (298 K) and pressure (1 atm). Coordinates were saved at 1 ps interval from the production period.
Supplementary Material
Figure 1.

A and B are two particles with their position vectors A and B respectively. Br = Ar + Δr + δr and Bθ = Aθ + Δθ where Δr and Δθ are two constants and δr is a normally distributed noise with mean zero and variance .
Figure 2.

Red dotted line represents GCC and RCC of (Br.Ar ). As both the values are very close to each other only one line is drawn for clarity. Blue solid and dotted lines represent DiCC of (B.A) and (Br.Ar). Dotted blue line is hardly visible as it overlaps with the solid blue line. Solid red and green lines represent GCC and VCC of (B.A) respectively. VCC of (B.A) depends on Δθ, the angle between B and A. The inset shows how the RCC of (Br.Ar), when angle between (B and A) is π. 2, changes as the origin of the coordinate axis moves along x-axis. As the origin changes the radial component of the vectors decreases, as does RCC.
Figure 3.

Two random variables A and B are generated with R2(Ax.Bx)=0.49, R2(Ay.Bx)=0.49 and R2(Ax.By)=0 and R2(Ay.By)=0 while varying ρAxAy from 0 to 0.99. Solid blue and red line represents DiCC and GCC of (B,A) respectively. DiCC of (B,A) changes very slightly as ρAxAy varies from 0 to 0.99. GCC of (B,A) is 0.93 when ρAxAy is equal to 0 and approaches DiCC of (B,A) as ρAxAy tends toward 1.
Figure 4.

(a) VCC (blue dots) and DiCC (red dots) between Cα atoms of from 40×2 ns long trajectory of Src SH2 domain in complex with the ligand pYEEI (see text for details) plotted against average distance between the Cα atoms. Distance correlation reveals more than 40 pairs of Cα atoms with average distances between them > 7.5 Å and DiCC > 0.6 (circles). One pair of Cα atoms, showed in diamond, has an average distance of 24.78 Å and DiCC of 0.58. DiCC reveals long distance correlations which are underestimated by VCC. (b) VCC (blue dots) and GCC (orange dots) of Cα atoms plotted against average distances between the Cα atoms. GCC does not reflect correlation suitable to investigate concerted fluctuation of positional vectors of Cα atoms. (c) DiCC and GCC of Cα atoms. Comparison between VCC & DiCC and VCC & GCC are given in Supporting information Figure S2.
Figure 5.
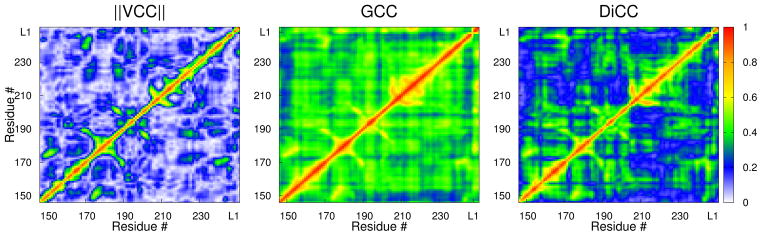
||VCC|| (left), GCC (middle) and DiCC (right) between Cα atoms of Src SH2 domains complexed with ligand pYEEI. Last four residues, starting from L1, are from ligands.
Figure 6.

Correlation coefficient of the position vectors of five pairs of Cα atoms were calculated using 10 to 2000 ps long trajectory from each of the 40 molecular dynamics simulation of Src SH2 domain. Five pairs of Cα atoms are from residues 164 & 165 (red), residues 153 & 154 (orange), residues 206 & 215 (yellow), residues 206 & 216 (green) and residues 193 & 203 (blue). Standard deviation of correlation coefficients were calculated from 400 bootstrap samples. Panel a and d show absolute mean value and standard deviation of VCC of five Cα pairs respectively as a function of time. Panel b and e show mean value and standard deviation of GCC of the same pairs respectively. Panel c and f show mean value and standard deviation of DiCC of the same pairs respectively.
Acknowledgments
We thank the Rosen Center for Advanced Computing at Purdue University for providing computing resources. We thank Dr. Joshua M. Ward for allowing us to analyze Src SH2 complex trajectories from MD simulation. We also thank Jyotishka Dutta for his insightful discussion about R2. This work was supported by National Institutes of Health Grant AI039639.
Footnotes
Supporting Information Available
A detailed discussion of relation between generalized correlation coefficient and canonical correlation coefficient, correlation between components of position vectors calculated form MD simulation of Src SH2, and comparison of VCC & DiCC, VCC & GCC of pairs of Cα atoms calculated from the MD simulations are given in Supporting information. This material is available free of charge via the Internet at http://pubs.acs.org/.
References
- 1.Berendsen HJC, Hayward S. Collective protein dynamics in relation to function. Curr Opin Struct Biol. 2000;10:165–169. doi: 10.1016/s0959-440x(00)00061-0. [DOI] [PubMed] [Google Scholar]
- 2.Roy A, Post CB. Long-distance correlations of rhinovirus capsid dynamics contribute to uncoating and antiviral activity. Proc Natl Acad Sci US A. 2012;109:5271–5276. doi: 10.1073/pnas.1119174109. [DOI] [PMC free article] [PubMed] [Google Scholar]
- 3.Wereszczynski J, McCammon JA. Simulations of the p97 complex suggest novel conformational states of hydrolysis intermediates. Prot Sci. 2012;109:475–486. doi: 10.1002/pro.2024. [DOI] [PMC free article] [PubMed] [Google Scholar]
- 4.Tan YS, Fuentes G, Verma C. A comparison of the dynamics of pantothenate synthetase from M. tuberculosis and E. coli: Computational studies. Proteins. 2011;79:1715–1727. doi: 10.1002/prot.22994. [DOI] [PubMed] [Google Scholar]
- 5.Mishra S, Caflisch A. Dynamics in the active site of β -secretase: A network analysis of atomistic simulations. Biochemistry. 2011;50:9328–9339. doi: 10.1021/bi2011948. [DOI] [PubMed] [Google Scholar]
- 6.Ichiye T, Karplus M. Collective motions in proteins: a covariance analysis of atomic fluctuations in molecular dynamics and normal mode simulations. Proteins. 1991;11:205–217. doi: 10.1002/prot.340110305. [DOI] [PubMed] [Google Scholar]
- 7.Lange FO, Grubmüller H. Generalized Correlation for Biomolecular Dynamics. Proteins. 2006;62:1053–1061. doi: 10.1002/prot.20784. [DOI] [PubMed] [Google Scholar]
- 8.Olbrich C, Strümpfer J, Schulten K, Kleinekathöfer U. Quest for spatially correlated fluctuations in the FMO light-harvesting complex. J Phys Chem B. 2011;115:758–764. doi: 10.1021/jp1099514. [DOI] [PMC free article] [PubMed] [Google Scholar]
- 9.Kamberaj H, van der Vaart A. Correlated Motions and Interactions at the Onset of the DNA-Induced Partial Unfolding of Ets-1. Biophys J. 2009;97:1747–1755. doi: 10.1016/j.bpj.2008.11.019. [DOI] [PMC free article] [PubMed] [Google Scholar]
- 10.Székely GJ, Rizzo ML, Bakirov NK. Measuring and testing dependence by correlation of distances. Ann Stat. 2007;35:2769–2794. [Google Scholar]
- 11.Székely GJ, Rizzo ML. Brownian distance covariance. Ann Appl Stat. 2009;4:1236–1265. doi: 10.1214/09-AOAS312. [DOI] [PMC free article] [PubMed] [Google Scholar]
- 12.Kraskov A, Stogbauer H, Grassberger P. Estimating mutual information. Phys Rev E. 2004;69:066138. doi: 10.1103/PhysRevE.69.066138. [DOI] [PubMed] [Google Scholar]
- 13. [accessed Jun 13th, 2012];MIxnyn. http://www.klab.caltech.edu/kraskov/MILCA/
- 14.Rao CR. Linear statistical inference and its application. Wiley & Sons; New York: 1965. p. 220. [Google Scholar]
- 15.Nagelkerke NJD. A note on a general definition of the coefficient of determination. Biometrika. 1991;78:691–692. [Google Scholar]
- 16.Reshef DN, Reshef YA, Finucane HK, Grossman SR, McVean G, Turnbaugh PJ, Lander ES, Mitzenmacher M, Sabeti PC. Detecting novel associations in large data sets. Science. 2011;334:1518–1524. doi: 10.1126/science.1205438. [DOI] [PMC free article] [PubMed] [Google Scholar]
- 17.Joe H. Relative entropy measures of multivariate dependence. J Amer Stat Assoc. 1989;84:157–164. [Google Scholar]
- 18.Davidson JP, Lubman O, Rose T, Waksman G, Martin SF. Calorimetric and structural studies of 1, 2, 3-trisubstituted cyclopropanes as conformationally constrained peptide inhibitors of Src SH2 domain binding. J Am Chem Soc. 2002;124:205–215. doi: 10.1021/ja011746f. [DOI] [PubMed] [Google Scholar]
- 19.Ward JM, Gorenstein NM, Tian J, Martin SF, Post CB. Constraining Binding Hot Spots: NMR and Molecular Dynamics Simulations Provide a Structural Explanation for Enthalpy -Entropy Compensation in SH2 - Ligand Binding. J Am Chem Soc. 2010;132:11058–11070. doi: 10.1021/ja910535j. [DOI] [PMC free article] [PubMed] [Google Scholar]
Associated Data
This section collects any data citations, data availability statements, or supplementary materials included in this article.