

Abstract
While the essential neural circuitry for delay eyeblink conditioning has been largely identified, much of the neural circuitry for trace conditioning has yet to be determined. The major difference between delay and trace conditioning is a time gap between the presentation of the conditioned stimulus (CS) and the unconditioned stimulus (US) during trace conditioning. It is this time gap, which accounts for the additional memory component and may require extra neural structures, including hippocampus and prefrontal cortex. A metabolic marker of energy use, radioactively labeled glucose analog, was used to compare differences in glucose analog uptake between delay, trace, and unpaired experimental groups (rats, Long-Evans), to identify possible new areas of involvement within forebrain and midbrain. Here, we identify increased 2-DG uptake for the delay group compared to the unpaired group in various areas including: the medial geniculate nuclei (MGN), the amygdala, cingulate cortex, auditory cortex, medial dorsal thalamus, and frontal cortices. For the trace group, compared to the unpaired group, there was an increase in 2-DG uptake for the medial orbital frontal cortex and the medial MGN. The trace group also exhibited more increases lateralized to the right hemisphere, opposite to the side of US delivery, in various areas including: CA1, subiculum, presubiculum, perirhinal cortex, ventral and dorsal MGN, and the basolateral and central amygdala. While some of these areas have been identified as important for delay or trace conditioning, some new structures have been identified such as the orbital frontal cortex for both delay and trace groups.
Keywords: hippocampus, 2-deoxyglucose, frontal cortex, MGN, auditory cortex, thalamus
The delay eyeblink conditioning paradigm and its underlying neural circuitry have been studied extensively (Christian & Thompson, 2003; Thompson, 2005); whereas the neural circuitry for the trace eyeblink conditioning paradigm is less complete. During delay eyeblink conditioning, a conditioned stimulus (CS; e.g., 2kHz tone) is paired with an unconditioned stimulus (US; e.g., periorbital shock), and the US elicits an unconditioned response (UR), which is eyelid closure. After several pairings of the tone and shock, the CS elicits a conditioned response (CR), where the eyelid closure occurs before the onset of the US.
For trace conditioning there is a time gap between the end of the CS and the beginning of the US, whereas no time gap exists between the CS and US in delay conditioning. This time gap or memory requirement during trace conditioning between the offset of the CS and the onset of the US is the primary difference between delay and trace conditioning paradigms. Here, we used metabolic mapping to examine forebrain and midbrain activity during delay and trace eyeblink conditioning. Results from the cerebellum were reported previously (Plakke, Freeman, & Poremba, 2007).
While the essential circuitry for delay eyeblink conditioning is mostly established and centered within the cerebellum and brainstem nuclei (for review see Christian & Thompson, 2003; Thompson, 2005), components of the auditory CS pathway have recently been added to the circuit including the medial geniculate nucleus and inferior colliculus (Freeman, Halverson, & Hubbard, 2007; Halverson & Freeman, 2006; Halverson, Poremba, & Freeman, 2008). In addition, other areas within the forebrain demonstrate modulation or illustrate parallel neurophysiological activity during delay conditioning including the hippocampus and amygdala (Blankenship, Huckfeldt, Steinmetz, & Steinmetz, 2005; Berger, Alger, & Thompson, 1976; Green & Arenos, 2007; Lee & Kim, 2004). While not crucial for simple delay conditioning, brain areas such as the hippocampus may play a role in more complex tasks such as during long delay conditioning (Beylin, Gandhi, Wood, Talk, Matzel, & Shors, 2001).
In trace conditioning, other structures may be necessary such as the hippocampus, medial prefrontal cortex, and anterior cingulate cortex (Kim, Clark, & Thompson, 1995; Kronforst-Collins & Disterhoft, 1998; McLaughlin, Skaggs, Churchwell, & Powell, 2002; Moyer, Deyo, & Disterhoft, 1990; Solomon, Vander Schaaf, Thompson, & Weisz, 1986; Takehara, Kawahara, & Kirino, 2003; Weible, McEchron, Disterhoft, 2000; Weiss, Bouwmeester, Power, & Disterhoft, 1999). It is possible these other forebrain regions are needed due to the memory component that is embedded within trace conditioning, which is not inherent in delay conditioning. This memory trace may add another level of difficulty to the behavioral task and require additional processing by other neural structures (McLaughlin, Skaggs, Churchwell, & Powell, 2002).
Here, we used metabolic mapping to compare neural circuitry for delay and trace eyeblink conditioning. A marker of metabolic activity [C14] 2-deoxyglucose (2-DG), was used to compare glucose analog uptake across delay, trace, and unpaired groups of male rats. This glucose analog, is transported into cerebral tissue, including neurons and glial cells, and phosphorylated by hexokinase but, unlike glucose, is trapped within the cells (Sokoloff, Reivich, Kennedy, Des Rosiers, Patlak, Pettigrew, Sakurada, & Shinohara, 1977). Limitations of this method include not being able to distinguish between excitatory and inhibitory processes as both are energy consuming, and it does not allow differentiation between direct and indirect effects of a given stimulus. However, an entire pathway may be activated and this is an advantage when the goal is to identify the neural circuitry that mediates a specific behavioral response or in this experiment where direct comparisons are made in many brain regions between different types of behavioral training. In this experiment, the primary experimental parameter that differs between the delay and trace groups is whether or not there is a time gap between the offset of the CS and onset of the US. These groups are compared to an unpaired group given explicitly unpaired CS and US stimulus presentations. By using a metabolic marker throughout the forebrain and midbrain we may identify new areas of involvement for both delay and trace conditioning.
Methods
Subjects
Twenty male Long Evans rats weighing 200-250 g were used for this study. All rats were housed in Spence Laboratories at the University of Iowa and kept on a 12-hr light/dark cycle. The rats were fed standard rat chow ad libitum. All procedures were approved by the Institutional Animal Care and Use Committee at the University of Iowa. The rats were divided into three conditioning groups: delay, trace, and unpaired.
Surgery
For surgery, each rat was anesthetized and fitted with differential EMG (electromyogram) electrodes implanted in the left upper eyelid muscle (orbicularis oculi). A ground electrode was attached to a stainless steel skull screw. The EMG electrode leads terminated in gold pins held in a plastic connector, which was secured to the skull with dental acrylic. A bipolar stimulating electrode (for delivering the shock US) was implanted subdermally, immediately caudal to the left eye. The bipolar electrode terminated in a plastic connector that was secured to the skull with dental acrylic. Both sets of connectors for the EMG and bipolar electrode were connected to a lightweight cable that allowed the rats to move freely during conditioning. The rats were allowed to recover for 7-10 days before training began.
Conditioning Apparatus
Rats from each group were trained in one of four sound attenuating chambers (BRS/LVE, Laurel, MD). These small animal sound attenuating chambers surrounded a small-animal operant chamber where the rats were kept during conditioning (BRS/LVE, Laurel, MD). One wall of the operant chamber was fitted with two speakers. The back wall of the sound attenuating chamber was equipped with a small house light and exhaust fan. The electrode leads from the rat's headstage were connected to peripheral equipment and a desktop computer. Computer software controlled the delivery of stimuli and the recording of eyelid EMG activity (JSA Designs, Raleigh, NC). The shock stimulus (1-2 mA, DC constant current) was delivered through a stimulus isolator (Model number 365A, World Precision Instruments, Sarasota FL). EMG activity was recorded differentially, filtered (500-5000 Hz), amplified (2000×), and integrated by equipment (JSA Designs, Raleigh, NC) described in other reports (Halverson & Freeman, 2006).
Behavioral Paradigm
Training Groups
Rats were given delay, trace, or unpaired conditioning. The conditioned stimulus (CS) was a tone (2kHz, 85dB, 250 ms) paired with a unilateral, left side, periorbital shock unconditioned stimulus (US, 25 ms). For the delay group (n=7), the CS terminated with the onset of the US, yielding an interstimulus interval (ISI) of 250 ms. For the trace group (n=6), the CS offset was separated by 250 ms from the US onset, resulting in a 500 ms ISI. For both groups given paired conditioning there was a variable intertrial interval with an average length of 30 s. The unpaired group (n=7) received the CS and US in an explicitly unpaired fashion so that the CS and US never overlapped in a predictive manner, and the variable intertrial interval had a length of 15 s equating the total length of each unpaired training session to the training sessions for the delay and trace groups.
Training Procedure
For delay and trace conditions, training consisted of 10 blocks of 10 trials for a total of 100 trials per session per day. Each block consisted of 9 pairings of the CS and US and one CS alone presented as the 10th test trial in each block. CRs for all groups were defined as responses that crossed a threshold of 0.4 V above baseline during the CS period after 80 ms.
Rats in all groups were trained for 4 days. Before training each day, the rats were habituated to a small containment box, where the tail was restrained. This procedure readied the rats for the injection that occurred on the last day. On the 5th and final day, rats were weighed and then given an i.v. tail injection of (20 μCi/100 g) body weight, glucose analog, 2-deoxyglucose (2-DG) radiolabeled with 14C (American Radiolabeled Chemicals, St. Louis) in 0.3 ml sterile (0.9%) saline (Breier, Crane, Kennedy, & Sokoloff, 1993). Experimental rats were then run in their final training session. The computer program was altered to allow the final session to run continuously for 2 hours (rather than the typical 1 hr session) so that each rat could be run separately. The rats were only allowed to experience 80 trials, or about 40 minutes of training compared to their normal 100 daily training trials to optimize uptake of the 2-DG, which remained trapped in the cells, for the 45 minutes post injection period after which the rats were decapitated. The brains were extracted in less than 6 minutes and frozen in hexane cooled to −37°C and then stored at −80°C until sectioned.
Histology
Before sectioning, brains were removed from the freezer and allowed to equilibrate for 10 minutes. The brain was cut just anterior to the cerebellum so that the cerebellum could be sliced horizontally. Results from the cerebellum were previously reported (Plakke et al., 2007). The tissue anterior to the cerebellum was sectioned in the coronal plane at 40μ in a series of seven with four sections saved for 2-DG analyses, one saved for Nissl staining and two saved for other staining. Tissue mounted for 2-DG was exposed to 14C phosphor screen films along with 14C standards (Amersham, St. Louis) for 36 hours. These screens were read and digitized by a phosphor imaging system, Cyclone Storage Phosphor System (Perkin Elmer, Chicago). Individual calibration curves were calculated based on the absolute gray levels of the 14C standards from each film. Subsequent densitometric measures were then automatically converted to units of nCi/g.
Analyses
Each animal's mean activity values were normalized by a ratio of grey to white matter within subject by readings taken from both cerebellar and forebrain white matter including the optic chiasm, corpus callosum, external capsule, optic tract, and white matter areas of the cerebellum. All areas were defined by using an atlas (Paxinos & Watson, 1998). For brain structure, a region of interest (ROI) reading was taken outlining the complete structure form, from at least three out of four consecutive sections (series), which were then averaged for the whole structure (Barrett, Shumake, Jones, & Gonzalez-Lima, 2003). These values were then averaged for each section, by series, and whole structure. Some of the tissue was damaged or of poor quality (e.g., freezing artifact, missing tissue, folds, tears, and air bubbles), this led to 5 rats being discarded, leaving 5 subjects in each group.
The CR performance of the animals was analyzed with a repeated measures ANOVA, the between factor was group and the within factor was training sessions. All statistical analyses for the 2-DG tissue were done using a mixed effect two way ANOVA with left versus right hemisphere serving as the repeated measures variable and group serving as the between variable. A separate ANOVA was used for each brain ROI. Rather than completing one imaging study for each brain area (like a recording or lesion study) it allows multiple brain regions of interest to be surveyed at the same time without being overly conservative. The p-value was initially set at p= 0.05 and planned comparisons using the Least Significant Difference test (LSD) were performed. The Bonferroni procedure was used with Keppel's modification, to correct for “family-wise” error rate between group comparisons (Keppel, 1982). For each area, the three groups were entered as the treatment, the number of degrees of freedom for the treatment source of variance (3-1=2) was multiplied by the standard critical probability level (0.05), and the product was divided by the number of t test comparisons which yielded the corrected critical probability level of 0.033. Planned comparisons of within effects used a critical probability level of 0.05, as there was only one comparison between left and right hemispheres within group. For any planned comparisons with p-values between the corrected p-value of 0.033 and 0.10 a secondary ANOVA (with p-value =0.05) was run to compare only two groups at a time, e.g. unpaired versus delay groups or only unpaired versus trace groups as results indicated by trends towards significance may have been obscured in analyses that included all three groups.
Results
Behavioral Results
The behavioral data from these animals was previously published (Plakke et al, 2007). The delay and trace animals performed significantly better than the unpaired animals (p< 0.05, 0.05; Figure 1).
Figure 1.
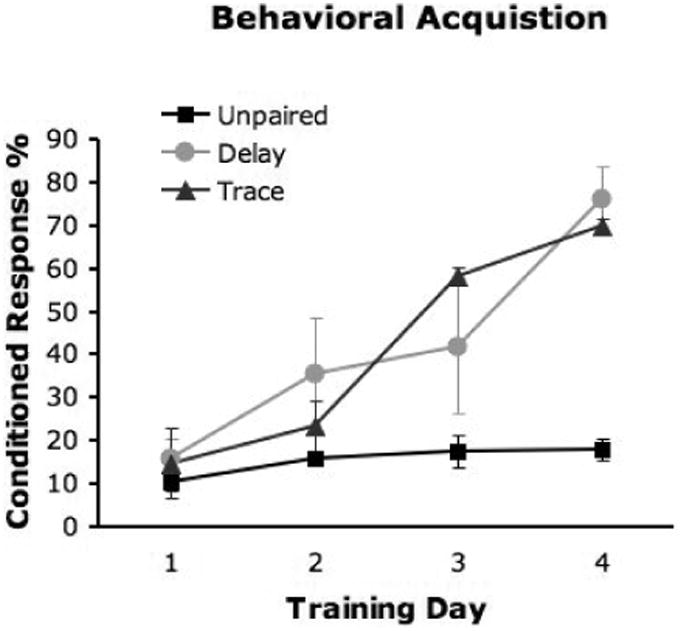
Behavioral performance during acquisition. The percentage of CRs is plotted for the three experimental groups for the first four training sessions. Both the delay and trace groups performed significantly above chance (p < 0.05).
2-DG Results
For a summary of 2-DG findings for all of the measures ROIs see Tables 1 and 2.
Table 1.
This table provides a summary of group differences. An asterisk indicates it is a finding from a secondary ANOVA.
| Brain Area: | Increased Uptake vs. Unpaired Group |
|---|---|
| Frontal Ctx | |
| Frontal Association Ctx | Delay |
| Prelimbic Ctx | Delay* |
| Infralimbic Ctx | None |
| Lateral Orbital Ctx | Delay* |
| Ventral Orbital Ctx | Delay* |
| Medial Orbital Ctx | Delay |
| Med Orbital anterior | Delay |
| Med Orbital posterior | Delay, Trace |
| Cingulate Cortex | |
| ACC | Delay* |
| RSA (PCC) | None |
| RSGa (PCC) | Delay* |
| RSGb (PCC) | Delay* |
| Amygdala | |
| Basolateral | None |
| Medial | None |
| Central | Delay |
| Dorsal Hippocampus | |
| (DG w, a, p; CA1 w, a, p; CA3 w, a, p; | None |
| Sub; Post Sub) | None |
| Ventral Hippocampus | |
| (DG w, a, p; CA1 w, a, p; CA3 w, a, p; | None |
| CA2, Sub; Parasub; Presub w, a) | None |
| Presub posterior half | Delay* |
| Auditory Areas | |
| Area 1 Primary Auditory Ctx | None |
| Area 1 anterior half | Delay* |
| Area 1 posterior half | None |
| Dorsal Auditory Ctx | None |
| Ventral Auditory Ctx | None |
| Inferior colliculus | None |
| MGN (whole) | Delay |
| Dorsal MGN | Delay |
| Medial MGN | Delay, Trace |
| Ventral MGN | Delay* |
| Suprageniculate | Delay |
| PIN | Delay |
| Thalamus and Habenula | |
| (AV; AD; MD w, a; Habenula) | None |
| MD posterior half | Delay* |
| Posterior Cortex Areas | |
| (d Peri; v Peri; lat Ent w, a, p; med Ent | None |
| Somatosensory Ctx | |
| S1 | None |
| BF | Delay* |
| S2 | None |
| Caudate/Putamen | |
| (Caudate w, a, p; lat Caud w, a, p; med Caud w, a, p) | None |
| None |
Abbreviations: a= anterior half; p= posterior half; w= whole; d=dorsal; v= ventral; Lat= lateral; Med= medial; Peri= Perirhinal; Ent= Entorhinal; DG= dentate gyrus; Sub= subiculum; Parasub= Parasubiculum; Presub= Presubiculum; AV= anteroventral; AD= anterodorsal; MD=mediodorsal.
Table 2.
This table provides a summary of lateralized differences within group. An asterisk indicates it is a finding from a secondary ANOVA.
| Brain Area: | Group | Lateralized Hemisphere |
|---|---|---|
| Frontal Ctx | ||
| Frontal Association Ctx | None | |
| Prelimbic Ctx | None | |
| Infralimbic Ctx | Delay | Left |
| (Lateral , Ventral, Medial, Medial a,p Orbital Ctx) | None | |
| Cingulate Cortex | ||
| ACC | None | |
| RSA (PCC) | None | |
| RSGa (PCC) | None | |
| RSGb (PCC) | None | |
| Amygdala | ||
| Basolateral | Delay, Trace | Right |
| Medial | Delay, Trace | Right |
| Central | Delay | Right |
| Dorsal Hippocampus | ||
| (DG w, a, p; CA1 w, p; CA3 w, a, p; Sub) | None | |
| CA1 anterior half | Trace | Right |
| Post Subiculum | Unpaired | Left |
| Ventral Hippocampus | ||
| (DG w, a, p; CA2; Parasub; Presub w, p) | None | |
| CA1 | Delay, Trace | Left |
| CA3 | Delay | Left |
| Subiculum | Trace | Left |
| Presub anterior half | Trace | Left |
| Auditory Areas | ||
| Area 1 Primary Auditory Ctx | None | |
| Area 1 anterior half | None | |
| Area 1 posterior half | None | |
| (Dorsal, Ventral Auditory Ctx, Inferior Colliculus) | None | |
| MGN (whole) | Trace | Right |
| Dorsal MGN | Trace | Right |
| Medial MGN | None | |
| Ventral MGN | Trace | Right |
| Suprageniculate f | Unpaired, Delay, Trace | Right |
| PIN | Trace | Right |
| Thalamus and Habenula | ||
| (AV; AD; MD w, a, p; Habenula) | None | |
| Posterior Cortex Areas | ||
| Dorsal Perirhinal | Delay, Trace* | Right |
| (v Peri; Lat Ent w, a, p; Med Ent) | None | |
| Somatosensory Ctx | ||
| (S1, BF) | None | |
| S2 | Delay | Right |
| Caudate/Putamen | ||
| (Caudate w, a, p; Lat Caud w, a, p; | None | |
| Med Caud w, a, p) | None |
Abbreviations: a= anterior half; p= posterior half; w= whole; d=dorsal; v= ventral; Lat= lateral; Med= medial; Peri= Perirhinal; Ent= Entorhinal; DG= dentate gyrus; Sub= subiculum; Parasub= Parasubiculum; Presub= Presubiculum; AV= anteroventral; AD= anterodorsal; MD=mediodorsal.
Delay Group Differences
The delay group had increased uptake compared to the unpaired group in several regions. For the medial orbital cortex there was a significant effect of group (F2,12 = 5.09, p= 0.025). A planned comparison indicated that the delay group had more 2-DG uptake compared to the unpaired group, Figures 2 and 3. Analyses of values collected from the medial orbital cortex included subdividing it into anterior and posterior portions. The anterior medial orbital cortex did not have significant group effects but the planned comparisons showed the delay group had significantly more 2-DG uptake than the unpaired group. For the posterior medial orbital cortex there was a significant group effect (F2,12 =6.23, p= 0.014) and the delay group had significantly more 2-DG uptake than the unpaired group.
Figure 2.
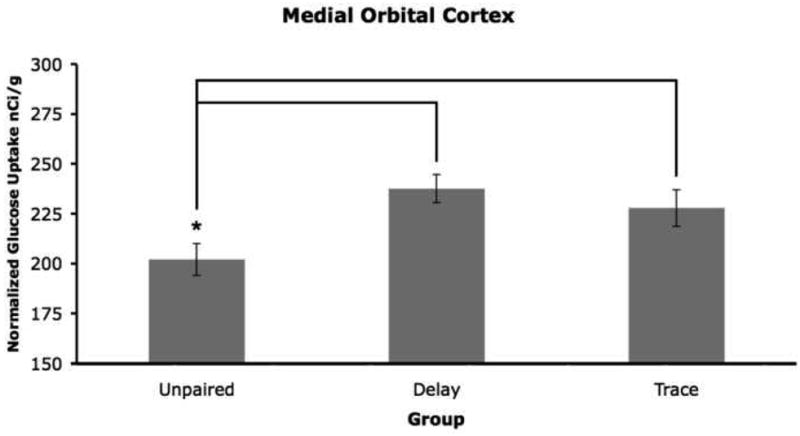
Mean 2-DG uptake in the medial orbital cortex. The delay and trace groups had significantly more 2-DG uptake compared to the unpaired group (p < 0.05; 0.05).
Figure 3.

2-DG autoradiographs of the medial orbital cortex (MO), from three rats, showing relative rates of glucose utilization in pseudocolor (see color scale bar). The left hemisphere is on the left. The coronal sections are approximately 4.70 mm from Bregma (Paxinos & Watson, 1998). Panel A is an unpaired animal, panel B is a delay animal, and panel C is a trace animal. Original autoradiographs are shown as an example of differences in the MO 2-DG uptake but individual autoradiographs may show variations in optical density of other structure.
Planned comparisons for unpaired vs. delay groups from the original three group ANOVA approached significance in several cortical regions. Secondary ANOVAs using only two groups, unpaired vs. delay, revealed that each of the following cortical regions had significantly more 2-DG uptake in the delay group compared to the unpaired group [prelimbic (F1,8 =8.938, p= 0.017); lateral orbital (F1,8=8.041, p= 0.022); ventral orbital ((F1,8=8.855, p= 0.018), anterior cingulate (F1,8 =6.764, p= 0.032), retrosplenial agranular a cortex (RSGa) (F1,8 =5.404, p= 0.049), retrosplenial granular b cortex (RSGb) (F1,8 =5.757, p= 0.043), and primary auditory (area 1), (F1,8 =5.495, p= 0.047)].
For the central nucleus of the amygdala there was no group effect, but the planned comparison showed that the delay group had increased 2-DG uptake compared to the unpaired group.
For the medial MGN there was a significant group effect (F2,12 =5.32, p= 0.022) and the delay group had more 2-DG uptake than the unpaired group, Figures 5 and 6. For the whole medial geniculate nucleus (MGN), dorsal MGN, and suprageniculate (SG) nucleus, there were no significant group effects but the planned comparisons showed that the delay group had more uptake than the unpaired group (whole MGN p= 0.023; dorsal MGN p= 0.028; SG p=0.023). For the ventral MGN there was no significant group effect but the planned comparison was close to significance (p= 0.041) and a secondary ANOVA comparing only the unpaired and delay groups had a significant group effect F1,8 =7.777, p= 0.024). The posterior intralaminar nucleus (PIN) had a significant interaction effect (F2,12 =4.83, p= 0.029) where the delay group had more 2-DG uptake compared to the unpaired group.
Figure 5.
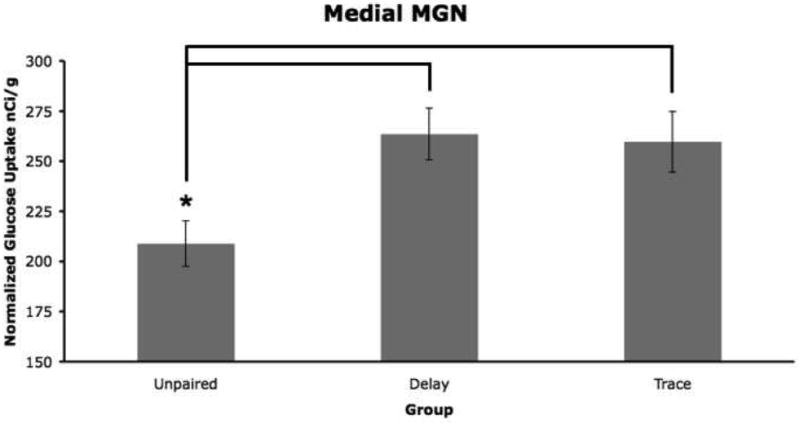
Mean 2-DG uptake in the medial MGN (medial geniculate nucleus). The delay and trace groups had significantly more 2-DG uptake compared to the unpaired group (p < 0.05; 0.05).
Figure 6.
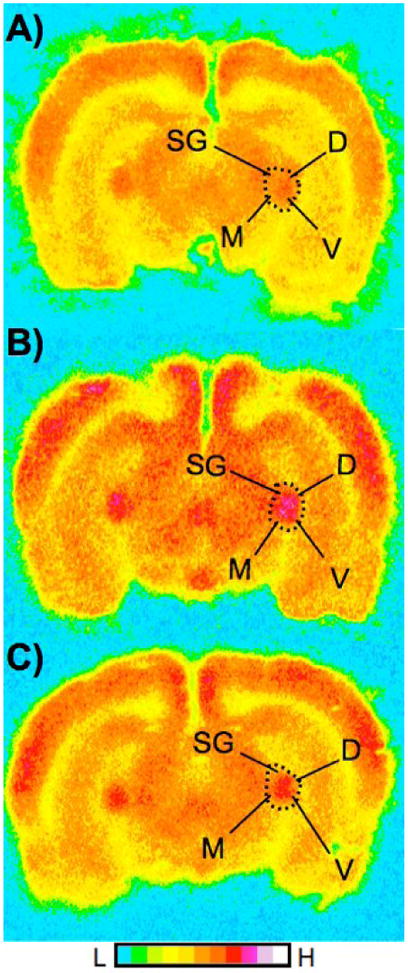
2-DG autoradiographs of the MGN, from three rats, showing relative rates of glucose utilization in pseudocolor (see color scale bar). The left hemisphere is on the left. These coronal sections are approximately −5.60 mm from Bregma (Paxinos & Watson, 1998). Panel A is an unpaired animal, panel B is a delay animal, and panel C is a trace animal. Original autoradiographs are shown as an example of differences in the MGN 2-DG uptake but individual autoradiographs may show variations in optical density of other structures. Abbreviations: SG=suprageniculate; M= medial, D=dorsal, V=ventral, respective areas of MGN.
For the posterior medial dorsal nuclei (MD) of the thalamus, somatosensory barrel fields (BF), and the posterior half of the presubiculum (Presub) (N=4 for the unpaired group due to tissue damage), there was no significant group effect but planned comparisons for unpaired vs. delay groups approached significance. When only the unpaired and delay groups were compared for each of these areas there were main effects (MD: F1,8 =6.912, p= 0.030; BF: F1,8 =5.82, p= 0.047; Presub: F1,8 =11.022, p= 0.013) with the delay group having significantly more 2-DG uptake compared to the unpaired group.
Delay Group Lateralization Differences
Within the delay group, several brain regions had increased 2-DG uptake in one hemisphere over another producing left or right side lateralization. For the infralimbic cortex there was no significant within effect, but a planned comparison showed that within the delay group the left hemisphere had more 2-DG uptake than the right hemisphere. For ventral cornu ammonis region 1 (vCA1) and region 3 (vCA3) there were a significant within effects (F1,12 =14.41, p= 0.003; F1,12 =5.82, p= 0.033), revealing that the delay group had more uptake in the left hemisphere compared to the right hemisphere.
The amygdala was subdivided into basolateral, central and medial (all other subnuclei) portions. For all three portions there was a significant within effect (F1,12 =13.21, p= 0.003; F1,12=11.62, p= 0.005; F1,12 = 26.6, p= 0.000). The planned comparisons showed for the delay group that there was more 2-DG uptake in the right hemisphere compared to the left hemisphere for the delay group, see Figure 4 for an example from central amygdala.
Figure 4.
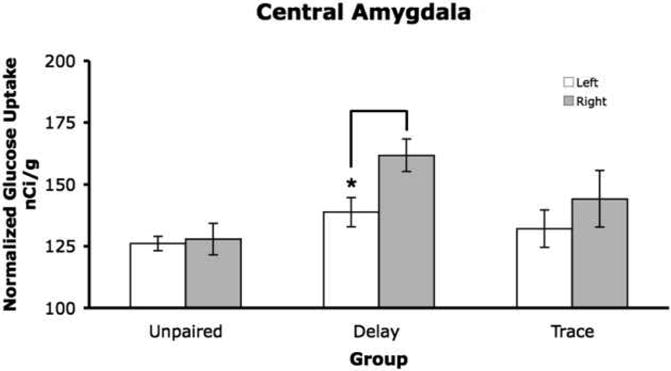
Mean 2-DG uptake in the right hemisphere of the central amygdala for the delay group had significantly more 2-DG uptake compared to the left hemisphere (p < 0.05).
For area S2 there was a significant within effect (F1,12 =16.55, p= 0.002) and the planned comparison showed the delay group had significantly more 2-DG uptake in the right hemisphere compared to the left hemisphere.
We examined posterior cortical areas lateral entorhinal and medial entorhinal cortex. We also took readings from what is labeled ectorhinal cortex by Paxinos & Watson, 1998, but has been reclassified as area 36, part of perirhinal cortex by Burwell & Amaral, 1998. We will refer to ectorhinal cortex as dorsal perirhinal and the structure classified as perirhinal by Paxinos & Watson, 1998, as ventral perirhinal. For dorsal perirhinal cortex there was a significant within effect (F1,12 =7.11, p= 0.021) and the planned comparisons revealed that the delay group had more uptake in the right hemisphere compared to the left hemisphere.
Trace Group Differences
There was a significant group effect for both the posterior medial orbital cortex (F2,12 =6.23, p= 0.014), see Figures 2 and 3, and the medial MGN (F2,12 =5.32, p= 0.022), where the trace group had significantly more 2-DG uptake than the unpaired group for both structures (Figures 5 and 6).
Trace Group Lateralization Differences
For each of the following ROIs there was a significant within effect and planned comparisons indicate that the trace group had more 2-DG uptake in the right hemisphere compared to the left hemisphere [basolateral amygdala (F1,12 =13.21, p= 0.003); medial portions of the amygdala (F1,12 = 26.6, p= 0.000); whole MGN (F1,12 =8.10, p= 0.015); dorsal MGN (F1,12 =8.70, p= 0.012); and PIN (F1,12 =8.47, p= 0.013)].
Similar results were found for the anterior half of the dorsal cornu ammonis region 1 (dCA1), and ventral MGN, where there were no within effects, but the planned comparisons for the trace group showed the right hemisphere had significantly more 2- DG uptake than the left hemisphere.
For dorsal perirhinal cortex there was a significant within effect (F1,12 =7.11, p= 0.024) and the comparison for the trace group approached significance (p= 0.066), so a secondary ANOVA comparing only the unpaired and trace groups indicated significantly more 2-DG uptake in the right hemisphere compared to the left hemisphere for the trace group.
In the hippocampal subfields the direction of significant change was left hemisphere over the right hemisphere in contrast to the other regions listed previously for lateralization in trace conditioning. For vCA1 and subiculum there was a significant within effect for each (F1,12 =14.41, p= 0.003; F1,12 =9.48, p= 0.010) and the planned comparisons showed the trace group had more uptake in the left hemisphere compared to the right hemisphere. This was the same for the anterior ventral presubiculum where there was no within effect, but the planned comparison showed the left hemisphere had more 2-DG uptake than the right hemisphere for the trace group.
Other Lateralization Differences
For the dorsal post-subiculum there was a significant within effect (F1,12 =12.33, p= 0.004), showing that within the unpaired group the left hemisphere had more 2-DG uptake than the right hemisphere.
For the SG nucleus there was a significant within effect (F1,12 =7.59, p= 0.017), and this appears to be a general effect wherein the right hemisphere had more 2-DG uptake compared to the left hemisphere for all three groups.
Discussion
Generally, there were more group differences between the delay and unpaired groups than between the trace and unpaired groups across the forebrain and midbrain. The regions with increased uptake in the delay group included areas previously associated with delay conditioning such as the MGN and amygdala as well as other areas not previously associated with the delay eyeblink circuit such as the orbital frontal cortices.
For the trace group, many differences were found in lateralization of 2-DG uptake. It was discovered that areas previously associated with the trace circuit such as dorsal anterior CA1 of the hippocampus, showed an increase in uptake unilaterally. In addition, other structures not previously linked with trace conditioning showed lateralization changes including the amygdala, ventral subiculum, ventral anterior presubiculum, and the dorsal perirhinal cortex.
The posterior medial orbital cortex had increased 2-DG uptake in the delay and trace groups, whereas both anterior and posterior halves of the medial orbital cortex were increased for the delay group only. These areas could contribute to eyeblink conditioning through connections with other structures associated with eyeblink conditioning including the periaquaductal grey (PAG) and amygdala (Blankenship et al., 2005; McCormick, Lavond, & Thompson, 1983; Price, 2007). Increased 2-DG uptake in the lateral and ventral orbital cortex as well as frontal association cortex was evident in the delay group and orbital frontal cortex has been associated with delay excitatory tone conditioning and with the devaluation of cues in associative learning tasks, discrimination learning, and reversal learning (Gallagher, McMahan, & Schoenbaum, 1999; McIntosh & Gonzalez-Lima, 1994; Murray, O'Doherty, Schoenbaum, 2007; Schoenbaum, Chiba, & Gallagher, 1998). These orbital regions, which have not been associated with delay eyeblink circuitry before, may be tracking expected outcomes of associative cues (Gallagher, McMahan, & Schoenbaum, 1999). While this area may not be essential for basic delay eyeblink conditioning it could become important if during training the value of the outcome changes.
The increased 2-DG uptake in prelimbic cortex for the delay group could be due in part to its strong connections with the amygdala (Price, 2007). For the delay group infralimbic cortex had an increase in left hemisphere compared to right and this region also shares connections with the amygdala (Price, 2007). Both prelimbic and infralimbic cortex can be classified as medial prefrontal cortex (mPFC) (Price, 2007). In fear conditioning, this region has also shown learning related plasticity when a tone is an excitor rather than when used as a blocking stimulus (Jones & Gonzalez-Lima, 2001). In addition, the mPFC has been implicated in humans to be important for reward-related decisions (Glascher, Hampton, & O'Doherty, 2008). Therefore, the neural activity in these brain areas may be tracking associative cues to be used in future contingency learning, fostered by their connections with the amygdala (Price, 2007). In this experiment, even though the tone was a Pavlovian excitor in the trace condition, we did not find increased uptake in these areas for trace animals.
Different areas within the amygdala also demonstrated metabolic changes to eyeblink training. Increases in 2-DG uptake identified within the central nucleus during delay conditioning are supported by a recent lesion study that found this area to be important for acquisition of delay eyeblink conditioning (Blankenship et al, 2005; Lee & Kim, 2004). The basolateral and medial areas of the amygdala showed increases in 2-DG uptake within the right hemisphere compared to the left hemisphere for both delay and trace groups. The changes in the basolateral amygdala, which also showed increases in 2-DG uptake, could have been facilitated by connections with the medial orbital cortex (Schoenbaum, Saddoris, & Stainaker, 2007). Also contributing to the role of the basolateral amygdala during delay eyeblink conditioning (Blankenship et al, 2005; Lee & Kim, 2004), is the auditory input it receives from the medial auditory thalamus (LeDoux, Farb, & Romanski, 1991). While the role of the amygdala in trace conditioning has not been as thoroughly investigated, the amygdala is critical in another trace paradigm, instrumental avoidance conditioning in rabbits (Poremba & Gabriel, 1999). The lateralization changes found within the basolateral and medial nuclei suggest the possible participation of these areas during trace conditioning.
The dCA1 region is important to trace conditioning which is supported by lesion and recording studies (Green & Arenos, 2007; Kim et al., 1995; McEhron & Disterhoft, 1997; Tseng, Guan, Disterhoft, & Weiss, 2004; Weible, O'Reilly, Weiss, & Disterhoft, 2006; Woodruff-Pak & Disterhoft, 2008). The increased 2-DG uptake in the trace conditioning group was localized to the right hemisphere of the dorsal anterior portion of CA1, contralateral to the side of training. Weible et al. (2006) recorded from the dCA1 and found that early in training the side ipsilateral, to the trained eye had increased neuronal activity. Late in training however, the contralateral dCA1 had increased neuronal activity. This late training activity corresponds to the current 2-DG results. As expected, based on the previous recording and lesions studies, dCA1 is metabolically active during trace conditioning and the current results further delineate that region of change to the anterior portion of dCA1. Jones and Gonzalez-Lima (2001) found changes in 2-DG uptake within dCA1 during tone delay fear conditioning, but the current delay animals did not have significant changes in this region; differences in sound duration and training parameters during the 2-DG uptake period may account for the different findings.
There were no differences for dorsal CA3 in the trace or delay groups. Even though we subdivided the regions into anterior and posterior halves, these partitions may not have identified changes in activity that could depend on small cell groups. Evidence that dCA3 itself is not critical for acquisition of trace conditioning in mice, even if it is essential for adaptive timing of the responses (Kishimoto, Nakazawa, Tonegawa, Kirino, & Kano, 2006), is supportive of the lack of 2-DG uptake changes in this area. Thus, although dCA3 is important for modulation during trace eyeblink conditioning, the neuronal activity observed after the behavior is learned may not be sufficient to increase or decrease 2-DG uptake at the time point assessed in this experiment.
Increased left lateralization in both delay and trace animals occurred in ventral CA1 of the hippocampus. For ventral CA3, only the delay animals had left side lateralization, which is ipsilateral to the trained eye. Weible et al. (2006) recorded from ventral hippocampus and found some learning related changes. However, these changes were of smaller magnitude than in the dorsal areas of the hippocampus, which seems to correspond to the current results where we have a smaller number of changes in 2-DG activity in the ventral hippocampus. For trace animals, there was a left side lateralization increase in the ventral subiculum and the ventral anterior presubiculum in addition to the change in ventral CA1. These areas have not been associated with trace eyeblink conditioning in the past and could be new areas to investigate for changes due to associative plasticity.
The increase in bilateral 2-DG uptake found in the auditory thalamus is supported by recent lesion and stimulation work demonstrating the importance of this region in auditory delay eyeblink conditioning (Campolattaro, Halverson, & Freeman, 2007; Halverson, Poremba & Freeman, 2008; Halverson & Freeman, 2006). Learning related plasticity in the MGN has also been demonstrated in tone-conditioned bradycardia and when the tone is trained as a Pavlovian excitor in conditioned inhibition during fear conditioning (Gonzalez-Lima & Scheich, 1984; McIntosh & Gonzalez-Lima, 1995). Within subdivisions of the MGN, there was an increase in 2-DG uptake for the medial MGN during trace conditioning. The mMGN has been implicated to be one of the primary nuclei for auditory delay conditioning, thus it could be playing a similar role in auditory trace conditioning (Campolattaro et al, 2007; Halverson & Freeman, 2006). It is also essential for trace discriminative avoidance conditioning (Poremba & Gabriel, 1997). Other regions of the MGN such as the ventral, dorsal regions, and the PIN showed increased right lateralization for trace animals. While the increase in the right hemisphere is supported by lesion and stimulation work, for delay acquisition (Campolattaro et al., 2007; Halverson & Freeman, 2006), this is an unexplored area in relation to trace conditioning.
Delay animals also show, in addition to changes in auditory thalamus, increased 2-DG uptake in the anterior half of primary auditory cortex. While this region is not critical for delay conditioning it does develop learning related plasticity related to the CS-US interval in rabbits trained on eyeblink conditioning as well as to tone-conditioned bradycardia in rats (Gonzalez-Lima & Scheich, 1986; Kraus & Disterhoft, 1982). Primary auditory cortex also receives projections from dorsal and ventral MGN, areas that also show increased 2-DG uptake (LeDoux et al., 1991; LeDoux, Ruggiero, & Reis, 1985). Perhaps, the auditory cortex actively tracks auditory input as a secondary routing system, as it does during auditory fear conditioning (Romanski & LeDoux, 1992).
The anterior cingulate cortex (ACC) and some divisions of the posterior cingulate cortex (PCC) (RSGa; RSGb) demonstrated increased 2-DG uptake for the delay animals compared to the unpaired animals. This increase in metabolic activity for these areas could be associated with modulatory neuronal activity related to delay conditioning. The areas of the PCC that demonstrated neuronal activity recording differences for delay conditioning are not critical for trace conditioning (Weible et al., 2000) and this may explain why differences in 2-DG uptake were not found in these regions for trace animals. The ACC is associated with learning and memory tasks such as attentional set shifting, fear conditioning, and excitatory tone conditioning (Jones & Gonzalez-Lima, 1998; Ng, Noblejas, Rodefer, Smith, & Poremba, 2007; Bissiere, Plachta, Hoyer, McAllister, Olpe, Grace & Cryan, 2008). Although the ACC (categorized as the caudal mPFC by some groups) has also been found to be involved in trace conditioning (Kronforst-Collins & Disterhoft, 1998; Weible et al, 2000; Weible, Weiss, & Disterhoft, 2003), only differences during delay conditioning were found in this experiment. Weible et al., 2003 recorded from the caudal ACC region during trace conditioning in the rabbit and found that the activation was very high during the early days of training. The current experiment assessed 2-DG readings towards the end of acquisition when the activity may have diminished to levels where metabolic differences were no longer apparent in this region.
The increase in 2-DG uptake found for delay animals in the posterior MD thalamus is supported by evidence that this nucleus can influence delay acquisition and exhibited increased 2-DG uptake when a tone was used as a Pavlovian excitor in fear conditioning (Buchanan, Powell, Beylotte, & Penny, 1998; Jones & Gonzalez-Lima, 2001). The MD thalamus also receives and sends projections to the prefrontal cortex, an area that had increased 2-DG uptake for delay conditioning (Goldman-Rakic & Porrino, 1985; Price, 2007).
For delay animals, 2-DG uptake was lateralized to the right hemisphere in the secondary somatosensory cortex, whereas in the barrel fields of somatosensory cortex there was an overall increase during delay conditioning. These areas have not traditionally shown plasticity during eyeblink conditioning except when the CS is whisker stimulation (Galvez, Weible, & Disterhoft, 2007).
There were also 2-DG uptake increases lateralized to the right hemisphere in dorsal perirhinal cortex for both delay and trace groups. Lesions of this area that include ventral perirhinal cortex impair both simultaneous feature-positive discrimination learning, feature-negative discrimination learning, and sensory preconditioning using delay eyeblink paradigms (Campolattaro & Freeman, 2006a; Campolattaro & Freeman, 2006b; Nicholson & Freeman, 2000). Rabbits that underwent trace conditioning had increased c-Fos activity in perirhinal cortex during acquisition but not during maintenance performance (Jiménez-Díaz, Sancho-Bielsa, Gruart, & López-García, 2006). In the current study, there was increased 2-DG uptake in dorsal perirhinal cortex as animals reached the learning criterion. This region receives input from the SG, PIN, MGN, insular and entorhinal cortices (Burwell & Amaral, 1998; Linke & Schwegler, 2000), and may be significantly involved in trace conditioning as well as delay conditioning.
There were many changes in 2-DG uptake that were lateralized to one hemisphere across the delay and trace groups. Lateralization of metabolic activity could indicate a difference in function for that brain region. For example, Wetzel, Ohl, & Scheich (2008) found that lesions to the right auditory cortex impaired discrimination of continuous FM sweeps whereas left auditory cortex lesions impaired discrimination of gap durations. Perhaps, some of the changes found here with the increase in right side lateralization within the basolateral or medial amygdala, or the dorsal perirhinal areas are related to particular functions for delay or trace conditioning. In addition, while the CS tone is presented bilaterally, the US shock is presented on the left side only. It is possible these training conditions could facilitate changes in lateralization (Blair, Huynh, Vaz, Van, Patel, Hiteshi, Lee, & Tarpley, 2005).
In Plakke et al. (2007), we examined the cerebellum in the same subjects and found increased 2-DG uptake in regions such as the interpositus nucleus and lobule HVI, areas that have been shown to be involved in both delay and trace conditioning. The other general finding from Plakke et al. (2007), was that more regions of cerebellar cortex had increased levels of 2-DG uptake for delay animals. This mirrors the trend found here where, in general, there are more brain regions in the midbrain and forebrain that had increased uptake for the delay group. Perhaps, the temporal components of the CS and US presentations in the trace and unpaired groups are more similar to each other than for the delay group, where neuronal activation by the CS and US occur next to each other in time whereas a time gap exists between CS and US in the trace and unpaired groups. This may be why more bilateral group differences were found between the unpaired and delay groups. One interesting difference between the cerebellar areas and forebrain areas was the prevalence of lateralized 2-DG uptake in the forebrain regions. Lateralization within the forebrain in animal models of eyeblink conditioning has rarely been studied. Here, both the delay and trace groups had increased 2-DG uptake in the right basolateral and medial amygdala as well as dorsal perirhinal cortex. Whether these changes are due to training parameters with the US being delivered to one side could be further investigated.
In human eyeblink conditioning using both trace and delay paradigms, imaging studies have found changes in cerebral blood flow in primary auditory cortex, areas of the medial temporal lobe, inferior prefrontal cortex, parietal lobe, and cerebellum (Cheng, Disterhoft, Power, Ellis, & Desmond, 2008; Molchan, Sunderland, McIntosh, Herscovitch, & Schreurs, 1994; Schreurs, McIntosh, Bahro, Herscovitch, Sunderland & Molchan, 1997). In the present study, we found changes in primary auditory cortex for delay animals, but the change was not lateralized to the contralateral side, as it was with the humans (Schreurs et al., 1997). Schreurs et al., (1997) also found decreases in the left inferior and middle prefrontal cortices (contralateral to the trained eye), whereas we found an increase in the left infralimbic cortex (ipsilateral to the trained eye). These differences may be due to methodological differences, i.e., heavy water versus glucose analog. Within the hippocampus we found right side lateralization in the dorsal anterior half of CA1, this is comparable to findings in humans where late in trace training there was more right hippocampal activation (Cheng et al., 2008). While some of the present findings are congruent with what has been found in humans, there area some inconsistencies, such as no lateralized auditory cortex uptake in rats, this could be due to methodological differences (e.g., training across days vs. training in one day), or species differences. However, there appear to be more similarities than differences between the eyeblink circuitry in animals and humans (Cheng et al, 2008).
Many brain areas demonstrated increases in 2-DG uptake for delay and/or trace conditioning. The delay group had increases in areas previously associated with this type of conditioning including the MGN, auditory cortex, and the central nucleus of the amygdala, and changes in other areas not previously associated with this type of conditioning such as the lateral and ventral orbital cortices. While these areas may not be critical for delay eyeblink conditioning, they may modulate learning and/or performance of delay eyeblink conditioning with modified training parameters or in different contexts.
For the trace group the changes were more often unilateral with a right hemisphere increase over the left hemisphere such as in dorsal anterior CA1. Finding metabolic changes in areas such as CA1 support the inclusion of the hippocampus within the current trace eyeblink circuit. The trace group also had increases in 2-DG uptake lateralized to the right hemisphere for regions not previously associated with trace eyeblink conditioning such as the ventral and dorsal MGN, basolateral and central amygdala, ventral subiculum, ventral anterior presubiculum and the dorsal perirhinal cortex. These results provide new regions for future investigation to expand the neural circuit underlying trace eyeblink conditioning.
One area that showed increases in 2-DG uptake in both the delay and trace groups was the medial orbital cortex. This area was not previously associated with either type of eyeblink conditioning. The medial orbital cortex in the frontal lobe may be processing information that is relevant to both tasks such as attentional processing through its connections with the cingulate cortex and/or emotional processing through its connections with the amygdala (Price, 2007).
Although many of the delay group changes were found in forebrain regions that are not necessary for delay eyeblink conditioning, these areas are important for other forms of delay classical conditioning such as the basolateral amygdala in fear conditioning (Blankenship et al., 2005; Davis & Whalen, 2001; Fanselow & Gale, 2003; Lee & Kim, 2004; LeDoux, 1998). These findings support the idea that many distributed brain areas contribute to classical conditioning and may be important for a wide variety of learning phenomena. In addition, brain areas in one classical conditioning paradigm may be providing a similar function during other forms of classical conditioning. For example the amygdala could encode the emotional relevance of the CS stimuli for both eyeblink and fear conditioning. Lesions of the amygdala slow acquisition of eyeblink conditioning, and the amygdala is important for normal acquisition of both eyeblink and fear conditioning (Blankenship et al., 2005; Davis & Whalen, 2001; Fanselow & Gale, 2003; Lee & Kim, 2004; LeDoux, 1998; Medina et al., 2002). Here, finding increases in metabolic uptake within the amygdala during delay and trace eyeblink conditioning provides more evidence that various forms of learning use comparable neural circuits (Poremba & Gabriel, 1999; Smith et al., 2001).
Expanding our knowledge of one specific neural circuit, in this case eyeblink conditioning, may elucidate the underpinnings of other learning circuits. Structures with increases in metabolic uptake during eyeblink conditioning may also have modulatory effects on learning in other paradigms. Identification of particular brain areas that are involved in one circuit also allows for comparisons between neural circuits to examine what is shared, as well as what is unique to that type of learning. Mapping commonalities for different neural circuits can establish common functions for other learning systems, for instance the role of the amygdala in both fear and eyeblink conditioning. This knowledge can assist our understanding of particular behaviors and how even when the behaviors differ they may share similar neural pathways.
Acknowledgments
This work was supported by funding awarded to 1) Amy Poremba from the University of Iowa Startup Funds and National Institute of Mental Health Grant MH66922, and 2) John H. Freeman from National Institute of Mental Health Grant MH080005 and National Institute of Neurological Disorders and Stroke Grant NS038890. We would like to thank Norma DiPietro, Vijayalakshmi Canakala, and Hunter Halverson for their assistance on this project.
Footnotes
Publisher's Disclaimer: This is a PDF file of an unedited manuscript that has been accepted for publication. As a service to our customers we are providing this early version of the manuscript. The manuscript will undergo copyediting, typesetting, and review of the resulting proof before it is published in its final citable form. Please note that during the production process errors may be discovered which could affect the content, and all legal disclaimers that apply to the journal pertain.
References
- Barrett D, Shumake J, Jones D, Gonzalez-Lima F. Metabolic Mapping of Mouse Brain Activity after Extinction of a Conditioned Emotional Response. The Journal of Neuroscience. 2003;23(13):5740–5749. doi: 10.1523/JNEUROSCI.23-13-05740.2003. [DOI] [PMC free article] [PubMed] [Google Scholar]
- Berger TW, Alger B, Thompson RF. Neuronal substrate of classical conditioning in the hippocampus. Science. 1976;192(4238):483–5. doi: 10.1126/science.1257783. [DOI] [PubMed] [Google Scholar]
- Beylin AV, Gandhi CC, Wood GE, Talk AC, Matzel LD, Shors TJ. The Role of Hippocampus in Trace Conditioning: Temporal Discontinuity or Task Difficulty? Neurobiology of Learning and Memory. 2001;76:447–461. doi: 10.1006/nlme.2001.4039. [DOI] [PubMed] [Google Scholar]
- Bissiere S, Plachta N, Hoyer D, McAllister KH, Olpe HR, Grace AA, Cryan JF. The rostral anterior cingulated cortex modulates the efficiency of amygdala-dependent fear learning. Biological Psychiatry. 2008;63(9):821–831. doi: 10.1016/j.biopsych.2007.10.022. [DOI] [PMC free article] [PubMed] [Google Scholar]
- Blair HT, Huynh VK, Vaz VT, Van J, Patel RR, Hiteshi AK, Lee JE, Tarpley JW. Unilateral storage of fear memories by the amygdala. The Journal of Neuroscience. 2005;25(16):4198–4205. doi: 10.1523/JNEUROSCI.0674-05.2005. [DOI] [PMC free article] [PubMed] [Google Scholar]
- Blankenship MR, Huckfeldt R, Steinmetz JJ, Steinmetz JE. The effects of amygdala lesions on hippocampal activity and classical eyeblink conditioning in rats. Brain Research. 2005;1035:120–130. doi: 10.1016/j.brainres.2004.11.061. [DOI] [PubMed] [Google Scholar]
- Breier A, Crane AM, Kennedy C, Sokoloff L. The effects of pharmacologic doses of 2-deoxy-D-glucose on local cerebral blood flow in the awake, unrestrained rat. Brain Research. 1993;618:277–282. doi: 10.1016/0006-8993(93)91276-x. [DOI] [PubMed] [Google Scholar]
- Buchanan SL, Powell DA, Beylotte FM, III, Penney J. Lesions of the midline thalamic nuclei impair classical conditioning under partial but not continuous reinforcement conditions. Behavioral Brain Research. 1998;97:49–58. doi: 10.1016/s0166-4328(98)00022-9. [DOI] [PubMed] [Google Scholar]
- Burwell RD, Amaral DG. Cortical afferents of the perirhinal, postrhinal, and entorhinal cortices of the rat. The Journal of Comparative Neurology. 1998;398:179–205. doi: 10.1002/(sici)1096-9861(19980824)398:2<179::aid-cne3>3.0.co;2-y. [DOI] [PubMed] [Google Scholar]
- Campolattaro MM, Freeman JH. Perirhinal cortex lesions impair simultaneous but no serial feature positive discrimination learning. Behavioral Neuroscience. 2006a;120(4):970–975. doi: 10.1037/0735-7044.120.4.970. [DOI] [PMC free article] [PubMed] [Google Scholar]
- Campolattaro MM, Freeman JH. Perirhinal cortex lesions impair feature-negative discrimination. Neurobiology of Learning and Memory. 2006b;89(2):205–213. doi: 10.1016/j.nlm.2006.03.001. [DOI] [PMC free article] [PubMed] [Google Scholar]
- Campolattaro MM, Halverson HE, Freeman JH. Medial auditory thalamic stimulation as a conditioned stimulus for eyeblink conditioning in rats. Learning & Memory. 2007;14:152–159. doi: 10.1101/lm.465507. [DOI] [PMC free article] [PubMed] [Google Scholar]
- Cheng DT, Disterhoft JF, Power JM, Ellis DA, Desomond JE. Neural substrates underlying human delay and trace eyeblink conditioning. Proceedings of the National Academy of Sciences. 2008;105(23):8108–8113. doi: 10.1073/pnas.0800374105. [DOI] [PMC free article] [PubMed] [Google Scholar]
- Christian KM, Thompson RF. Neural Substrates of Eyeblink Conditioning: Acquisition and Retention. Learning & Memory. 2003;11:427–455. doi: 10.1101/lm.59603. [DOI] [PubMed] [Google Scholar]
- Davis M, Whalen PJ. The amygdala: vigilance and emotion. Molecular Psychiatry. 2001;6:13–34. doi: 10.1038/sj.mp.4000812. [DOI] [PubMed] [Google Scholar]
- Fanselow MS, Gale GD. The amygdala, fear, and memory. Annuals of NY Acad Sci. 2003;985:125–134. doi: 10.1111/j.1749-6632.2003.tb07077.x. [DOI] [PubMed] [Google Scholar]
- Freeman JH, Halverson HE, Hubbard EM. Inferior colliculus lesions impair eyeblink conditioning in rats. Learning & Memory. 2007;14(12):842–6. doi: 10.1101/lm.716107. [DOI] [PMC free article] [PubMed] [Google Scholar]
- Gallagher M, McMahan RW, Schoenbaum G. Orbitofrontal cortex and representation of incentive value in associative learning. The Journal of Neuroscience. 1999;19(15):610–6614. doi: 10.1523/JNEUROSCI.19-15-06610.1999. [DOI] [PMC free article] [PubMed] [Google Scholar]
- Galvez R, Weible AP, Disterhoft JF. Cortical barrel lesions impair whisker-CS trace eyeblink conditioning. Learning & Memory. 2007;14:94–100. doi: 10.1101/lm.418407. [DOI] [PMC free article] [PubMed] [Google Scholar]
- Glascher J, Hampton AN, O'Doherty JP. Determining a role for ventromedial prefrontal cortex in encoding action-based value signals during reward-related decision making. Cerebral Cortex. 2008 doi: 10.1093/cercor/bhn098. In Press: PMID: 18550593. [DOI] [PMC free article] [PubMed] [Google Scholar]
- Goldman-Rakic PS, Porrino LJ. The primate mediodorsal (MD) nucleus and its projections to the frontal lobe. The Journal of Comparative Neurology. 1985;242:535–560. doi: 10.1002/cne.902420406. [DOI] [PubMed] [Google Scholar]
- Gonzalez-Lima F, Scheich H. Neural substrates for tone-conditioned bradycardia demonstrated with 2-Deoxyglucose. I. Activation of auditory nuclei. Behavioral Brain Research. 1984;14:213–233. doi: 10.1016/0166-4328(84)90190-6. [DOI] [PubMed] [Google Scholar]
- Gonzalez-Lima F, Scheich H. Neural substrates for tone-conditioned bradycardia demonstrated with 2-Deoxyglucose. II. Auditory cortex plasticity. Behavioral Brain Research. 1986;20:281–293. doi: 10.1016/0166-4328(86)90228-7. [DOI] [PubMed] [Google Scholar]
- Green JT, Arenos JD. Hippocampal and cerebellar single-unit activity during delay and trace eyeblink conditioning in the rat. Neurobiology of Learning and Memory. 2007;87(2):269–84. doi: 10.1016/j.nlm.2006.08.014. [DOI] [PMC free article] [PubMed] [Google Scholar]
- Halverson HE, Freeman JH. Medial auditory thalamic nuclei are necessary for eyeblink conditioning. Behavioral Neuroscience. 2006;120(4):880–887. doi: 10.1037/0735-7044.120.4.880. [DOI] [PMC free article] [PubMed] [Google Scholar]
- Halverson HE, Poremba A, Freeman JH. Medial auditory thalamus inactivation prevents acquisition and retention of eyeblink conditioning. Learning & Memory. 2008;15(7):532–38. doi: 10.1101/lm.1002508. [DOI] [PMC free article] [PubMed] [Google Scholar]
- Jiménez-Díaz L, Sancho-Bielsa FJ, Gruart A, López-García C. Evolution of cerebral cortex involvement in the acquisition of associative learning. Behavioral Neuroscience. 2006;120(5):1043–1056. doi: 10.1037/0735-7044.120.5.1043. [DOI] [PubMed] [Google Scholar]
- Jones D, Gonzalez-Lima F. Mapping Pavlovian conditioning effects on the brain: blocking, contiguity, and excitatory effects. Journal of Neurophysiology. 2001;86:809–823. doi: 10.1152/jn.2001.86.2.809. [DOI] [PubMed] [Google Scholar]
- Keppel G. Design and analysis: a researacher's handbook. 2. Chap 8. Englewood Cliffs, NJ: Prentice-Hall; 1982. [Google Scholar]
- Kim JJ, Clark RE, Thompson RF. Hippocampectomy Impairs the Memory of Recently, but Not Remotely, Acquired Trace Eyeblink Conditioned Responses. Behavioral Neuroscience. 1995;109(2):195–203. doi: 10.1037//0735-7044.109.2.195. [DOI] [PubMed] [Google Scholar]
- Kishimoto Y, Nakazawa K, Tonegawa S, Kirino Y, Kano M. Hippocampal CA3 NMDA receptors are crucial for adaptive timing of trace eyeblink conditioned response. The Journal of Neuroscience. 2006;26(5):1562–1570. doi: 10.1523/JNEUROSCI.4142-05.2006. [DOI] [PMC free article] [PubMed] [Google Scholar]
- Kraus N, Disterhoft JF. Response plasticity of single neurons in rabbit auditory association cortex during tone-signalled learning. Brain Research. 1982;246(2):205–215. doi: 10.1016/0006-8993(82)91168-4. [DOI] [PubMed] [Google Scholar]
- Kronforst-Collins MA, Disterhoft JF. Lesions of the caudal area of rabbit medial prefrontal cortex impair trace eyeblink conditioning. Neurobiology of Learning & Memory. 1998;69:147–162. doi: 10.1006/nlme.1997.3818. [DOI] [PubMed] [Google Scholar]
- LeDoux JE. Fear and the brain: where have we been, and where are we going? Biological Psychiatry. 1998;44(12):1201–03. doi: 10.1016/s0006-3223(98)00282-0. [DOI] [PubMed] [Google Scholar]
- LeDoux JE, Ruggiero DA, Reis DJ. Projections to the subcortical forebrain from anatomically defined regions of the medial geniculate body in the rat. The Journal of Comparative Neurology. 1985;242:182–213. doi: 10.1002/cne.902420204. [DOI] [PubMed] [Google Scholar]
- LeDoux JE, Farb CR, Romanski LM. Overlapping projections to the amygdala and striatum from auditory processing areas of the thalamus and cortex. Neuroscience Letters. 1991;134:139–144. doi: 10.1016/0304-3940(91)90526-y. [DOI] [PubMed] [Google Scholar]
- Lee T, Kim JJ. Differential effects of cerebellar, amygdalar, and hippocampal lesions on classical eyeblink conditioning in rats. The Journal of Neuroscience. 2004;24(13):3242–3250. doi: 10.1523/JNEUROSCI.5382-03.2004. [DOI] [PMC free article] [PubMed] [Google Scholar]
- Linke R, Schwegler H. Convergent and complementary projections of the caudal paralaminar thalamic nuclei to rat temporal and insular cortex. Cerebral Cortex. 2000;10:753–771. doi: 10.1093/cercor/10.8.753. [DOI] [PubMed] [Google Scholar]
- McCormick DA, Lavond DG, Thompson RF. Neuronal responses of the rabbit brainstem during performance of the classically conditioned nictitating membrane (NM)/ eyelid response. Brain Research. 1983;271(1):73–88. doi: 10.1016/0006-8993(83)91366-5. [DOI] [PubMed] [Google Scholar]
- McEchron MD, Disterhoft JF. Sequence of single neuron changes in CA1 hippocampus of rabbits during acquisition of trace eyeblink conditioned responses. Journal of Neurophysiology. 1997;78(2):1030–1044. doi: 10.1152/jn.1997.78.2.1030. [DOI] [PubMed] [Google Scholar]
- McIntosh AR, Gonzalez-Lima F. Functional network interactions between parallel auditory pathways during Pavlovian conditioned inhibition. Brain Research. 1995;683:228–241. doi: 10.1016/0006-8993(95)00378-4. [DOI] [PubMed] [Google Scholar]
- McIntosh AR, Gonzalez-Lima F. Network interactions among limbic cortices, basal forebrain, and cerebellum differentiate a tone conditioned as a Pavlovian excitatory or inhibitor: fluorodeoxyglucose mapping and covariance structural modeling. Journal of Neurophysiology. 1994;72(4):1717–1733. doi: 10.1152/jn.1994.72.4.1717. [DOI] [PubMed] [Google Scholar]
- McLaughlin J, Skaggs H, Churchwell J, Powell DA. Medial prefrontal cortex and Pavlovian conditioning: trace versus delay conditioning. Behavioral Neuroscience. 2002;116(1):37–47. [PubMed] [Google Scholar]
- Medina JF, Repa JC, Mauk MD, LeDoux JE. Parallels between cerebellum- and amygdala-dependent conditioning. Nature Reviews Neuroscience. 2002;3(2):122–131. doi: 10.1038/nrn728. [DOI] [PubMed] [Google Scholar]
- Miller MJ, Chen NK, Li L, Tom B, Weiss C, Disterhoft JF, Wyrwicz AM. fMrI of the conscious rabbit during unilateral classical eyeblink conditioning reveals bilateral cerebellar activation. Journal of Neuroscience. 2003;23(37):11753–11758. doi: 10.1523/JNEUROSCI.23-37-11753.2003. [DOI] [PMC free article] [PubMed] [Google Scholar]
- Molchan SE, Sunderland T, McIntosh AR, Herscovitch P, Schreurs BG. A functional anatomical study of associative learning in humans. Proceedings of the National Academy of Sciences. 1994;91(17):8122–8126. doi: 10.1073/pnas.91.17.8122. [DOI] [PMC free article] [PubMed] [Google Scholar]
- Moyer JR, Jr, Deyo RA, Disterhoft JF. Hippocampectomy disrupts trace eye-blink conditioning in rabbits. Behavioral Neuroscience. 1990;104(2):243–52. doi: 10.1037//0735-7044.104.2.243. [DOI] [PubMed] [Google Scholar]
- Murray EA, O'Doherty JP, Schoenbaum G. What we know and do not know about the functions of the orbitofrontal cortex after 20 years of cross-species studies. The Journal of Neuroscience. 2007;27(31):8166–8169. doi: 10.1523/JNEUROSCI.1556-07.2007. [DOI] [PMC free article] [PubMed] [Google Scholar]
- Ng CW, Noblejas MI, Rodefer JS, Smith CB, Poremba A. Double dissociation of attentional resources: prefrontal versus cingulated cortices. The Journal of Neuroscience. 2007;27(45):12123–12131. doi: 10.1523/JNEUROSCI.2745-07.2007. [DOI] [PMC free article] [PubMed] [Google Scholar]
- Nicholson DA, Freeman JH. Lesions of the perirhinal cortex impair sensory preconditioning in rats. Behavioral Brain Research. 2000;112(1-2):69–75. doi: 10.1016/s0166-4328(00)00168-6. [DOI] [PubMed] [Google Scholar]
- Paxinos G, Watson C. The rat brain atlas in stereotaxic coordinates. 4th. San Diego, CA: Academic Press; 1998. [Google Scholar]
- Plakke B, Freeman JH, Poremba A. Metabolic mapping of the rat cerebellum during delay and trace eyeblink conditioning. Neurobiology of Learning and Memory. 2007;88:11–18. doi: 10.1016/j.nlm.2007.03.008. [DOI] [PMC free article] [PubMed] [Google Scholar]
- Poremba A, Gabriel M. Medial geniculate lesions block amygdalar and cingulothalamic learning-related neuronal activity. The Journal of Neuroscience. 1997;17(21):8645–55. doi: 10.1523/JNEUROSCI.17-21-08645.1997. [DOI] [PMC free article] [PubMed] [Google Scholar]
- Poremba A, Gabriel M. Amygdala neurons mediate acquisition but not maintenance of instrumental avoidance behavior in rabbits. The Journal of Neuroscience. 1999;19(21):9635–9641. doi: 10.1523/JNEUROSCI.19-21-09635.1999. [DOI] [PMC free article] [PubMed] [Google Scholar]
- Price JL. Definition of the orbital cortex in relation to specific connections with limbic and visceral structures and other cortical regions. Annals of the New York Academy of Sciences. 2007;1121(1):54–71. doi: 10.1196/annals.1401.008. [DOI] [PubMed] [Google Scholar]
- Romanski LM, LeDoux JE. Equipotentiality of thalamo-amygdala and thalamo-cortio-amygdala circuits in auditory fear conditioning. The Journal of Neuroscience. 1992;12(11):4501–09. doi: 10.1523/JNEUROSCI.12-11-04501.1992. [DOI] [PMC free article] [PubMed] [Google Scholar]
- Schoenbaum G, Chiba AA, Gallagher M. Orbitofrontal cortex and basolateral amygdala encode expected outcomes during learning. Nature Neuroscience. 1998;1(2):155–9. doi: 10.1038/407. [DOI] [PubMed] [Google Scholar]
- Schoenbaum G, Saddoris P, Stainaker TA. Reconciling the roles of orbitofrontal cortex in reversal learning and the encoding of outcome expectancies. Annals of the New York Academy of Sciences. 2007;1121(1):320–335. doi: 10.1196/annals.1401.001. [DOI] [PMC free article] [PubMed] [Google Scholar]
- Schreurs BG, McIntosh AR, Bahro M, Herscovitch P, Sunderland T, Molchan SE. Lateralization and behavioral correlation of changes in regional cerebral blood flow with classical conditioning of the human eyeblink response. Journal of Neurophysiology. 1997;77(4):2153–2163. doi: 10.1152/jn.1997.77.4.2153. [DOI] [PubMed] [Google Scholar]
- Smith DM, Monteverde J, Schwartz E, Freeman JH, Jr, Gabriel M. Lesions in the central nucleus of the amygdala: discriminative avoidance learning, discriminative approach learning, and cingulothalamic training-induced neuronal activity. Neurobiology of Learning & Memory. 2001;76:403–425. doi: 10.1006/nlme.2001.4019. [DOI] [PubMed] [Google Scholar]
- Sokoloff L, Reivich M, Kennedy C, Des Rosiers MH, Patlak CS, Pettigrew KD, Sakurada O, Shinohara M. The [14C]deoxyglucose method for the measurement of local cerebral glucose utilization: theory, procedure, and normal values in the conscious and anesthetized albino rat. Journal of Neurochemistry. 1977;28(5):897–916. doi: 10.1111/j.1471-4159.1977.tb10649.x. [DOI] [PubMed] [Google Scholar]
- Solomon PR, Vander Schaaf ER, Thompson RF, Weisz DJ. Hippocampus and trace conditioning of the rabbit's classically conditioned nictitating membrane response. Behavioral Neuroscience. 1986;100(5):729–744. doi: 10.1037//0735-7044.100.5.729. [DOI] [PubMed] [Google Scholar]
- Takehara K, Kawahara S, Kirino Y. Time-dependent reorganization of the brain components underlying memory retention in trace eyeblink conditioning. The Journal of Neuroscience. 2003;23(30):9897–9905. doi: 10.1523/JNEUROSCI.23-30-09897.2003. [DOI] [PMC free article] [PubMed] [Google Scholar]
- Tseng W, Guan R, Disterhoft JF, Weiss C. Trace eyeblink conditioning is hippocampally dependent in mice. Hippocampus. 2004;14:58–65. doi: 10.1002/hipo.10157. [DOI] [PubMed] [Google Scholar]
- Thompson RR. In search of memory traces. Annual Review of Psychology. 2005;56:1–23. doi: 10.1146/annurev.psych.56.091103.070239. [DOI] [PubMed] [Google Scholar]
- Weible AP, McEchron MD, Disterhoft JF. Cortical involvement in acquisition and extinction of trace eyeblink conditioning. Behavioral Neuroscience. 2000;114(6):1058–67. doi: 10.1037//0735-7044.114.6.1058. [DOI] [PubMed] [Google Scholar]
- Weible AP, Weiss C, Disterhoft JF. Activity profiles of single neurons in caudal anterior cingulated cortex during trace eyeblink conditioning in the rabbit. Journal of Neurophysiology. 2003;90(2):599–612. doi: 10.1152/jn.01097.2002. [DOI] [PubMed] [Google Scholar]
- Weible AP, O'Reilly JA, Weiss C, Disterhoft JF. Comparisons of dorsal and ventral hippocampus cornu ammonis region 1 pyramidal neuron activity during trace eye-blink conditioning in the rabbit. Neuroscience. 2006;141:1123–1137. doi: 10.1016/j.neuroscience.2006.04.065. [DOI] [PubMed] [Google Scholar]
- Weiss C, Bouwmeester H, Power JM, Disterhoft JF. Hippocampal lesions prevent trace eyeblink conditioning in the freely moving rat. Behavioral Brain Research. 1999;99(2):123–32. doi: 10.1016/s0166-4328(98)00096-5. [DOI] [PubMed] [Google Scholar]
- Wetzel W, Ohl F, Scheich H. Global versus local processing of frequency-modulated tones in gerbils: an animal model of lateralized auditory cortex functions. PNAS. 2008;105(18):6753–6758. doi: 10.1073/pnas.0707844105. [DOI] [PMC free article] [PubMed] [Google Scholar]
- Woodruff-Pak DS, Disterhoft JD. Where is the trace in trace conditioning? Trends in Neuroscience. 2008;31(2):105–112. doi: 10.1016/j.tins.2007.11.006. [DOI] [PubMed] [Google Scholar]