

Abstract
Cytolytic peptides have commanded attention for their anticancer potential because the membrane-disrupting function that produces cell death is less likely to be overcome by resistant mutations. Congruently, peptides that are involved in molecular recognition and biological activities become attractive therapeutic candidates because of their high specificity, better affinity, reduced immunogenicity, and reduced off target toxicity. However, problems of inadequate delivery, rapid deactivation in vivo, and poor bioavailability have limited clinical application. Therefore, peptide drug development for clinical use requires an appropriate combination of an effective therapeutic peptide and a robust delivery methodology. In this chapter, we describe methods for the postformulation insertion of peptide drugs into lipidic nanostructures, the physical characterization of peptide–nanostructure complexes, and the evaluation of their therapeutic effectiveness both in vitro and in vivo.
1. Introduction
Cytolytic peptides are an attractive class of candidates for anticancer treatment because of their broad spectrum lytic properties (Giuliani et al., 2007; Hancock and Sahl, 2006; Papo and Shai, 2005). They rapidly associate with and integrate into cellular membranes, forming pores that disrupt the membrane. After cellular uptake, they may also attack internal organelles in the same manner to induce cell death. Because of the unlikely development of even multistep cancer cell resistance to this attack on diverse cellular membranes by pore-forming agents, cytolytic peptides have been long recognized as promising candidate agents for cancer therapy. However, the very attributes of nonspecific membrane disruption, in addition to rapid enzymatic degradation in vivo unless protected, has limited their clinical application. Unfortunately, cytolytic peptides manifest profound membrane disruption on traditional lipid bilayer delivery systems, such as liposomes, which also has stymied their use in vivo.
In this chapter, we discuss how this problem of carrier disruption might be avoided with the use of a stable perfluorocarbon (PFC) nanoparticle system for delivery (Soman et al., 2008, 2009). PFC nanoparticles consist of a hydrophobic and lipophobic PFC core surrounded by a lipid surfactant monolayer for stabilization. We have designed a postformulation self-assembling process for peptide insertion, whereby preformulated PFC nanoparticles can accommodate cytolytic peptides in their lipid monolayer without losing their structural integrity (Soman et al., 2008). We discuss the use of melittin, a 26-amino acid, cationic, amphipathic cytolytic peptide to exemplify the methods for postformulation peptide drug loading into PFC nanoparticles. We also discuss methods for evaluating the therapeutic utility of melittin-loaded nanoparticles in vitro and in vivo.
A variety of biologically active peptides might serve as potential activators or inhibitors of important cellular processes if they could be delivered specifically and safely to the correct cellular location. For example, peptide inhibitors that suppress the activation of the NF-κB signaling pathway could be used for anti-inflammatory applications (May et al., 2000), to block DNA replication for anticancer therapy (Warbrick et al., 1995), or to prevent HIV-1 assembly for potential anti-HIV treatment (Sticht et al., 2005). The effective use of such peptides faces the challenge of the rapid protease degradation and limited bioavailability, in large part due to their inability to pass the cell membrane barrier.
Herein, we demonstrate an approach for loading peptide drugs onto a nanostructure based on their fusion to a linker peptide that is modified from the well-studied membrane active peptide, melittin (Dathe and Wieprecht, 1999; DeGrado et al., 1982; Gevod and Birdi, 1984; Werkmeister et al., 1993). We have shown that altering the amino acid sequence of melittin to produce structural changes that reduce the lytic activity from the native melittin allows it to be delivered to cells at much increased concentrations, as compared with melittin, without producing cell death (Pan et al., 2010). Further by separating melittin’s lytic activity from its membrane binding and insertion, we generated a useful “linker peptide,” VLTTGLPALIS-WIKRKRQQ, which retains the property of stable ability of insertion into a lipid mono- or bilayered membrane through a self-assembly process (Pan et al., 2010).
As a demonstration of the potential of this linker strategy, we have conjugated a known peptide that inhibits the NF-κB signaling pathway by interacting with the Nemo-binding domain (NBD) (May et al., 2000), to the N-terminus of the linker peptide. Under normal conditions, NF-κB is sequestered in the cytoplasm as an inactive complex with the inhibitory protein IκB. Upon internal or external stimulation, IκB is phosphorylated by the activated IKK complex, resulting in ubiquitination and degradation of IκB. Consequently, NF-κB becomes free to translocate to the nucleus where it initiates the expression of NF-κB-dependent genes. The NBD inhibitory peptide prevents the activation of the IKK complex; this, in turn, inhibits IκB phosphorylation and subsequently inhibits the nuclear translocation of NF-κB and its dependent gene expression. In this chapter, we describe the methods for generating and characterizing NF-κB inhibitory PFC nanoparticles and experimental procedures for in vitro evaluation.
2. Lipidic Nanostructure Preparation
2.1. Liposome preparation
Liposomes are synthesized using standard protocols. Lipid components themselves are available from a variety of commercial sources and can be mixed to suit specific experimental needs. For liposome preparation, we typically mix chloroform-dissolved lipids to the desired molar ratio and aliquot 10 mg (12–15 μmol) total lipid into glass test tubes. The tubes are then insulated by shallow immersion in a room temperature water bath and organic solvent evaporated under a nitrogen stream. The lipids will then have a glassy appearance on the bottom of the tube. Placing the tubes in a vacuum desiccator for 2 h will remove residual solvent, and the lipid films will no longer appear wet. For storage, lipid tubes can then be flushed with argon, sealed with parafilm, and placed at −20 °C. Dried lipids, however, are much more susceptible to oxidation and should not be stored for more than a few weeks.
To rehydrate dried lipid films and generate multilamellar vesicles (MLVs), 1 ml of a buffered solution is added to the film, and the mixture is vortex mixed vigorously or bath sonicated. Sixty to 120 s should fully resuspend the film and the resulting lipid slurry will have a cloudy appearance. If there are discernable lipid particulates or film remaining on the glass, the vortexing and sonication should be repeated. Next, the suspension is transferred to a plastic microcentrifuge tube, and the tube is first frozen in liquid nitrogen and then thawed in a water bath. Note that each of the nonfreezing vesicle synthesis steps should be above the phase transition of the lipids; in most cases, room temperature will suffice but is nevertheless a parameter to be considered. The freezing and thawing cycle is repeated 10–15 cycles to equilibrate the intravesicular buffer solute with that of the bulk solution. If desired, a portion of the MLV suspension can be left frozen and stored at −80 °C, and preserved for use within 1 month.
Unilamellar vesicles, from 50 to 200 nm in diameter, can then be generated by extrusion of MLVs through appropriate polycarbonate membranes. Nine to 11 passages through the membrane are sufficient to produce a liposome suspension with low polydispersity. Vesicles are stable for 3–4 weeks when stored at 4 °C. Vesicular phospholipid yield can be readily assessed using various methods (Düzgüneş, 2003a; Stewart, 1980).
Liposomes encapsulating fluorescent dyes are standard tools in the investigation of membrane-disrupting compounds. The freeze/thaw vesicle preparation method easily incorporates such an addition simply by adding the fluorophore of choice to the lipid rehydration buffer (Dalla and Menestrina, 2003; Düzgüneş, 2003b). Removal of nonincorporated dye is accomplished via gel filtration chromatography. Small dyes like carboxyfluorescein or calcein can be separated from liposomes by gravity flow columns packed with Sephadex G-25; Sepharose CL-2B can eliminate larger dyes like FITC-conjugated dextran. The useful life span of dye-filled liposomes is 1–2 weeks when stored at 4 °C.
For liposomes to be employed for surface plasmon resonance (SPR) spectroscopy, the rehydration buffer should be identical to the experimental running buffer. This allows more accurate determination of sensor chip-bound lipid mass because the intra- and extravesicular solutions will exhibit the same refractive index. Maintaining identical solutions inside and outside the bound vesicles is especially important when studying compounds that permeabilize bilayers, because vesicle leakage can introduce substantial confounding artifacts to the assay measurements. Liposome size is another parameter that should not be overlooked as some proteins and peptides are responsive to intrinsic bilayer curvature. With regards to SPR, 50 nm small unilamellar vesicles (vs. 100 or 200 nm large unilamellar vesicles) accommodate much greater lipid per unit volume, thus membranous surface binding area within the detection field is maximized. This seeming advantage may be detrimental, however, if the analyte is sensitive to the comparatively large local curvature of 50 nm liposomes.
2.2. Preparation of PFC nanoparticles
PFC nanoparticles consist of a hydrophobic PFC core surrounded by a lipid surfactant monolayer (Lanza et al., 1996). To make PFC nanoparticles, typically, 600 mg lipid/surfactant comixture of phosphatidylcholine (98 mol%) and dipalmitoyl-phosphatidylethanolamine (2 mol%) is used for making 30 ml PFC nanoparticles. However, other lipid components can be added to suit specific experimental needs. The lipid/surfactant mixture is dissolved in chloroform, evaporated under reduced pressure, and dried in a 50 °C vacuum oven overnight, before being dispersed into water by sonication to result in a liposome suspension. After combining with PFC (20%, v/v) and distilled deionized water, the suspension is emulsified for 30–60 s by sonification. The emulsified mixture is then transferred to an S110 Microfluidics emulsifier and continuously processed at 20,000 lbf/in.2 for 4 min in an ice bath. The procedure is sufficient to produce 250 nm hydrodynamic diameter PFC nanoparticles with low-size polydispersity. The PFC nanoparticles are stable for at least 3 months, when stored at 4 °C in stopper crimp-sealed vials (Sigma, St. Louis, MO) and blanketed with nitrogen. To generate functionalized PFC nanoparticles during their formulation, the functional entities, such as imaging agents, drugs, or targeting ligands, first can be conjugated to the lipids with conventional conjugation chemistry to obtain functionalized lipids. Then the desired amount of functionalized lipids can be added into the lipid/surfactant comixture to formulate functionalized PFC nanoparticles.
2.3. Incorporation of peptide drugs into the lipidic nanostructures
In this section, postformulation incorporation of peptide drugs onto lipidic nanostructure PFC nanoparticles or liposomes is outlined. Because of the nonspecific lipid membrane destructive nature of cytolytic peptide agents such as melittin, stable PFC nanoparticles represent a promising carrier for them (Soman et al., 2009, 2008). Melittin-loaded PFC nanoparticles with maximized melittin loading are prepared by mixing 40 μl of 1 mM melittin in the buffer (100 mM KCl in 10 mM HEPES, pH 7) with 50 μl of PFC nanoparticles diluted in 1 ml PBS or 1 ml saline for in vitro or in vivo studies, respectively. The mixture is incubated at room temperature for 10 min. After the incubation, the mixture is washed twice by centrifugation at 100 g for 10 min to remove free melittin in the supernatant.
For peptide drugs that cannot pass through the cell membrane, such as the NF-κB signaling pathway inhibitory peptide, NBD inhibitory peptide (May et al., 2000), they need first to be conjugated onto the linker peptide with an intervening spacer, such as two glycines between linker peptide and peptide drug, which could be done by using solid-phase peptide synthesis. To deliver NBD inhibitory peptides with nano-particles, we conjugated the NBD inhibitory peptide onto the N-terminus of the peptide linker with two glycines interposed as a spacer (Pan et al., 2011). Customized peptides can be ordered from commercial sources, or synthesized in house by using a peptide synthesizer (Model: CS136, CS Bio Co, Menlo Park, CA) through solid-phase peptide synthesis. To generate NF-κB inhibitory PFC nanoparticles with different amounts of drug loading, 0.5–45 μl of 2 mM NBD–linker, prepared in MilliQ H2O, is mixed with 30 μl of PFC nanoparticles. The mixture is incubated at 4 °C overnight, before washing twice and centrifuging at 100 × g for 10 min to remove free peptides. For incorporation of the peptide drug complexes into liposomes using the peptide linker strategy, the suggested maximum peptide: lipid ratio is 1:40. At this ratio, the engineered linker peptide produces no liposome bilayer disruption and liposome contents are retained encapsulated. After overnight incubation at 4 °C, any free peptide can be separated from peptide drug-loaded liposomes by gravity flow columns packed with Sephadex G-25.
It is important to note that this postformulation loading of peptide drugs on the lipidic nanostructures is governed by the interaction between an amphipathic cationic peptide and the lipid membrane. Therefore, several parameters, such as the lipid composition, size of the nanostructure, the concentration of the peptide drug, the ionic strength of the mixture, and incubation temperature and duration, should be optimized for each specific application.
3. Physical Characterization of the Peptide Drug-Loaded Nanostructure
3.1. Particle size measurements
The hydrodynamic size distribution of the peptide drug-loaded nanostructures can be analyzed with dynamic light scattering (DLS). DLS is also referred to as Quasi-Elastic Light Scattering or Photon Correlation Spectroscopy. This analysis is typically performed at room temperature by diluting samples (1–2.5%, v/v) in the filtered buffer that is used for making the base nanostructures. The filter pore size is 0.2 μm. Nanoparticles in dispersions undergo constant Brownian motion, which results in time-dependent fluctuation of scattered light intensity. DLS instruments calculate the autocorrelation of the scattering fluctuations for monodisperse samples by using Eq. (2.1):
| (2.1) |
where G is the correlation function, A is the baseline, B is the intercept, D is the translational diffusion coefficient, which represents the particle size, τ is the delay time, and q is described in Eq. (2.2),
| (2.2) |
where n is the dispersant refractive index, λ0 is the laser wavelength, and θ is the scattering angle.
For polydisperse samples, the calculation is done by using Eq. (2.3)
| (2.3) |
where g(τ) is the sum of all the exponential components in the autocorrelation function.
For single scattering species, autocorrelation of the scattered light intensity is determined by the particle size. The smaller the particles, the faster the Brownian motion is. Therefore, the autocorrelation of small particles displays a shorter lag time. The correlogram generated by the DLS instrument is used in combination with medium ionic strength, temperature, viscosity, refractive index, and particle geometry to calculate the mean hydrodynamic size or the size distribution. For postformulation modification of lipidic particles, DLS can be used to monitor particle size or particle disruption which would indicate important changes in size distribution or disruption of the lipidic carrier platform. Our DLS hydrodynamic size measurements of the particles are acquired using a Brookhaven Instruments PALS Zeta Potential Analyzer (Brookhaven Instruments Corp., Holtsville, NY).
3.2. Zeta potential measurements
Zeta potential represents the surface charge of nanoparticles and reflects their long-term stability. Based on DVLO theory, developed by Derjaguin, Verwey, Landau, and Overbeek in the 1940s, the stability of particles in suspension depends on the total potential energy function VT as described in Eq. (2.4):
| (2.4) |
where VA is the attractive energy from van der Waals interactions, VR is the repulsive force from the electrical double layer of particles, when they are brought close by Brownian motion, respectively, and VS stands for the potential energy from the solvent. VA and VR, described in Eqs. (2.5) and (2.6), respectively, play much more important roles than VS.
| (2.5) |
where A is the Hamaker constant and D is the distance between particles.
| (2.6) |
Where ε is the dielectric constant, a is the radius of the particle, π is the solvent permeability, ζ is the zeta potential, and κ represents the ionic composition.
Therefore, the larger the zeta potential, the greater the repulsive force and the more stable the particle suspension system. The zeta potential measurement is acquired by using a Brookhaven Instruments PALS Zeta Potential Analyzer (Brookhaven Instruments Corp.). Zeta potential data are collected in the phase-analysis light scattering (PALS) mode, in which a laser light illuminates the particles in an electric field, and the scattered light is compared with a reference laser light for phase difference. This technique analyzes the scattered light phase shift from particle movements. The phase shift then can be used to determine electrophoretic mobility. The Smoluchowski approximation is used to calculate the zeta potential (ζ) from the measured electrophoretic mobility (μ) of the samples by using Eq. (2.7):
| (2.7) |
where ε is the dielectric constant and η is the absolute viscosity of the medium.
For all our measurements, the temperature of the diluted nanoparticle sample is equilibrated at 25 °C and the measurement pH is 7.
3.3. Morphology and integrity of the peptide drug-loaded nanostructure by electron microscopy
The morphology and integrity of the peptide drug-loaded nanostructure can be visualized by electron microscopy (Pan et al., 2010; Soman et al., 2008). For peptide-loaded PFC nanoparticles, fixation in 2.5% glutaraldehyde in PBS for 30 min on ice is carried out followed by spinning at top speed in a microcentrifuge for 15 min to obtain a pellet. After rinsing once in PBS and twice in 0.1 M sodium cacodylate, the particles are sequentially stained in 1.25% osmium tetroxide, 2% tannic acid, and 4% uranyl acetate for 1 h each at room temperature. In between the osmium tetroxide and tannic acid, samples are rinsed with the sodium cacodylate buffer three times. In between the tannic acid and the uranyl acetate, the samples are rinsed twice in sodium cacodylate and once in 15% ethanol. After the staining, tissue is dehydrated through 50%, 75%, and 95% ethanol for 5 min each, followed by 100% ethanol four times, 5 min each. The sample is then rinsed twice in propylene oxide 15 min each and left in propylene oxide/Polybed 812 1:1 overnight while rotating on a tube rotator. Samples are transferred into pure Polybed 812 (Polysciences Inc., Warrington, PA), placed in a desiccator for 24 h and baked for 48 h at 60 °C. The embedded tissue is thin-sectioned by an ultramicrotome, poststained in uranyl acetate and lead citrate, viewed on a transmission electron microscope, and images are recorded with a high-resolution digital camera.
For the liposome samples, negative staining can be applied. Nickel mesh grids that are formvar and carbon coated are rendered hydrophilic by glow discharging. Liposomes mixed with peptide drug are incubated with the grids for 1 min, gently blotted on filter paper, rinsed twice in distilled water, blotted again, and then stained with 1% uranyl acetate for 1 min. After the grids are blotted and air dried, the samples are ready to be viewed by transmission electron microscopy.
3.4. Quantifying peptide drug loading
When the peptide or protein contains aromatic residues, such as tryptophan, tyrosine, or phenylalanine, they will exhibit detectable intrinsic fluorescence. In the linear range, the fluorescence intensity reflects the peptide concentration. Melittin and linker peptides have such a tryptophan residue. Therefore, quantification of peptide drug loading can be performed by measuring the tryptophan fluorescence intensity. To determine peptide drug loading, we measure the amount of unloaded peptide, which remains in the supernatant from each centrifugation. A fluorescent spectrofluorometer (Varian, Inc., Palo Alto, CA) is used to measure the tryptophan fluorescence emission at 350 nm after being excited at 280 nm. The measured fluorescence intensity is converted to the amount of peptide by utilizing a standard curve, which is generated by preparing peptide aliquots of known concentrations. Therefore, the amount of loaded peptide is calculated in Eq. (2.8):
| (2.8) |
where Pl represents the amount of peptide loaded, Pt represents the total amount of peptide used for loading, and Pu represents the amount of unloaded peptide remaining.
Peptide drug quantification is also routinely performed by analytic HPLC. To quantify the amount of peptide drug loaded onto PFC nano-particles by analytic HPLC, we crack the PFC nanoparticles by adding a 2× volume of isopropyl alcohol (IPA) followed with vigorous mixing. After mixing, a PFC droplet can be observed on the bottom of the tube, which confirms the separation of the nanoparticle components. The tube is then placed in a 40 °C water bath and dried under a N2 stream. The drying time depends on the starting volume. After the sample is dried completely, a desired volume of IPA/H2O (1:1) is added into the tube followed with vigorously vortexing. The samples, along with standards, are then transferred to autosampler vials and loaded into the analytic HPLC system.
Analytic HPLC methods can be designed based on preparative HPLC methods. To develop a robust analytic HPLC method, it is useful to start with an aged HPLC column for initial HPLC method development, especially when there are more than one peptide drugs in the sample, because it is more difficult to achieve the desired resolution with aged columns than with newer ones. Aged columns are ones that have experienced more than 200 injections. With a robust analytic HPLC method, the peptide drugs in the samples are quantified by comparison against a standard curve. The concentration of the samples should be in the linear region of the standard curve. For a peptide drug that manifests intrinsic fluorescence (e.g., tryptophan), the fluorescence detection option can be used to increase HPLC sensitivity.
3.5. Analysis of peptide drug loading into lipidic nanostructures by fluorescence correlation spectroscopy
Fluorescence correlation spectroscopy (FCS) is a quantitative technique that reports fluctuations of fluorescence intensity as fluorescent molecules pass through a small observation volume (<1 femtoliter) (Bacia and Schwille, 2007). Statistical analysis of the temporal fluctuations of fluorescence intensity allows for the simultaneous determination of the mobility and the number of fluorescent species in the observation volume. After loading of the fluorescently labeled peptide drug onto the nanostructure, the mobility of the fluorescently labeled peptide drug will decrease, because the nano-particles to which it is now attached move slower than the free fluorescent molecules (Pan et al., 2011). This decrease in mobility of free and bound to the nanoparticles fluorescently labeled peptides together with their particle numbers is used to determine the apparent binding constant of peptide to nanoparticles.
Equipment for FCS measurements comprises an LSM 510 ConFocor 2 system and a Zeiss Axiovert 200 M inverted microscope (Zeiss, Germany). A water immersion C-Apochromat 40× objective (Zeiss) is employed to focus the excitation light to a diffraction-limited spot. An LP530-nm filter is placed in front of the detector. The pinhole size is set at 70 μm for a 25-mW 488 nm excitation laser light, which is set at 1% of the acousto-optical tunable transmission. The sample is placed in a Lab-Tek observation chamber (Fisher Scientific, Pittsburgh, PA) for the FCS measurements. Each sample is measured for 50 s at least nine times for data analysis. Free Alexa Fluor-488 in solution is used to calibrate the detection volume, which is defined by the focal volume of a laser scanning microscope, and the autocorrelation of the fluorescence intensity is calculated using Eq. (2.9):
| (2.9) |
where G is the autocorrelation function, F is the time dependence of the fluorescence intensity, τ is the correlation time and the angular brackets refer to time averaging, and δF(t) = F(t) − 〈F(t)〉
The correlation curve obtained from the experiment is fitted with Eq. (2.10) that describes the fluorescence intensity fluctuations due to the Brownian diffusion of the fluorescent molecules in the observation volume and also accounts for the photophysical characteristics of the fluorescent molecules:
| (2.10) |
where N is the average number of fluorescent particles in the observation volume, T is the fraction of fluorophores in the triplet state, τT is the lifetime of the triplet state of the fluorophore, τD is the characteristic diffusion time of the fluorophore, and ω0 is the waist radius of the laser focus. The structural parameter S = ωz/ω0 measures the aspect ratio of the observation volume, which is assumed to have a Gaussian shape. The diffusion time τD is related to the diffusion coefficient D through the expression described in Eq. (2.11):
| (2.11) |
The waist of the focus ω0 is determined by fitting the autocorrelation curve obtained from free Alexa Fluor 488 measured under the same experimental parameters. Parenthetically, the evaluation of binding of fluorescently labeled peptides to nanoparticles studied by FCS is especially interesting, because it does not require the separation of the bound and free fluorescent peptide species due to the marked differences in their mobility measured directly and noninvasively by FCS. Therefore, FCS can be used to directly evaluate the equilibrium binding of the fluorescently labeled peptide to lipidic particles as well as equilibrium binding of these fluorescent particles to the membranes of giant unilamellar vesicles, and possibly live cells.
3.6. Evaluation of peptide drug-nanostructure insertion by SPR
The insertion of the peptide drug into the lipid membrane of the nanostructures can be studied by using SPR, which detects changes in the reflective index of a surface (Pan et al., 2011; Soman et al., 2008). The Biacore-X 100 and a carboxymethylated dextran chip L1 (Biacore Inc., Piscataway, NJ) are used to study the insertion. The L1 sensor chip is designed to capture lipidic vesicles. On the L1 sensor chip, there are no anchoring molecules and the structure of the lipidic vesicle is maintained. Prior to the experiments, the L1 sensor chip needs to be equilibrated by priming the system 3–4 times with running buffer, which needs to be prefiltered through a 0.22-μm filter before use. PFC nanoparticles at a concentration of 3 mM, or liposomes at a phospholipid concentration of 0.6 mg/ml are injected at 3 μl/min for 30 min or 12 min, respectively. Loosely deposited nanoparticles or liposomes should be removed by performing extra washing at 100 μl/min for 30 s after immobilization to ensure a stable baseline. Complete coverage of the sensor chip by the nanostructures can be confirmed by injecting bovine serum albumin (1 mg/ml in running buffer) at 15 μl/min for 2 min. Different peptides in selected concentrations are then injected at a flow rate of 30 μl/min for 1 min, followed by washing for 1–24 h. At the end of each experiment, the L1 sensor chip will be regenerated by two consecutive injections of 3-[(3-cholamidopropyl)dimethylammonio]-1-propanesulfonate, CHAPS, at a flow rate of 100 μl/min for 30 s. The data can be analyzed with BiaEvaluation software (Biacore Inc.,). A two-state model, described in Eq. (2.12), is used for curve fitting.
| (2.12) |
where P and L represent the peptide and lipid membrane of lipidic nanostructures, respectively; and PL and PL★ represent the electrostatic and the hydrophobic interaction between the peptide and lipid membrane, respectively. In this model, the rate constant ka1 has the unit 1/M s, as it represents a second-order reaction; the rate constants kd1, ka2, kd2 have the units 1/s, being first-order reactions (M, molarity or mol/l; s, seconds). The SPR can directly evaluate the dissociation of the peptide from the immobilized lipidic structure, which provides an estimate of its stability. In addition, the SPR is configured as a high-throughput assay and can speed development when a larger variety of peptides are of interest.
3.7. Verification of peptide drug-nanostructure integration by circular dichroism spectroscopy
Circular dichroism (CD) is commonly used to investigate the secondary structure of proteins and peptides. The CD spectra of peptides with unordered structure/random coil exhibit a strong negative peak just below 200 nm and a positive peak, or a negative shoulder, between 220 and 230 nm. The CD spectra of an α-helical secondary structure exhibits a positive peak near 190 nm and two negative peaks around 205 and 222 nm. For β-sheet structures, CD spectra exhibit one negative peak around 215 nm and a positive peak near 198 nm (Fasman, 1996). When melittin or the peptide linker–drug complex insert into the lipid membrane of the nanostructure, they form α-helical secondary structures that can be detected by using CD spectroscopy (Pan et al., 2011; Soman et al., 2008).
CD spectra are measured using a Jasco J-810 spectropolarimeter (Jasco Inc., Eastern, MD). Before turning on the lamp, the instrument is flushed with N2 at a flow rate of 20 for 5 min. A 1 mm path length, quartz cuvette is used to hold the samples. In our case, samples are diluted in 10 mM potassium phosphate buffer (pH 7.0) with a dilution factor of 1:30. When inserting the cuvette into the sample chamber, the door is opened as little as possible. The system should always be flushed with N2 for 2 min before the measurements. Spectra are scanned under continuous scanning mode at a scan rate of 100 nm/min across the wavelength range from 190 to 260 nm. About 10–20 scans are used (Pan et al., 2011; Soman et al., 2008). Besides the CD signal, the Photomultiplier tube (PMT) voltage should always be monitored. If the voltage is great or equal to 800 V, the corresponding spectrum will become unreliable. There are several ways to lower the PMT voltage, such as increasing the N2 flow rate, diluting the sample further, and using a cuvette with a shorter path length.
4. Assessment of Cellular Delivery and Bioactivity In Vitro
4.1. Carboxyfluorescein dequenching assay to illustrate cellular delivery by using lipid bilayer model system
Carboxyfluorescein encapsulating liposomes can be used as a model system to evaluate the pore-forming activity of melittin in cells. Encapsulated carboxyfluorescein exhibits fluorescence self-quenching. Upon the release from the liposomes, the fluorescence intensity will increase. Therefore, the kinetics of melittin membrane pore formation can be assessed by measuring the changes in carboxyfluorescein fluorescence intensity, by using a Cary Eclipse spectrofluorometer (Varian, Inc.). The excitation and emission wavelengths are 497 and 520 nm, respectively. Carboxyfluorescein fluorescence dequenching as function of time is described in Eq. (2.13) (Rex and Schwarz, 1998).
| (2.13) |
where F520, t represents the fluorescence intensity measured at 520 nm at time point, t, F0 represents the fluorescence intensity measured at time zero, A1 is the amplitude of the exponential component, τ represents the dequenching time constant, and m represents the slope of the linear component.
A baseline fluorescence reading of carboxyfluorescein encapsulated in liposomes is measured before adding melittin-loaded PFC nanoparticles at various concentrations. Addition of Triton X is used to confirm complete carboxyfluorescein release. Melittin pore-forming kinetics are defined by τ and A1, which are determined by applying the Levenberg–Marquardt algorithm for nonlinear least squares analysis on fitting the acquired fluorescent intensity changes overtime (Soman et al., 2008). Activity of nanoparticle-loaded melittin on liposomes is illustrated in Fig. 2.1.
Figure 2.1.

Activity of nanoparticle-bound melittin on liposomes. (A) A comparison of pore activation by melittin transferred to liposomes from solution or from the surface of nanoparticles measured by dequenching times due to release of carboxyfluorescein from liposome core. Black circles are pore activation from 200 nM free melittin, t1/2 2.8 s. Red squares are pore activation from the 200 nM melittin bound to 40 mg of nanoparticles, t1/2 21 s. Green squares are pore activation by melittin transferred to liposomes from 20 mg nanoparticles with 200 nM melittin, t1/2 58 s. Also shown is the fluorescence dequenching in the presence of the nanoparticles without melittin (pink) and the dequenching of incubated liposomes (black line). See text for the interpretation of the melittin kinetics. (B) The concentration dependence of melittin as a function of the ratio of melittin to lipid versus the halftime for dequenching. (C) Schematic of the proposed hemifusion model between a nanoparticle and a liposome. The continuity of the emulsion monolayer and the outer leaflet of the liposome permit the transfer of cargo from the PFC nanoparticle to the bilayer membrane leading to formation of a pore and subsequent release of carboxyfluorescein from the liposome core. (Reprinted with permission from Soman et al., 2008.)
4.2. Confocal microscopy to visualize cellular uptake of peptide drug delivered by nanostructures
To visualize cellular delivery of the peptide drug melittin, we label melittin with the fluorescent molecule, fluorescein isothiocyanate (FITC). The fluorescence-labeled peptide can be prepared with a FluoroTag FITC Kit (Sigma-Aldrich, St. Louis, MO) (Soman et al., 2009). Cells are cultured on the 0.17 mm Delta TPG Dish (Bioptechs Inc., Butler, PA) with 1 ml of cell culture medium. FITC-melittin-loaded αγβ3-integrin targeted or nontargeted PFC nanoparticles (1 μl) are incubated with C32 cells for 1 h at 37 °C. After the incubation, to remove unbound nanoparticles, cells are washed five times with PBS, by shaking at 200 rpm on a shaker for 5 min each. Then, the cells are fixed in 1 ml of 4% paraformaldehyde by incubating at 37 °C for 5 min, followed by five times washing with PBS. Cells should be protected from direct light before visualization with a confocal microscope (Zeiss Meta 510, Thornwood, NY) with the use of standard filter sets. Concomitant differential interference contrast imaging is used to define the cell outlines. To spatially delineate melittin cellular uptake in 3D, Z-stack images are acquired. The T3D package in NOEsys (Research Systems, Inc., Boulder, CO) is used for image reconstruction.
4.3. Hemolysis assay to evaluate biosafety in vitro
The off target side effects of melittin-loaded PFC nanoparticles can be evaluated by using red blood cells (RBCs), because it is known that free melittin rapidly induces hemolysis (Soman et al., 2009). The RBCscan be separated from the blood by using Ficoll-Paque™ PREMIUM (GE Health-care, Piscataway, NJ). The blood supplemented with anticoagulants should be used within 8 h. The blood is diluted two- to fourfold with saline and is carefully layered on top of Ficoll. The volume ratio of diluted blood and Ficoll is 7:5. The mixture is centrifuged at 400 × g for 30 min at 4 °C in a swinging bucket. After the centrifugation, RBCs come to rest at the bottom of the tube. Isolated RBCs are then washed three times in saline by centrifugation at 400 × g for 30 min and resuspended in saline to obtain an approximately constant 5 × 10⁵ cells for each test. For negative and positive controls, RBCs in PBS (Ablank) and in 0.1% Triton X-100 (Atriton) are used, respectively. Treatments are performed incubating RBCs with various amounts of melittin-loaded PFC nanoparticles at 37 °C for 3 h (Soman et al., 2009). After the treatment, samples are centrifuged at 100 × g for 10 min. The supernatants are loaded into a 96-well plate with 100 μl/well for absorbance measurements at 540 nm using a microplate reader (Bio-Rad, Hercules, CA). The percentage of hemolysis is calculated according to Eq. (2.14):
| (2.14) |
4.4. Transcription factor assay to evaluate the inhibition of nuclear translocation of NF-κB protein
Under normal conditions, NF-κB is sequestered in the cytoplasm as an inactive complex with the inhibitory protein IκB. Activation of the IKK complex leads to IκB phosphorylation, which causes ubiquitination and degradation of IκB. Consequently, NF-κB proteins are free to translocate to the nucleus to initiate the expression of NF-κB-dependent genes. The NBD inhibitory peptide prevents the activation of the IKK complex, which then inhibits IκB phosphorylation and sequentially inhibits NF-κB nuclear translocation and NF-κB-dependent gene expression (May et al., 2000). To evaluate the inhibition of NF-κB protein nuclear translocation, as an example, we treat F8 cells with NF-κB inhibitory PFC nanoparticles produced by the incorporation of a NBD–linker peptide complex into the PFC nanoparticles as described in Section 2.3. The F8 cells, a leukemia/lymphoma cell line, are generated from a large granular lymphocytic leukemia transgenic mice model (Grossman et al., 1995) and manifest constitutive NF-κB activation (Bernal-Mizrachi et al., 2006). F8 cells are seeded in T-25 flasks at 2 × 10⁶ per flask and incubated overnight in a humidified atmosphere of 95% air and 5% CO2 in cell culture medium: RPMI, 10% FBS, 4 mM glutamine, and 100 U penicillin/100 μg/ml streptomycin. The cells are then treated with NF-κB inhibitory PFC nanoparticles or control PFC nanoparticles at various concentrations for 8 h before the extraction of the nuclear protein fraction. Control PFC nanoparticles are generated by loading a mutated version of the NBD peptide onto the PFC nanoparticles using the same postformulation method. The nuclear protein fraction can be extracted with a nuclear extract kit (Active Motif, Carlsbad, CA). To prevent protein degradation, all procedures should be performed at 4 °C or on ice, and all the tubes should be prechilled on ice. To ensure the complete suspension of the nuclear pellet in complete lysis buffer, we employ sonication in an ice bath. After the protein extraction, the protein concentration is measured with a Pierce® BCA Protein Assay Kit (Pierce Biotechnology, Rockford, IL). Normally, 1:10 diluted protein fraction is used for the concentration measurement.
Four methods could be used to assess NF-κB activation: Western blot, electrophoretic mobility shift assay, reporter gene assays (e.g., luciferase), and ELISA. Here, we use the ELISA assay to directly evaluate nuclear p65. Normally, 2–20 μg of the total nuclear protein fraction is used to measure nuclear NF-κB proteins. For F8 cells, 10 μg of the total nuclear protein fraction is used to evaluate the nuclear NF-κB protein, p65, by using the TransAM™ NF-κB p65 Transcription Fact Assay Kit (Active Motif) (Pan et al., 2011). A standard curve can be generated from recombinant p65 proteins with known concentrations and used for quantification. At least two wells each need to be prepared for positive and negative controls. The positive control is the Jurkat cell nuclear extract, which is important for troubleshooting when there is a weak or no signal. The negative control is the complete lysis buffer, which will provide information such as whether the antibody needs to be further diluted or if wells are washed thoroughly.
Positive controls, negative controls, and samples are first incubated with DNA that contains an NF-κB consensus sequence. This incubation can be done at room temperature with agitation for 1 h or at 4 °C overnight without agitation. After three washes, primary antibody (1:1000 dilution) is added into each testing well (100 μl/well), followed by incubation at room temperature for 1 h without agitation. The wells are washed three times again, before addition of secondary antibody (1:1000 dilution; 100 μl/well). The developing solution is brought to room temperature, and the 1 h secondary antibody incubation is started. After the secondary antibody incubation, the plate is washed four times before adding the developing solution (100 μl/well). Between each wash, the plate is blotted gently on absorption tissue. The development is observed closely, and the reaction is stopped by adding the stop solution (100 μl/well) when the color turns from medium blue to dark blue. The inhibition of p65 translocation by NF-κB inhibitory PFC nanoparticles occurs in a dose-dependent manner, which is presented in Fig. 2.2.
Figure 2.2.
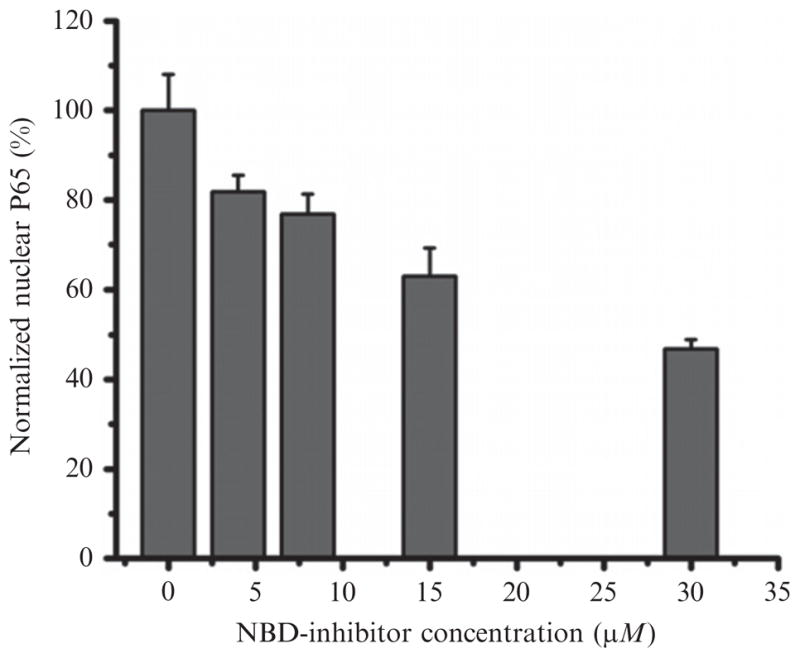
Inhibition of NF-κB signaling pathway by NBD–linker incorporated PFC nanoparticles (NF-κB inhibitory PFC NPs). NF-κB inhibitory PFC NPs inhibit NF-κB protein (P65) translocation into the nucleus in a dose-dependent fashion. Data presented as mean ± SD (n = 3). (Reprinted with permission from Pan et al., 2011.)
4.5. Flow cytometry to define the expression of the NF-κB-dependent gene, ICAM-1
Flow cytometry measures the physical properties of individual particles or cells ranging from 500 nm to 40 μm in diameter by analyzing the light scattered and/or emitted from the particles or cells when they pass through a laser beam. In the flow cytometer, the hydrodynamic force from sheath flow centers the cells in a thin stream and passes one cell at a time through the laser beam at a flow rate of thousands of cells per minute. Therefore, the fluorescence from a single cell can be evaluated. Forward scatter (FSc) provides information on the cell size. Side scatter (SSc), also known as orthogonal scatter, represents the cell “complexity/granularity.” Both FSc and SSc are used typically to identify cells for their fluorescence signature measurements.
To exemplify NF-κB-dependent gene (ICAM-1) expression, cells with or without NF-κB inhibitory PFC nanoparticle treatments for 9.5 h are stained with FITC-conjugated hamster antimouse CD54 (i.e., ICAM antibody) (BD Pharmingen, San Jose, CA) for flow cytometry analysis. For staining, 1 × 10⁶ cells are used in each sample. Cells are washed three times in 3 ml incubation buffer, HBSS, 2% FBS, and 1 mM EDTA, by centrifugation at 1000 rpm for 5 min in a countertop centrifuge. After the third wash, cells are resuspended in 100 μl incubation buffer for 10 min and then incubated with FITC-labeled hamster antimouse CD54 antibody for 1 h on ice and protected from light. FITC hamster IgG1 κ isotype (BD Pharmingen) (1:1000 dilution) is used as a control. After staining, cells are washed five times and resuspended in incubation buffer before flow cytometry analysis, using a CyAn™ ADP analyzer (Beckman Coulter, Carpinteria, CA). Cells are gated by FSc and SSc from a total of 50,000 recorded events. Summit™ Software provided with the instrument is used for data analysis.
5. Assessment of Therapeutic Intervention In Vivo
Therapeutic intervention with peptide drugs packaged in the nano-delivery system can also be verified in vivo. The methods for evaluating therapeutic intervention will be specific for each application. One commonly used approach is to visualize the changes in the tissue of interest by histological and immunohistochemical assessment. We suggest reviewing the comprehensive text, Histological and Histochemical Methods: Theory and Practice (Kiernan, 2008), for detailed methods and techniques.
For investigating the therapeutic efficacy of anticancer treatments, tumor growth inhibition is one of the most important readouts. In Fig. 2.3, the anticancer effect of melittin-loaded PFC nanoparticles is verified by histology/immunohistochemistry and with tumor growth inhibition readouts. The tumor growth inhibition is evaluated by noninvasive ultrasound measurements for monitoring tumor growth in vivo. The methods for ultrasound measurement are described below.
Figure 2.3.

Therapeutic efficacy of melittin-loaded nanoparticles in syngeneic B16F10 mouse melanoma tumors. (A) Graph showing the increase in tumor volume of B16F10 melanoma tumors during the course of treatment with melittin-loaded nano-particles (8.5 mg/kg) or controls (saline or nanoparticles alone; n = 5 each group). Note the dramatic difference in tumor volume at day 14 after four doses of melittin-loaded nanoparticles. Data are represented as mean ± SD. ★★P < 0.01. (B) Histological assessment of B16F10 melanoma tumors excised at day 14. Note the extensive nonproliferating dead areas in the treated tumors along with the markedly decreased vascularity. Arrows indicate blood vessels in the H&E and CD31 photographs and dead areas in the BrdU photographs. (Reprinted with permission from Soman et al., 2009.)
Tumor growth can be noninvasively monitored in vivo by transcutaneous imaging with commercially available high-frequency ultrasound systems. Depending on tumor size, at least two ultrasound systems are applicable. Each has a specific tumor size range over which imaging is optimal. For tumors less than approximately 1 cm in diameter, a high-frequency, mechanically scanned, single-element imaging system is employed (Vevo 660, VisualSonics, Toronto, Ontario, Canada); a less expensive but effective linear array system (Spark High-Frequency Imaging System, Ardent Sound, Mesa, AZ) can be used to image somewhat larger tumors. Probes used for the Vevo system are RMV-703 (35 MHz, 10 mm focus, 4 mm diameter) and RMV-704 (40 MHz, 6 mm focus, 3 mm diameter). The Spark system is paired with a high-frequency (nominal 14–23 MHz, 128-element, 0.205 mm pitch) linear array with user-selectable focal zone placement. Both systems are modified to output analog radiofrequency (RF) data (beam-formed A-lines for the Spark system) and associated trigger signals, to permit digitization of the raw RF waveforms to acquire backscatter data from the mouse tumors. Waveforms from the Vevo system are digitized at 400 MHz with a 12-bit digitizer (Compuscope 12400, Gage Applied Technologies, Lockport, IL) and stored for offline analysis. Waveforms from the Spark system are similarly acquired but digitized at the system’s internal clock rate of 66.667 MHz. Although RF data have been recorded and used in our analyses, the image data itself displayed by either device can also be used to map the tumor locations and dimensions.
Prior to scanning, each animal is anesthetized and the area around the tumor is shaved and depilated. The transducer probes are affixed to a motorized gantry under computer control to enable automated scanning of the probe across the length of the tumor. Each anesthetized animal is placed on its back on a heated platform beneath the probe, and a small amount of ultrasound coupling gel is applied to the area proximal to the tumor. The probe is positioned so that the central area of the tumor is situated in the focal region of the transducer. RF data corresponding to cross-sectional views of the tumor are acquired at multiple sites along the length of the tumor so that the entire tumor volume is interrogated. The probe is translated laterally (perpendicular to the transducer’s imaging plane) in 100-μm steps between each scan plane acquisition. Subsequent to acquisition, the backscattered energy of each RF waveform (defined as the sum of the squared digitized voltage values in a center-weighted sliding window) is computed and used to create gray-scale images. As mentioned above, the direct image output from the device can also be used analogously for processing. All computation, image reconstruction, and image analysis are performed using custom Java plugins written for the open-source image analysis package ImageJ (W. S. Rasband, U. S. National Institutes of Health, Bethesda, MD, imagej.nih.gov/ij/, 1997–2011). User-specified regions of interest (ROI’s) are drawn on each image frame, and the area of the ROI measured. The areas of the ROI’s are multiplied by the distance between scan planes to yield subvolumes, which are summed to compute the entire tumor volume. Figure 2.4 shows a representative ultrasound in vivo image of a B16F10 melanoma tumor in the mouse inguinal region.
Figure 2.4.
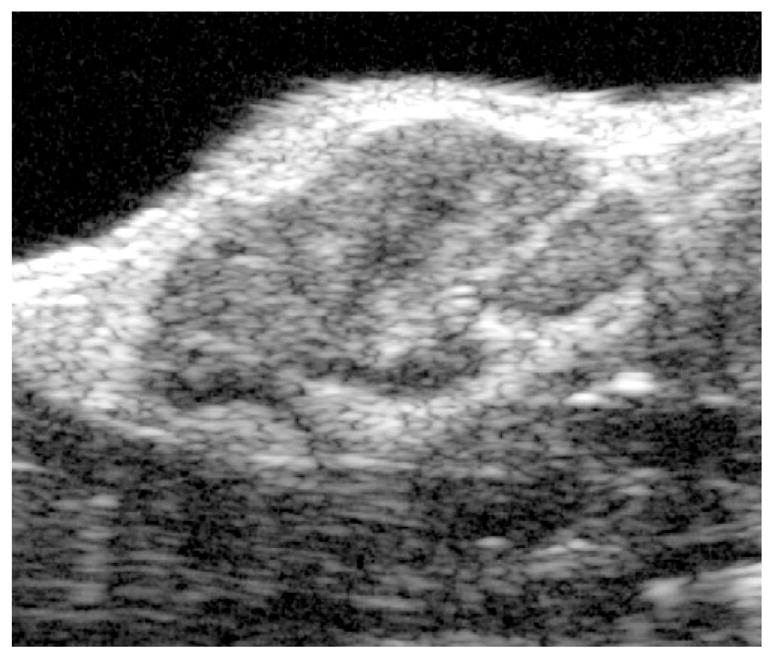
Representative ultrasound in vivo visualization of B16F10 subcutaneous melanoma tumor in mouse inguinal region illustrating complex internal architecture of growing tumor mass. (Reprinted with permission from Pan et al., 2010.)
6. Conclusions
The advantages and potential of peptide drugs have long been recognized. However, rapid enzymatic degradation in vivo, poor bioavailability, and potential off target effects of free agents have limited their clinical application. To overcome these hurdles, development of effective packaging/delivery systems is highlighted in this methodological chapter of peptide drug formulation. A major challenge in formulating such peptide drugs into delivery systems is the preservation of drug activity throughout the formulation procedures. The postformulation peptide drug loading strategy described herein enables the addition of therapeutic peptides into the nanostructures after their formulation. Thus, peptide drug(s) may be loaded onto nanostructures in a simple mixing step to avoid harsh formulation steps, which should also facilitate sterile preparation of such compounds. These peptide postformulation strategies, in conjunction with targeted lipidic nanostructure delivery systems, exemplify a promising method for peptide drug deployment.
References
- Bacia K, Schwille P. Fluorescence correlation spectroscopy. Methods Mol Biol. 2007;398:73–84. doi: 10.1007/978-1-59745-513-8_7. [DOI] [PubMed] [Google Scholar]
- Bernal-Mizrachi L, Lovly CM, Ratner L. The role of NF-κB-1 and NF-κB-2-mediated resistance to apoptosis in lymphomas. Proc Natl Acad Sci USA. 2006;103:9220–9225. doi: 10.1073/pnas.0507809103. [DOI] [PMC free article] [PubMed] [Google Scholar]
- Dalla Serra M, Menestrina G. Liposomes in the study of pore-forming toxins. Methods Enzymol. 2003;372:99–133. doi: 10.1016/s0076-6879(03)72006-0. [DOI] [PubMed] [Google Scholar]
- Dathe M, Wieprecht T. Structural features of helical antimicrobial peptides: Their potential to modulate activity on model membranes and biological cells. Biochim Biophys Acta. 1999;1462:71–87. doi: 10.1016/s0005-2736(99)00201-1. [DOI] [PubMed] [Google Scholar]
- DeGrado WF, Musso GF, Lieber M, Kaiser ET, Kezdy FJ. Kinetics and mechanism of hemolysis induced by melittin and by a synthetic melittin analogue. Biophys J. 1982;37:329–338. doi: 10.1016/S0006-3495(82)84681-X. [DOI] [PMC free article] [PubMed] [Google Scholar]
- Düzgüneş N. Preparation and quantitation of small unilamellar liposomes and large unilamellar reverse-phase evaporation liposomes. Methods Enzymol. 2003a;367:23–27. doi: 10.1016/S0076-6879(03)67003-5. [DOI] [PubMed] [Google Scholar]
- Düzgüneş N. Fluorescence assays for liposome fusion. Methods Enzymol. 2003b;372:260–274. doi: 10.1016/S0076-6879(03)72015-1. [DOI] [PubMed] [Google Scholar]
- Fasman GD, editor. Circular Dichroism and the Conformational Analysis of Biomolecules. Plenum Press; New York, London: 1996. [Google Scholar]
- Gevod VS, Birdi KS. Melittin and the 8–26 fragment. Differences in ionophoric properties as measured by monolayer method. Biophys J. 1984;45:1079–1083. doi: 10.1016/S0006-3495(84)84255-1. [DOI] [PMC free article] [PubMed] [Google Scholar]
- Giuliani A, Pirri G, Nicoletto S. Antimicrobial peptides: An overview of a promising class of therapeutics. Cent Eur J Biol. 2007;2:1–33. [Google Scholar]
- Grossman WJ, Kimata JT, Wong FH, Zutter M, Ley TJ, Ratner L. Development of leukemia in mice transgenic for the tax gene of human T-cell leukemia virus type I. Proc Natl Acad Sci USA. 1995;92:1057–1061. doi: 10.1073/pnas.92.4.1057. [DOI] [PMC free article] [PubMed] [Google Scholar]
- Hancock RE, Sahl HG. Antimicrobial and host-defense peptides as new anti-infective therapeutic strategies. Nat Biotechnol. 2006;24:1551–1557. doi: 10.1038/nbt1267. [DOI] [PubMed] [Google Scholar]
- Kiernan J. Histological and Histochemical Methods: Theory and Practice. Scion; Bloxham, UK: 2008. [Google Scholar]
- Lanza GM, Wallace KD, Scott MJ, Cacheris WP, Abendschein DR, Christy DH, Sharkey AM, Miller JG, Gaffney PJ, Wickline SA. A novel site-targeted ultrasonic contrast agent with broad biomedical application. Circulation. 1996;94:3334–3340. doi: 10.1161/01.cir.94.12.3334. [DOI] [PubMed] [Google Scholar]
- May MJ, D’Acquisto F, Madge LA, Glockner J, Pober JS, Ghosh S. Selective inhibition of NF-kappaB activation by a peptide that blocks the interaction of NEMO with the IkappaB kinase complex. Science. 2000;289:1550–1554. doi: 10.1126/science.289.5484.1550. [DOI] [PubMed] [Google Scholar]
- Pan H, Myerson JW, Ivashyna O, Soman NR, Marsh JN, Hood JL, Lanza GM, Schlesinger PH, Wickline SA. Lipid membrane editing with peptide cargo linkers in cells and synthetic nanostructures. FASEB J. 2010;24:2928–2937. doi: 10.1096/fj.09-153130. [DOI] [PMC free article] [PubMed] [Google Scholar]
- Pan H, Ivashyna O, Sinha B, Lanza GM, Ratner L, Schlesinger PH, Wickline SA. Post-formulation peptide drug loading of nanostructures for metered control of NF-kappaB signaling. Biomaterials. 2011;32:231–238. doi: 10.1016/j.biomaterials.2010.08.080. [DOI] [PMC free article] [PubMed] [Google Scholar]
- Papo N, Shai Y. Host defense peptides as new weapons in cancer treatment. Cell Mol Life Sci. 2005;62:784–790. doi: 10.1007/s00018-005-4560-2. [DOI] [PubMed] [Google Scholar]
- Rex S, Schwarz G. Quantitative studies on the melittin-induced leakage mechanism of lipid vesicles. Biochemistry. 1998;37:2336–2345. doi: 10.1021/bi971009p. [DOI] [PubMed] [Google Scholar]
- Soman NR, Lanza GM, Heuser JM, Schlesinger PH, Wickline SA. Synthesis and characterization of stable fluorocarbon nanostructures as drug delivery vehicles for cytolytic peptides. Nano Lett. 2008;8:1131–1136. doi: 10.1021/nl073290r. [DOI] [PMC free article] [PubMed] [Google Scholar]
- Soman NR, Baldwin SL, Hu G, Marsh JN, Lanza GM, Heuser JE, Arbeit JM, Wickline SA, Schlesinger PH. Molecularly targeted nanocarriers deliver the cytolytic peptide melittin specifically to tumor cells in mice, reducing tumor growth. J Clin Invest. 2009;119:2830–2842. doi: 10.1172/JCI38842. [DOI] [PMC free article] [PubMed] [Google Scholar]
- Stewart JC. Colorimetric determination of phospholipids with ammonium ferrothiocyanate. Anal Biochem. 1980;104:10–14. doi: 10.1016/0003-2697(80)90269-9. [DOI] [PubMed] [Google Scholar]
- Sticht J, Humbert M, Findlow S, Bodem J, Muller B, Dietrich U, Werner J, Krausslich HG. A peptide inhibitor of HIV-1 assembly in vitro. Nat Struct Mol Biol. 2005;12:671–677. doi: 10.1038/nsmb964. [DOI] [PubMed] [Google Scholar]
- Warbrick E, Lane DP, Glover DM, Cox LS. A small peptide inhibitor of DNA replication defines the site of interaction between the cyclin-dependent kinase inhibitor p21WAF1 and proliferating cell nuclear antigen. Curr Biol. 1995;5:275–282. doi: 10.1016/s0960-9822(95)00058-3. [DOI] [PubMed] [Google Scholar]
- Werkmeister JA, Kirkpatrick A, McKenzie JA, Rivett DE. The effect of sequence variations and structure on the cytolytic activity of melittin peptides. Biochim Biophys Acta. 1993;1157:50–54. doi: 10.1016/0304-4165(93)90077-l. [DOI] [PubMed] [Google Scholar]