Abstract
Binary time-frequency (TF) masks can be applied to separate speech from noise. Previous studies have shown that with appropriate parameters, ideal TF masks can extract highly intelligible speech even at very low speech-to-noise ratios (SNRs). Two psychophysical experiments provided additional information about the dependence of intelligibility on the frequency resolution and threshold criteria that define the ideal TF mask. Listeners identified AzBio Sentences in noise, before and after application of TF masks. Masks generated with 8 or 16 frequency bands per octave supported nearly-perfect identification. Word recognition accuracy was slightly lower and more variable with 4 bands per octave. When TF masks were generated with a local threshold criterion of 0 dB SNR, the mean speech reception threshold was −9.5 dB SNR, compared to −5.7 dB for unprocessed sentences in noise. Speech reception thresholds decreased by about 1 dB per dB of additional decrease in the local threshold criterion. Information reported here about the dependence of speech intelligibility on frequency and level parameters has relevance for the development of non-ideal TF masks for clinical applications such as speech processing for hearing aids.
INTRODUCTION
The normal auditory system is exceptional at separating speech from noise or other competing sounds. However, listeners with hearing loss have unusual difficulty processing speech in the same conditions (Plomp and Mimpen, 1979; Nilsson et al., 1994; Turner, 2006; Helfer and Freyman, 2008). Modern hearing aids incorporate noise-reduction circuitry but that has not yet produced dramatic improvements in the recognition of speech in noise (Bentler and Chiou, 2006; Sarampalis et al., 2009). Previous research by others has shown that the application of a time-frequency (TF) mask is an effective method for separating signals from competing sounds that can produce substantial increases in the intelligibility of speech in noise (Brungart et al., 2006; Anzalone et al., 2006; Wang et al., 2008, 2009; Li and Loizou, 2008a; Kjems et al., 2009). An “ideal” TF mask that extracts a target signal from a noisy background can be calculated but the mask is ideal in the engineering sense that the calculation requires information about the target, independent of the noise with which it is mixed. That requirement obviously makes ideal TF masks impractical for real-world use in hearing aids or cochlear implants. Even so, TF masks are quite useful as research tools, and Wang (2005) has proposed that the performance of an ideal TF mask can be used as a benchmark to evaluate other methods for separating competing signals, such as those developed in computational auditory scene analysis. With appropriate selection of parameter values, application of an ideal TF mask enables nearly-perfect identification of speech in noise even at highly unfavorable speech-to-noise ratios (SNRs). In the experiments that are reported here, the effects of varying parameters that affect the frequency resolution and amplitude selectivity of the TF mask were examined to provide additional information about their relative importance for the performance of the mask. Frequency resolution has been examined in two previous studies (Li and Loizou, 2008b; Wang et al., 2008) but the experiments described in those reports differed in significant ways from the experiment reported here. Complete psychometric functions and speech recognition thresholds (SRTs) were obtained for a subset of the TF masks. SRTs were obtained for a wider range of conditions than had been reported previously (Anzalone et al., 2006; Wang et al., 2009).
GENERAL METHODS
Stimuli
The sentence-length speech materials used in this study were taken from the AzBio Sentence Lists (Spahr et al., 2012; Auditory Potential LLC, Goodyear, AZ). The version of the sentence database used included 33 lists of 20 sentences (plus a shorter practice list). AzBio sentences vary in length, complexity, and predictability, and are spoken in an informal conversational style. These characteristics make the sentences more like real-world speech but also make them more challenging, at least for some populations (Gifford et al., 2008). The 20 sentences in each list included 5 sentences spoken by each of 4 talkers, 2 male and 2 female. The sentences were mixed with noise prior to presentation. The noises had spectra that were shaped to match the average spectra of the sentences produced by the individual AzBio talkers. The average spectra were estimated from the 165 sentences in the database produced by each talker, and the noises so produced are referred to as “talker-specific noises.” Prior to presentation, each AzBio sentence was mixed with noise whose spectrum matched the spectrum of the same talker who produced the original sentence.
TF masks
TF masks were generated with procedures similar to those described by Brungart et al. (2006), Wang et al. (2008, 2009), and Kjems et al. (2009). The TF mask is a matrix of cells, each defined by a particular time frame and frequency band. The amplitudes of speech and of noise within each cell were separately evaluated to judge whether the cell was dominated by speech or by noise; that information was used to process the speech-noise mixture to preserve speech and reject noise, as described below. The frame length was always 20 msec, and successive frames overlapped by 10 msec. The width of the individual frequency bands and the separation between center frequencies varied in Experiment 1, and the threshold criterion used to distinguish speech from noise varied in Experiment 2, as described below. Second-order Butterworth filters were used for all conditions. The masks were always generated with the noise level set to 60 dBA.
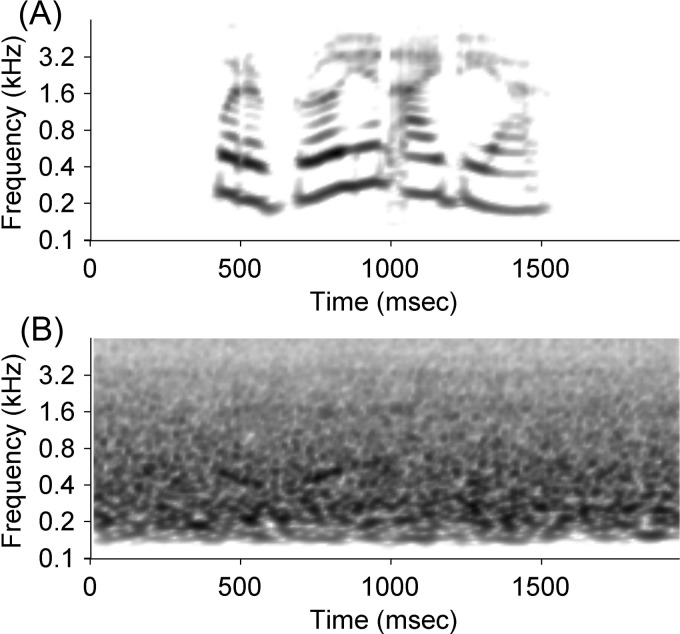
Figure 1 shows spectrograms calculated for one representative AzBio sentence, in quiet [Fig. 1A] and mixed with talker-specific noise at −8 dB SNR [Fig. 1B]. With few exceptions, the spectral and temporal features of the sentence that were obvious in Fig. 1A cannot be seen in Fig. 1B. To generate a TF mask, the root-mean-square (rms) amplitude of the speech signal in each TF cell was compared to the rms amplitude of the noise in the same cell. The difference in dB was compared to a criterion value, called a “local criterion” (LC) by Brungart et al. (2006). If the level difference in the cell was equal to or greater than the LC, the cell was assumed to be dominated by speech and the gain for that cell was set to one; otherwise, the cell was assumed to be dominated by noise and the gain was set to zero.
Figure 1.
Spectrograms of a representative AzBio sentence spoken by female talker 2. The ordinate scale is logarithmic. (A) Spectrogram of speech in quiet. (B) Spectrogram of speech mixed with noise at −8 dB SNR.
The TF mask was then applied to the speech-noise mixture to generate the waveforms that were presented for identification. To apply the mask, the speech-noise mixture was analyzed in the same matrix of TF cells as before. For each cell, if the gain of the mask was one, the waveform in that band and time frame was added to the output waveform. If the gain of the mask was zero, the waveform in that cell was discarded. The output waveform that resulted after all cells had been processed was rescaled to have an overall level of 60 dBA when presented for identification.
Listeners
Data were obtained from listeners who gave informed consent and were paid for their time. Their ages varied from 20 to 56 (median = 23), all were native speakers of English, and all had pure-tone thresholds less than 20 dB SPL at octave frequencies between 0.25 and 4.0 kHz. All procedures involving human subjects were reviewed and approved by the Institutional Review Board at Utah State University.
General psychophysical procedures
Measurements were made in a single-walled sound booth (IAC, Industrial Acoustics Corp., Bronx, NY). Stimulus processing, data collection, and data analysis were controlled by custom software written in Matlab. Speech waveforms were always generated in advance and saved for later use. For data collection they were read from files, and delivered diotically from a high-quality sound card (Gina 3G, Echo Digital Audio, Santa Barbara, CA) through circumaural headphones (HD280 Pro, Sennheiser Electronic Corp., Old Lyme, CT). Each listener first heard a practice list of 5 sentences presented at 10 to 20 dB SNR in order to become familiar with procedural details. Next, blocks of trials were presented where a block consisted of the 20 sentences from one list. A different, previously-unheard list of sentences was used for each block. The listeners' task in every case was to listen to the sentence, then repeat the words that were heard. Spoken responses were digitized by the data-collection software and saved for analysis offline. The sequence of lists and the order of sentences within a list were randomized for each listener. In each experiment, the order of conditions was counterbalanced across listeners. The listener initiated each trial in a block with a mouse click, and initiated the recording of a response with a second click. Breaks were taken between blocks as needed.
For each block of sentences, a Recognition Score based on the proportion of words identified was calculated. Words that were accurately identified were given 1 point. Words that were partially identified, meaning that some but not all phonemes were correctly repeated, were given 1/2 point. The final Recognition Score was defined as the total number of points divided by the total number of words presented. As a check on the accuracy of the scoring, responses for a subset of blocks were independently analyzed by a second person. Recognition Scores were highly reliable, so all scores shown in this paper were obtained by the same person.
EXPERIMENT 1: RECOGNITION OF SPEECH-NOISE MIXTURES AFTER PROCESSING BY TF MASKS WITH DIFFERENT FREQUENCY RESOLUTION
Methods
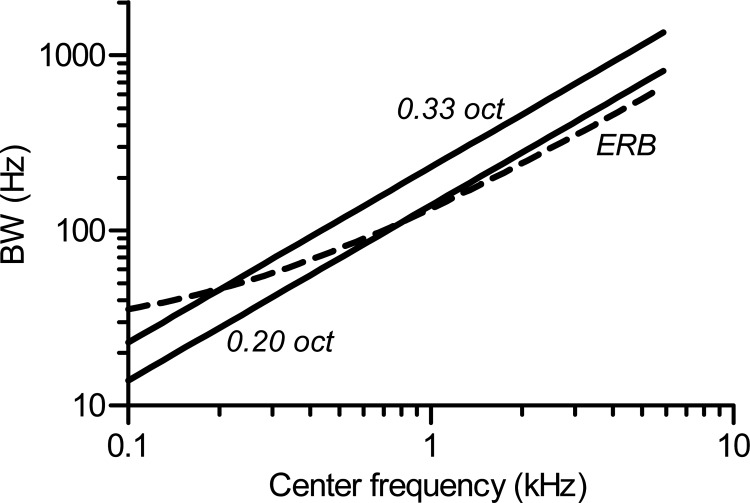
TF masks were calculated as described in Sec. 2. The width of each analysis band in the TF mask was either 0.20 or 0.33 octave. Figure 2 compares the two filter bandwidths to the widths of psychophysical Equivalent Rectangular Bandwidths (ERBs; Moore and Glasberg, 1987). The bandwidths used here bracket, approximately, the ERB, although the relative width of ERBs decreases as the center frequency increases. The filter density was either 4, 8, or 16 bands per octave, over the range from 0.1 to 6.0 kHz.
Figure 2.
Bandwidths of the filters used to generate TF masks, compared to ERBs calculated from the formula provided by Moore and Glasberg (1987). Filters with bandwidth = 0.33 octaves were somewhat comparable to ERBs at the lowest center frequencies. Filters with bandwidth = 0.20 octaves were comparable to ERBs at higher center frequencies.
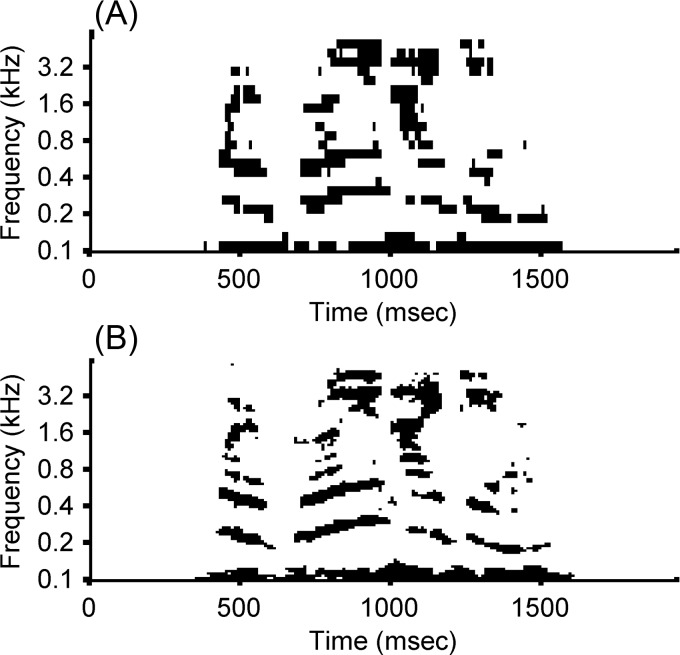
Two examples of TF masks are shown in Fig. 3. The masks were calculated from the same sentence shown in quiet and in noise in Fig. 1. LC was −8 dB, which matched the overall SNR of the mixture, and Fig. 1 illustrates the lowest and highest frequency resolution for which Recognition Scores were obtained. The low-resolution TF mask shown in Fig. 3A was generated with 4 bands per octave and a bandwidth of 0.33 octave. That can be compared to the high-resolution mask in Fig. 3B, which was calculated with 16 bands per octave and a bandwidth of 0.20 octave. Each had the same general appearance as the spectrogram of the original sentence in quiet but the higher-resolution example in the lower panel preserved more detail; for example, the pattern created by individual harmonics of the female talker's f0 was more apparent in Fig. 3B than in Fig. 3A.
Figure 3.
TF masks calculated with LC = 0 dB and SNR = −8 dB, for the same sentence for which spectrograms were shown in Fig. 1. (A) Low-resolution TF mask, calculated with 4 bands per octave, 0.33 octaves per band. (B) High-resolution TF mask, calculated with 16 bands per octave, 0.20 octaves per band.
Sentences were mixed with talker-specific noise at −8 dB SNR, and LC was always −8 dB. After application of a TF mask, the processed sentences were presented for identification, as described in Sec. 2. Ten listeners participated in Experiment 1.
Results
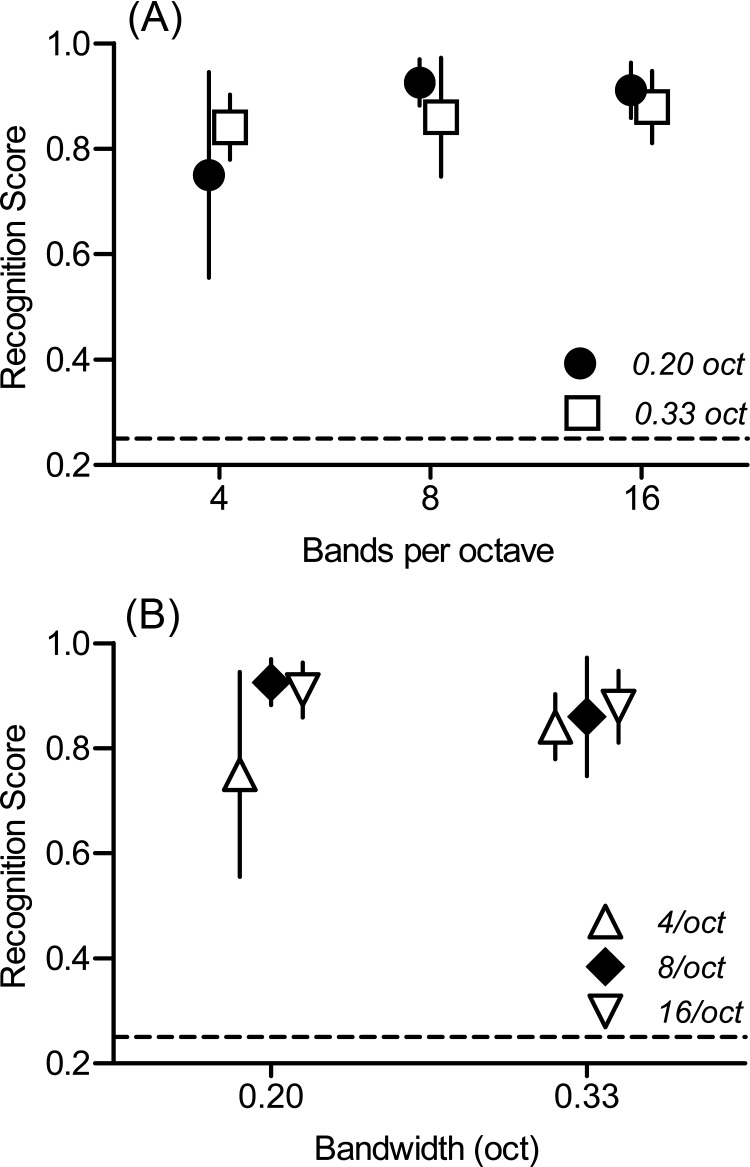
Figure 4 shows the effect of TF-mask frequency resolution on the intelligibility of speech-noise mixtures. Each symbol represents the mean Recognition Score calculated across ten listeners. Figure 4A shows that performance improved slightly as filter density increased. High levels of recognition were obtained by many listeners even with only 4 bands per octave but some lower scores decreased the mean and increased the variability at that density, especially when the bandwidth was 0.20 kHz. The combination of a narrow bandwidth and widely-spaced center frequencies may have created gaps in the speech spectrum, accounting for the decreased intelligibility in that condition. Recognition performance was more consistently high with 8 and 16 bands per octave. The same data are replotted in Fig. 4B as a function of the filter bandwidth; the narrower bandwidth produced higher Recognition Scores but only when the number of bands per octave was 8 or 16. A two-way analysis of variance was conducted, using rationalized arcsine transforms of the Recognition Scores (Studebaker, 1985). The effect of filter density on intelligibility was highly significant (F[2,54] = 6.87, p = 0.002). The effect of the filter bandwidth was not significant (F[1,54] = 0.32, p > 0.05). Although Fig. 4 suggests a possible interaction between filter density and bandwidth, the interaction did not reach statistical significance (F[2,54] = 2.81, p > 0.06). With 16 bands per octave, the mean proportion of words recognized was 0.91 for 0.20-octave bands and 0.88 for 0.33-octave bands. For every TF mask condition, performance was better than what had been observed at the same SNR prior to processing by a TF mask; the mean Recognition Score for unprocessed speech at the same SNR, −8 dB, was 0.25.
Figure 4.
Intelligibility of speech-noise mixtures after processing with TF masks generated with different frequency resolution. Each symbol represents the mean Recognition Score obtained with one combination of filter bandwidth and filter density. Error bars are standard deviations. The dashed line in each panel marks the mean Recognition Score obtained for unprocessed speech in noise at the same SNR, −8 dB. (A) Intelligibility as a function of filter density in bands per octave. (B) The same data shown in (A), rearranged to show intelligibility as a function of filter bandwidth.
Because many of the observed Recognition Scores approached the ceiling value 1.0, these data did not allow the improvement in SRT attributable to the TF mask to be estimated. Experiment 2 was intended to provide that information.
EXPERIMENT 2: THRESHOLDS FOR SPEECH-NOISE MIXTURES PROCESSED BY TF MASKS
Methods
For Experiment 2, TF masks were calculated with a filter bandwidth fixed at 0.20 octave and the filter density fixed at 16 bands per octave; these values represent the highest frequency resolution examined Experiment 1. The threshold LC varied from −24 to 0 dB; these values were tested in an order that was counterbalanced across listeners. Sentences were mixed with talker-specific noise in every case. SNR was varied in order to generate complete psychometric functions, from which SRTs for TF-masked speech in noise were estimated. Five new listeners participated in Experiment 2.
Results
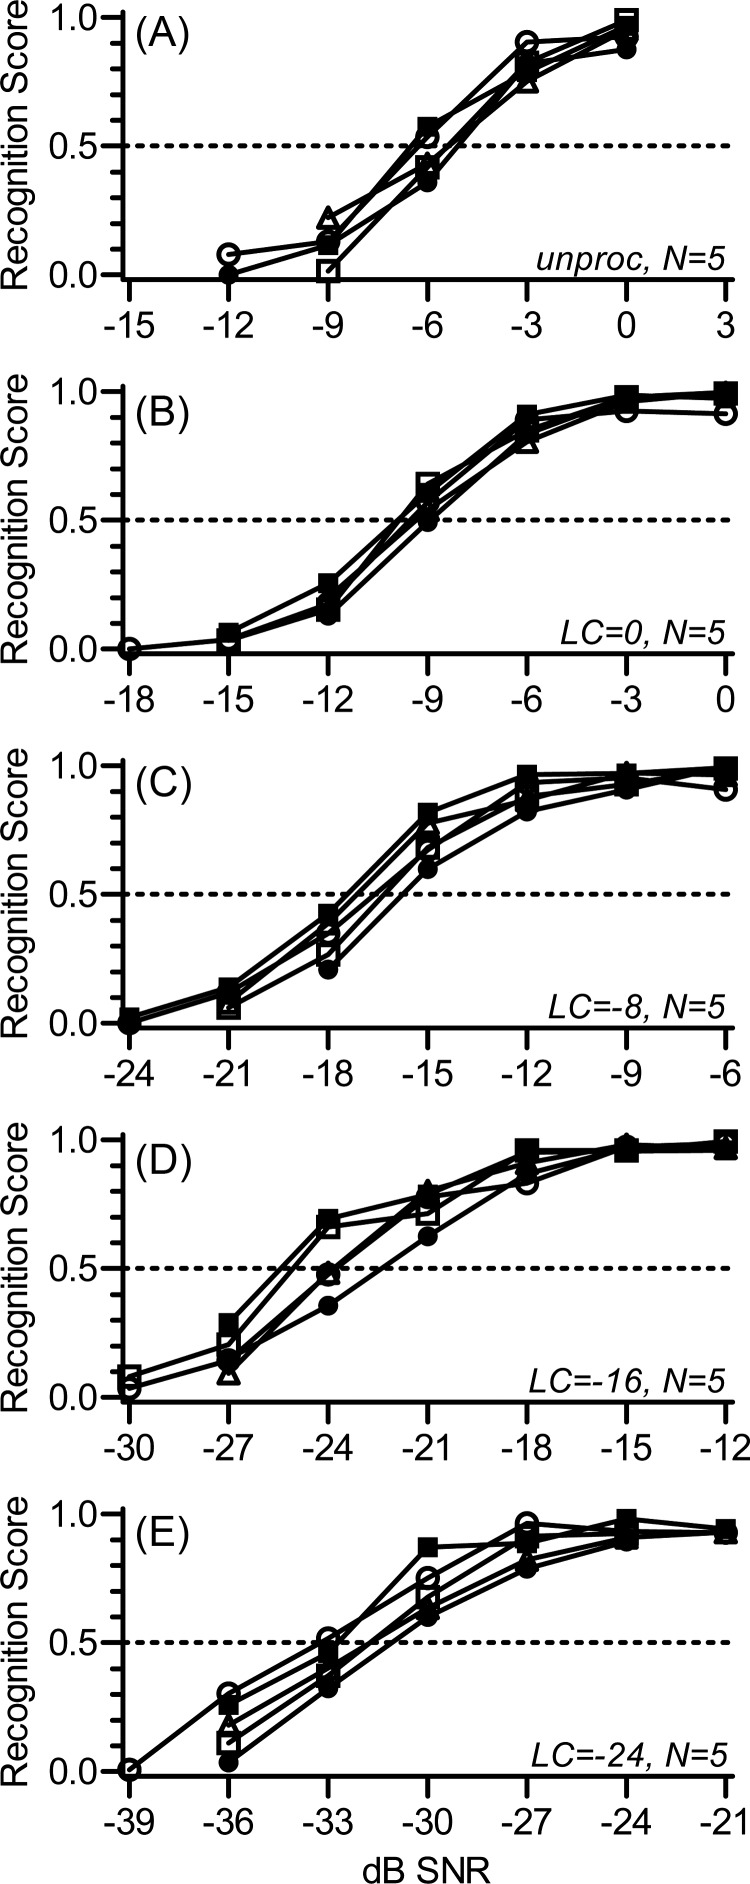
Psychometric functions for TF-masked speech are shown in Fig. 5. Figure 5 also shows the same listeners' psychometric functions for unprocessed speech-noise mixtures for comparison. Across the conditions, the shapes of psychometric functions were similar to one another and to those obtained with unprocessed speech in noise. The change in intelligibility in the region near the SRT was on the order of 0.1 per dB change in SNR. An obvious difference across conditions was that the range of SNR over which Recognition Scores varied with SNR was highly dependent on LC. In addition, as LC decreased, the psychometric functions became more variable across listeners and the slopes became more shallow.
Figure 5.
Psychometric functions for speech-noise mixtures processed with TF masks. Each line represents a single listener, identified by the same symbol in each panel. The horizontal line marks the value of the Recognition Score, 0.5, that defined the SRT. The abscissa scale changes in each panel but the difference between the lowest and highest values is a constant 18 dB. (A) Intelligibility for sentences in talker-specific noise, prior to application of TF masks. (B) Intelligibility for TF masks generated with LC = 0 dB. (C) Same as (A), for TF masks generated with LC = −8 dB. (D) Same as (A), for TF masks generated with LC = −16 dB. (E) Same as (A), for TF masks generated with LC = −24 dB.
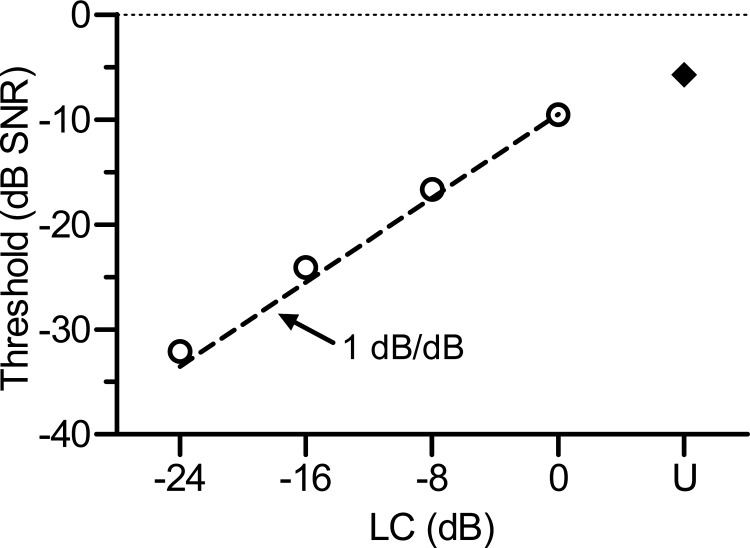
Figure 6 shows the mean SRTs for TF-masked speech, and compares them to the SRT for unprocessed speech in noise. For LC = 0 dB, the mean SRT was −9.5 dB SNR. For this criterion, the SRT was reduced by only 3.8 dB, relative to the same listeners' SRT for unprocessed speech in noise (−5.7 dB SNR). Each successive reduction in LC lowered the SRT, by an amount very close to 1 dB per dB decrease in LC (dashed line).
Figure 6.
SRTs for speech-noise mixtures processed with TF masks, compared to the mean SRT for unprocessed speech-noise mixtures (solid symbol labeled “U” on the abscissa). The dashed line with a slope of 1 dB/dB provides a good fit to the data.
DISCUSSION
The application of an ideal TF mask is an effective method for eliminating noise from a speech-noise mixture. Although the use of TF masks is largely confined to laboratory studies now, the method is potentially applicable to real-world problems such as noise-rejection circuits for hearing aids (Wang, 2008). Ideal TF masks achieve success despite wide variation in frequency and threshold parameters. However, the fact that the performance of a TF mask is relatively insensitive to the particular parameters chosen means that it is not possible to answer simple questions like “what is the minimum frequency resolution required to generate an effective TF mask?”. That is in part because the effect of frequency resolution has rarely been studied in isolation. It is also in part because the design of many studies has been such that listeners can identify 100% of the stimuli in many of the conditions. The experiments reported here were designed to eliminate confounding that has necessarily limited comparisons across previous studies, and parameters were chosen to produce a range of psychophysical performances. As a result, two new conclusions can be drawn. First, although previous studies have used frequency resolution as high as 21 or 32 bands per octave (Brungart et al., 2006; Wang et al., 2008), it was shown here that there is little or no advantage to using frequency resolution greater than 8 bands per octave. The experiments also confirmed empirically that the threshold for speech in noise decreases 1 dB per dB decrease in the local criterion used to generate the TF mask. These are new findings that are discussed in Secs. 5A, 5B, 5C.
Frequency resolution and intelligibility
In the present Experiment 1, the performance of the TF masks varied with filter density. Although there was no significant difference between intelligibility at 8 and 16 bands per octave, Recognition Scores were lower and more variable with only 4 bands per octave. These results are generally consistent with findings from previous studies in showing nearly-perfect intelligibility in the best conditions, even though there were some methodological differences between the study reported here and those from other laboratories. One difference is the type of filter used. Several investigators have generated TF masks starting with a gammatone filterbank (Patterson et al., 1988). The bandwidths of gammatone filters vary with center frequency to approximate the frequency selectivity of cochlear filtering, similar to ERBs shown in Fig. 5. Brungart et al. (2006) implemented TF masks with a bank of 128 gammatone filters covering the range from 0.08 to 5.0 kHz, a density of approximately 21 bands per octave. Kjems et al. (2009) and Wang et al. (2009) used a gammatone filterbank with 64 bands covering the range from 0.055 to 7.743 kHz, or about 9 bands per octave. In Anzalone et al. (2006), filter center frequencies were separated by either one ERB or one-half of an ERB, corresponding to densities of approximately 5 or 9 bands per octave. In all of these studies, nearly-perfect intelligibility has been reported, at least for conditions in which the LC was close to the optimal value. The effect of filter density is generally consistent, whether the filter bandwidths do or do not vary with center frequency. Two conclusions are supported by this pattern of results. First, there is no obvious advantage (or disadvantage) to using filters explicitly based on psychoacoustic or neurophysiological principles, as gammatone filters are. Second, the highest levels of intelligibility can be achieved with filter densities on the order of 8 to 16 bands per octave, and further increases in frequency resolution do not (and could not) improve recognition performance. This may be relevant if processing speed is an issue, as it is in a related project in this lab that uses a computational model of auditory processing (Sinex et al., 2005) to generate TF masks without the benefit of prior knowledge of the speech signal.
Two previous reports have examined the consequences of TF mask frequency resolution, although there were significant procedural differences between those studies and the present Experiment 1. Li and Loizou (2008b) varied frequency resolution by processing speech and noise with sinewave vocoders with 6 to 32 channels. For a fixed SNR, the intelligibility of vocoded speech-noise mixtures increased with the number of channels, reaching asymptote at 12 or more channels depending on SNR and the characteristics of the noise. The number of channels required for maximum intelligibility was higher than has been observed for vocoded speech without noise (Loizou et al., 1999). Stimuli were subsequently processed with TF masks whose frequency resolution exactly matched that of the vocoders. The application of TF masks improved intelligibility overall but had little or no effect on the pattern of dependence on frequency resolution. For that reason it seems likely that the observed dependence on frequency resolution should be attributed to the vocoders; the effect of the resolution of the TF mask itself was not independently assessed.
Wang et al. (2008) explicitly varied filter density from 4 to 32 bands per octave, similar to the range used in Experiment 1 of this study. They reported much lower recognition scores at low densities than were observed in the present study. When TF masks were generated with 4 bands per octave, the mean recognition score in the present study was 0.80; in Wang et al. (2008), the mean score was an order of magnitude lower, 0.08. Although the TF masks used in the two reports were similar, there was an important difference in how the masks were applied. Wang et al. generated stimuli for identification by applying the TF mask to noise alone, rather than to the speech-noise mixture as has been done in other studies, including this one. It seems likely that a low-density TF mask applied to a noisy signal that includes speech extracts some acoustic structure that would not have been available to the listeners in the experiment of Wang et al. (2008). Consistent with that interpretation, Kjems et al. (2009) found that an ideal TF mask applied to a speech-noise mixture at −60 dB SNR—which was essentially another noise alone condition—produced a signal that was intelligible but less intelligible than the signal produced by applying a comparable TF mask to a mixture with a higher SNR.
In the studies reviewed so far, filter bandwidths expressed in octaves were more-or-less a constant proportion of center frequency. A somewhat different approach was taken by Li and Loizou (2008a), who used Fourier analysis as an alternative to individual bandpass filters to compute the frequency dimension of the TF mask. As a result, their analysis bands were constant in Hz, and, when expressed in octaves, became much narrower as the center frequency increased. Despite the increase in frequency resolution at higher center frequencies, application of the TF masks produced a pattern of intelligibility that was generally similar to the pattern reported by others (Brungart et al., 2006; Kjems et al., 2009).
Speech reception thresholds
Several previous studies of speech intelligibility after the application of TF masks have fixed SNR at one or a few values while varying the threshold criterion LC (Brungart et al., 2006; Li and Loizou, 2008a; Kjems et al., 2009). In a few experiments prior to the current one, SNR has been varied to estimate SRTs for speech-noise mixtures processed with TF masks. Anzalone et al. (2006) measured the SRT for HINT sentences using the test's standard adaptive procedure; they reported that for listeners with normal hearing, the mean SRT for unprocessed HINT sentences was about −3 dB SNR as expected (Nilsson et al., 1994). After application of the TF mask, the mean SRT was reduced to at most −10 dB SNR, the lowest value they could measure and an improvement in SRT of at least 7 dB. Wang et al. (2009) reported that after application of TF masks generated with LC = −6 dB, the mean SRT for Dantale II sentences was −15.6 dB SNR, an improvement of 7.4 dB over the mean SRT reported for unprocessed sentences in the same study. The series of experiments reported by Brungart et al. (2006) included one condition that produced psychometric functions from which estimates of the SRT for CRM sentences with and without application of a TF mask could be made. For unprocessed CRM sentences mixed with continuous speech-shaped noise, the SRT was about −7 dB SNR. Applying a TF mask generated with LC = 0 dB reduced the SRT to about −12 dB SNR, an improvement of 5 dB. Wang et al. (2009) compared that result to their own, noting that a greater improvement in SRT was obtained with LC = −6 dB than with LC = 0 dB.
SRTs were estimated from psychometric functions and for a larger range of TF mask conditions in the present Experiment 2. SRT varied in a simple way with LC, as was shown in Fig. 5. One way to describe the data in Fig. 5 is to say that the SRT after application of an ideal TF mask can be made to have any arbitrary value; the investigator needs only to choose the appropriate value of LC. That has implications for evaluating the SRT reported in any experiment that makes use of ideal TF masks. A comparison of two SRTs or a comparison of the improvement obtained in two experiments will be valid only when conditions such as the choice of LC were equivalent. Generalizing from Fig. 6 suggests that if Wang et al. (2009) had selected the same LC (0 dB) as Brungart et al. (2006), they likely would have observed 1.4 dB of improvement, which is less than Brungart obtained. In the present Experiment 2, a comparable condition with LC = 0 dB was included; it produced 3.8 dB of SRT improvement, compared to the same listeners SRTs for unprocessed sentences in noise. That value is close to what was observed by Brungart et al. The TF masks in the study by Anzalone et al. (2006) were generated with a different method that did not use an LC criterion, so their SRTs cannot easily be compared to any of these values.
Lowering the value of a LC led to lower SRTs, as shown in Figs. 56. Wang and others have noted that for generating a TF mask, a reduction of 1 dB in LC is equivalent to a 1 dB increase in a SNR. As a result, the TF mask estimated after a change in LC will be the same mask that would be estimated after a change of the same magnitude in SNR. As Fig. 5 shows, SRTs decreased by 1 dB per dB decrease in LC, as predicted. However, it is also clear from Fig. 5 that the psychometric functions became more variable as LC decreased. That is not inconsistent with what Wang et al. (2008) had said about the trading relation between SNR and LC. They also noted that the waveform that is produced by application of a TF mask does change slightly, depending on the particular SNR of the mixture to which the mask is applied. That is, identical TF masks applied to speech-noise mixtures with different overall SNRs do not produce identical waveforms.
Other comparisons
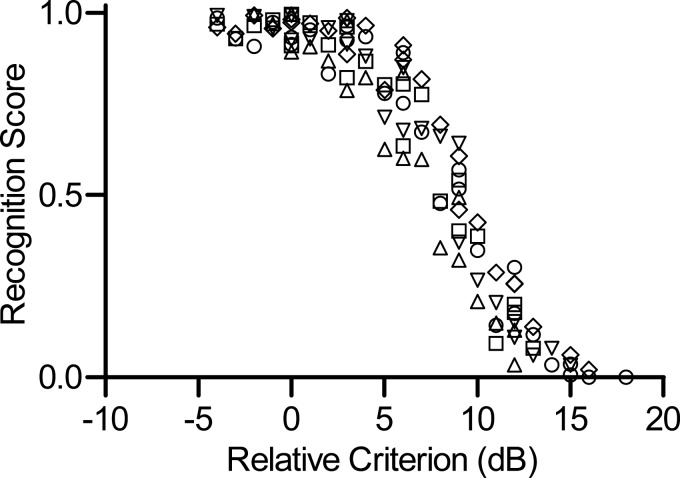
As noted previously, most previous reports of the effectiveness of TF masks for isolating speech from speech-noise mixtures have emphasized the effect of the LC; typically, a SNR has been restricted to one or a few values, and the dependence of recognition scores on the LC has been reported. When speech mixed with noise at SNR = 0 dB is processed, nearly perfect recognition is obtained for a range of LC that varies slightly across reports and with procedural details but generally runs from approximately −20 to +5 dB (Brungart et al., 2006; Li and Loizou, 2008a; Kjems et al., 2009). Intelligibility decreases for the LC below and above that range. A similar pattern is observed for other mixture SNRs, if the LC is normalized with respect to SNR [a “relative criterion” in the terminology of Kjems et al. (2009)]. Although the present Experiment 2 was not designed to replicate that pattern, a large number of combinations of LC and SNR were presented. The LC values can be expressed as relative criteria, which fell in the range from −4 to +18 dB. That range is restricted to approximately the upper half of the range studied by Brungart et al. (2006), Li and Loizou (2008a), and Kjems et al. (2009) but within that range the pattern of recognition is consistent with those reports, as shown in Fig. 7.
Figure 7.
Recognition Scores shown as a function of Relative Criterion. The abscissa represents the LC normalized by SNR, as described by Kjems et al. (2009). Each symbol represents the score obtained for one block of 20 sentences by 1 listener; individual listeners are identified by unique symbols. Data from all listeners and all blocks of trials from Experiment 2 are shown.
Conclusions
Ideal TF masks can provide excellent noise reduction, although they remain impractical for real-world use in hearing aids or cochlear implants. They are valuable as research tools, in part because the ability of a TF mask to extract speech from noise can be used as a benchmark to evaluate other methods for separating competing signals (Wang, 2005). It will eventually be possible to generate TF masks without a priori information about the signal to be extracted (Kim et al., 2009); these masks show promise for applications such as hearing-aid processing (Wang, 2008). The experiments reported here provide some guidance about the precision that might be required to make an effective non-ideal TF mask. Frequency resolution in the range from 8 to 16 bands per octave appears to be sufficient to provide effective noise reduction. At lower resolution, identification performance decreases and/or becomes more variable. Higher frequency resolution increases processing time without providing obvious additional improvements in speech recognition. Varying LC to generate ideal TF masks can produce reductions in SRT ranging from modest to enormous (Kjems et al., 2009; present Experiment 2). When the local threshold criterion LC of an ideal TF mask is set to 0 dB SNR, an SRT decrease of about 4 dB relative to the SRT for unprocessed speech-noise mixtures can be expected (Brungart et al., 2006; present Experiment 2). That amount of threshold shift is small but based on the slopes of the psychometric functions reported here it is enough to increase the proportion of intelligible words in sentences from 0.5 to approximately 0.9. A non-ideal TF mask that could achieve an effective LC of 0 dB could potentially provide a clinical benefit.
ACKNOWLEDGMENTS
This work was supported by RC1 DC010615 from NIDCD. A preliminary set of AzBio Sentences was generously made available by Dr. Tony Spahr and Dr. Michael Dorman.
References
- Anzalone, M. C., Calandruccio, L., Doherty, K. A., and Carney, L. H. (2006). “ Determination of the potential benefit of time-frequency gain manipulation,” Ear Hear. 27, 480–492. 10.1097/01.aud.0000233891.86809.df [DOI] [PMC free article] [PubMed] [Google Scholar]
- Bentler, R., and Chiou, L. K. (2006). “ Digital noise reduction: An overview,” Trends Amplif. 10, 67–82. [DOI] [PMC free article] [PubMed] [Google Scholar]
- Brungart, D. S., Chang, P. S., Simpson, B. D., and Wang, D. (2006). “ Isolating the energetic component of speech-on-speech masking with ideal time-frequency segregation,” J. Acoust. Soc. Am. 120, 4007–4018. 10.1121/1.2363929 [DOI] [PubMed] [Google Scholar]
- Gifford, R. H., Shallop, J. K., and Peterson, A. M. (2008). “ Speech recognition materials and ceiling effects: Considerations for cochlear implant programs,” Audiol. Neuro-Otol. 13, 193–205. 10.1159/000113510 [DOI] [PubMed] [Google Scholar]
- Helfer, K. S., and Freyman, R. L. (2008). “ Aging and speech-on-speech masking,” Ear Hear. 29, 87–98. [DOI] [PMC free article] [PubMed] [Google Scholar]
- Kim, G., Lu, Y., Hu, Y., and Loizou, P. C. (2009). “ An algorithm that improves speech intelligibility in noise for normal-hearing listeners,” J. Acoust. Soc. Am. 126, 1486–1494. 10.1121/1.3184603 [DOI] [PMC free article] [PubMed] [Google Scholar]
- Kjems, U., Boldt, J. B., Pedersen, M. S., Lunner, T., and Wang, D. (2009). “ Role of mask pattern in intelligibility of ideal binary-masked noisy speech,” J. Acoust. Soc. Am. 126, 1415–1426. 10.1121/1.3179673 [DOI] [PubMed] [Google Scholar]
- Li, N., and Loizou, P. C. (2008a). “ Factors influencing intelligibility of ideal binary-masked speech: Implications for noise reduction,” J. Acoust. Soc. Am. 123, 1673–1682. 10.1121/1.2832617 [DOI] [PMC free article] [PubMed] [Google Scholar]
- Li, N., and Loizou, P. C. (2008b). “ Effect of spectral resolution on the intelligibility of ideal binary masked speech,” J. Acoust. Soc. Am. 123, EL59–EL64. [DOI] [PMC free article] [PubMed] [Google Scholar]
- Loizou, P. C., Dorman, M., and Tu, Z. (1999). “ On the number of channels needed to understand speech,” J. Acoust. Soc. Am. 106, 2097–2103. 10.1121/1.427954 [DOI] [PubMed] [Google Scholar]
- Moore, B. C., and Glasberg, B. R. (1987). “ Formulae describing frequency selectivity as a function of frequency and level, and their use in calculating excitation patterns,” Hear. Res. 28, 209–225. 10.1016/0378-5955(87)90050-5 [DOI] [PubMed] [Google Scholar]
- Nilsson, M., Soli, S. D., and Sullivan, J. A. (1994). “ Development of the Hearing in Noise Test for the measurement of speech reception thresholds in quiet and in noise,” J. Acoust. Soc. Am. 95, 1085–1099. 10.1121/1.408469 [DOI] [PubMed] [Google Scholar]
- Patterson, R. D., Holdsworth, J., Nimmo-Smith, I., and Rice, P. (1988). “ Implementing a gammatone filterbank,” SVOS final report Part B, MRC Applied Psychology Unit.
- Plomp, R., and Mimpen, A. M. (1979). “ Speech-reception threshold for sentences as a function of age and noise level,” J. Acoust. Soc. Am. 66, 1333–1342. 10.1121/1.383554 [DOI] [PubMed] [Google Scholar]
- Sarampalis, A., Kalluri, S., Edwards, B., and Hafter, E. (2009). “ Objective measures of listening effort: Effects of background noise and noise reduction,” J. Speech Lang. Hear. Res. 52, 1230–1240. 10.1044/1092-4388(2009/08-0111) [DOI] [PubMed] [Google Scholar]
- Sinex, D. G., Li, H., and Velenovsky, D. S. (2005). “ Prevalence of stereotypical responses to mistuned complex tones in the inferior colliculus,” J. Neurophysiol. 94, 3523–3537. 10.1152/jn.01194.2004 [DOI] [PMC free article] [PubMed] [Google Scholar]
- Spahr, A. J., Dorman, M. F., Litvak, L. M., Van Wie, S., Gifford, R. H., Loizou, P. C., Loiselle, L. M., Oakes, T., and Cook, S. (2012). “ Development and validation of the AzBio sentence lists,” Ear Hear. 33, 112–117. 10.1097/AUD.0b013e31822c2549 [DOI] [PMC free article] [PubMed] [Google Scholar]
- Studebaker, G. A. (1985). “ A ‘rationalized’ arcsine transform,” J. Speech Hear. Res. 28, 455–462. [DOI] [PubMed] [Google Scholar]
- Turner, C. W. (2006). “ Hearing loss and the limits of amplification,” Audiol. Neuro-Otol. 1(11 ), 2–5. 10.1159/000095606 [DOI] [PubMed] [Google Scholar]
- Wang, D. (2005). “ On ideal binary mask as the computational goal of auditory scene analysis,” in Speech Separation by Humans and Machines, edited by Divenyi P. (Kluwer Academic, Norwell, MA: ), pp. 181–197. [Google Scholar]
- Wang, D., Kjems, U., Pedersen, M. S., Boldt, J. B., and Lunner, T. (2008). “ Speech perception of noise with binary gains,” J. Acoust. Soc. Am. 124, 2303–2307. 10.1121/1.2967865 [DOI] [PubMed] [Google Scholar]
- Wang, D., Kjems, U., Pedersen, M. S., Boldt, J. B., and Lunner, T. (2009). “ Speech intelligibility in background noise with ideal binary time-frequency masking,” J. Acoust. Soc. Am. 125, 2336–2347. 10.1121/1.3083233 [DOI] [PubMed] [Google Scholar]
- Wang, D. L. (2008). “ Time-frequency masking for speech separation and its potential for hearing aid design,” Trends Amplif. 12, 332–353. 10.1177/1084713808326455 [DOI] [PMC free article] [PubMed] [Google Scholar]


