

Abstract
Typically, in the milder form of primary hyperparathyroidism (PHPT), seen in most countries now, bone density by DXA and detailed analyses of iliac crest bone biopsies by histomorphometry and µCT show detrimental effects in cortical bone, whereas the trabecular site (lumbar spine by DXA) and the trabecular compartment (by bone biopsy) appear to be relatively well preserved. Despite these findings, fracture risk at both vertebral and non-vertebral sites is increased in PHPT. Emerging technologies, such as high-resolution peripheral quantitative computed tomography (HRpQCT), may provide additional insight into microstructural features at sites such as the forearm and tibia that have heretofore not been easily accessible. Using HRpQCT, we determined cortical and trabecular microstructure at the radius and tibia in 51 postmenopausal women with PHPT and 120 controls. Individual trabecula segmentation (ITS) and micro finite element (µFE) analyses of the HRpQCT images were also performed to further understand how the abnormalities seen by HRpQCT might translate into effects on bone strength. Women with PHPT showed, at both sites, decreased volumetric densities at trabecular and cortical compartments, thinner cortices, and more widely spaced and heterogeneously distributed trabeculae. At the radius, trabeculae were thinner and fewer in PHPT. The radius was affected to a greater extent in the trabecular compartment than the tibia. ITS analyses revealed, at both sites, that plate-like trabeculae were depleted, with a resultant reduction in the plate/rod ratio. Microarchitectural abnormalities were evident by decreased plate-rod and plate-plate junctions at the radius and tibia, and rod-rod junctions at the radius. These trabecular and cortical abnormalities resulted in decreased whole bone stiffness and trabecular stiffness. These results provide evidence that in PHPT, microstructural abnormalities are pervasive and not limited to the cortical compartment. They may help to account for increased global fracture risk in PHPT.
Keywords: Primary hyperparathyroidism, high-resolution peripheral quantitative computed tomography, individual trabecula segmentation, finite element analysis, fracture risk
Introduction
Primary hyperparathyroidism (PHPT), a common endocrine disorder, is characterized primarily by hypercalcemia and elevated levels of parathyroid hormone (PTH). Although the disease harbors a potential for extensive destruction of the skeleton, and commonly presented in this way during the first several decades of its description (1), asymptomatic PHPT has become the predominant form of the disease since the 1970s (2–4). Typically, in this milder form of PHPT, bone density by dual energy X-ray absorptiometry (DXA) is reduced with a proclivity for greatest reduction at the 1/3 radius, a site of cortical bone. By DXA, the lumbar spine, a site comprised predominantly of cancellous bone, tends to be preserved and similar to age-matched control subjects (5). Histomorphometric and micro-computed tomography (µCT) analyses of iliac crest bone biopsies have confirmed these DXA results by specific measurements of cortical and trabecular compartments. Cortical width is reduced and cortical porosity is increased. Trabecular bone volume is above average while trabecular number, connectivity and separation are preserved (6–10). However, these results are not consistent with evidence from many different studies demonstrating increased fracture risk at both vertebral and non-vertebral sites in PHPT (11–14). While the fracture data are still incomplete, the likelihood of overall increased fracture risk would argue, on the one hand, that DXA is not accurately depicting microstructure of bone due to its limited resolving power, and on the other hand, that the bone biopsy data from the iliac crest, in which the microstructure of bone is easily depicted, is not representative of load-bearing sites or other sites that are predisposed to fracture. Occasional reports of reduced trabecular bone density in PHPT (15, 16) argue that trabecular bone, clearly a potential target in severe disease, might also be affected in more mild disease and that more highly resolved technologies that can be applied to sites of loaded and unloaded bone would be revealing.
High resolution, noninvasive imaging methods, enabling in vivo assessment of cortical and trabecular bone microarchitecture and biomechanical competence, could provide additional insight into compartment-specific (trabecular vs cortical) effects of PTH in PHPT and be more pertinent to the clinical discussion of fracture risk in PHPT. To this end, High Resolution peripheral Quantitative Computed Tomography (HRpQCT), a non-invasive technique has sufficient resolution (voxel size, 82 µm) to quantitate trabecular and cortical microstructure that previously could be assessed only in bone biopsy samples. Moreover, HRpQCT has been developed to visualize the microstructure of the distal radius, an unloaded site, and the distal tibia, a loaded site. Strong correlations between microarchitecture assessed by HRpQCT and histomorphometry or µCT at the same bony regions have been demonstrated (17, 18). This technology further distinguishes subjects who have sustained vertebral and non-vertebral fractures from normal controls (19–23), and detects changes in bone microstructure related to aging or other causes of bone loss (24–26). Recently, Hansen et al observed, by HRpQCT, altered trabecular and cortical structure at the radius in PHPT, and improvement in volumetric density and bone microarchitecture following parathyroidectomy (27, 28). This report supports the idea that if sites more relevant to fracture risk in PHPT are measured with highly resolved technologies, abnormalities in trabecular bone can be observed.
In addition to assessing microstructure, HRpQCT images can be used to measure mechanical competence of bone by microstructural finite-element analysis (µFEA) (29). Recent advances have demonstrated that individual trabecula segmentation (ITS)-based morphologic analysis of HRpQCT images can provide even more specific information about trabecular bone microachitecture. ITS resolves the HRpQCT image into individual trabeculae, characterizing trabecular elements as either plates or rods. Plate-like trabeculae are the primary determinants of bone strength; a higher plate/rod ratio is associated with greater strength (30, 31). µFE and ITS analyses of HRpQCT images distinguish among individuals with and without osteoporosis and fragility fractures, independent of DXA measurements (23, 32–35). ITS analyses of HRpQCT images have also demonstrated key differences between the Caucasian American and Chinese American skeleton, helping to account for reduced fracture risk in Chinese women despite similar bone mineral densities (36).
In this study, we have utilized HRpQCT to determine microstructural indices of cortical and trabecular compartments at the radius and tibia in 51 postmenopausal women with PHPT and 120 normal controls. We have also utilized µFE and, for the first time, ITS analyses of HRpQCT images to assess trabecular morphology and bone compartment-specific mechanical competence in PHPT. The results of this study provide new insights into bone quality in postmenopausal women with PHPT.
Patients and Methods
Study Subjects
51 postmenopausal community-dwelling women, with well-characterized PHPT (elevated serum calcium and abnormal PTH levels) were recruited from Columbia University Medical Center (CUMC) in New York. The 120 control individuals were healthy postmenopausal women selected independently of their areal bone mineral density by DXA, also recruited from CUMC by advertisement, self or physician referral. All control subjects had normal serum calcium levels and no history of PHPT or low trauma fracture. Exclusion criteria included significant use of glucocorticoids within the past 2 years, history of Cushing’s syndrome, uncontrolled thyroid disease, malabsorption syndrome, significant liver disease, creatinine clearance < 30 mL/min, and any chronic disorders of mineral metabolism such as Paget’s disease or osteogenesis imperfecta. Use of bisphosphonates, raloxifene, and hormone replacement therapy (HRT) were not an exclusionary criterion. Women were considered postmenopausal if they had not had a menstrual period for over 1 year.
The study was approved by the Institutional Review Board of Columbia University Medical Center, and all subjects gave written informed consent.
Dual-energy X-ray absorptiometry (DXA)
Areal bone mineral density (aBMD) was measured at the lumbar spine (L1–L4), total hip, femoral neck, and nondominant forearm [ultradistal (UD radius) and one-third radius (1/3 radius)] by DXA (Hologic 4500A; Hologic Inc., Bedford, MA, USA). Short term, in vivo precision error was 0.5% for L1–L4, 1.5% for total hip and femoral neck, and 1% for the forearm.
HRpQCT
The nondominant distal radius and tibia were measured using the HRpQCT system (Xtreme CT; Scanco Medical AG, Brüttisellen, Switzerland) at CUMC. This device uses a 2D detector array and a 0.08-mm point-focus X-ray tube enabling the simultaneous acquisition of a stack of a parallel CT slices with a nominal resolution (voxel size) of 82µm. The following settings were used: effective energy of 60kVp, x-ray tube current of 900µA, and image matrix size of 1,536 × 1,536.
An antero-posterior scout view was used to define the measurement region. A reference line was manually placed at the end plate of the radius and tibia. A stack of 110 parallel CT slices was acquired (distal to proximal), with the first slice being 9.5 mm proximal to the reference line at the radius and 22.5 mm proximal to the reference line at the tibia. At each skeletal site, a 3D image of approximately 9 mm in the axial direction was obtained. Attenuation data were converted to equivalent hydroxyapatite (HA) densities. For quality control, the manufacturer phantom was scanned daily.
Image analysis has been described and validated (17, 24, 25, 37). Briefly, the entire volume of interest is automatically separated into cortical and trabecular regions by using a threshold-based algorithm. Mean cortical thickness (Ct.Th) is defined as the mean cortical volume divided by the outer bone surface. Cortical and trabecular bone densities (Ct.vBDM and Tb.vBMD) are defined as the average bone density within the cortical or trabecular volume of interest, respectively. Trabecular bone volume (BV/TV) is derived from Tb.vBMD assuming that fully mineralized bone has the density of 1,200 mg hydroxyapatite (HA) per cubic centimeter (BV/TV (%)=100× (Tb.vBMD/1,200). Since the nominal spatial resolution of the XtremeCT (82 µm) is in the range of trabecular dimensions, visualization of individual trabeculae is limited. Therefore, measurements of trabecular microstructure are assessed using a thickness-independent algorithm. To this end, trabecular elements are identified by a mid-axis transformation method and the distance between them is assessed by the distance-transform method. Trabecular number (Tb.N) is taken as the inverse of the mean spacing of the mid-axes. Trabecular thickness (Tb.Th) and trabecular separation (Tb.Sp) are then derived from BV/TV and Tb.N using standard methods of histomorphometry, i.e., Tb.Th=(BV/TV)/Tb.N and Tb.Sp=(1−BV/TV)/Tb.N. Distance transformation techniques also enable the calculation of intra-individual distribution of separation (Tb.Sp.SD), quantified by the SD of the separation, a parameter reflecting the heterogeneity of the trabecular network.
ITS-based morphological analyses of HRpQCT images
The trabecular bone compartment was manually extracted from the cortex of each HRpQCT image of the distal radius and distal tibia. All trabecular bone images were then subjected to ITS-based morphological analyses. A complete volumetric decomposition technique was applied to segment the trabecular network into individual plates and rods (30). Briefly, digital topological analysis (DTA)-based skeletonization is performed to transform the trabecular bone image into a schematic comprised of surfaces and curves skeleton. The topology (i.e, connectivity, tunnels, and cavities), as well as the rod and plate morphology of the trabecular microarchitecture, are preserved. Each skeletal voxel is uniquely classified as either a surface (plate) or a curve (rod) type. Using an iterative reconstruction method, each bone voxel of the original image is classified as belonging to either type of trabecula. ITS parameters of scale evaluate plate and rod bone volume fraction (pBV/TV and rBV/TV), plate and rod number density (pTb.N and rTb.N, 1/mm), plate and rod thickness (pTb.Th and rTb.Th, mm), plate surface area (pTb.S, mm2), and rod length (rTb.ℓ, mm). Plate-to-rod ratio (P-R ratio) was defined as plate bone volume divided by rod bone volume. Trabecular network connectivity is characterized by plate–plate, plate–rod, and rod–rod junction density (P-P, P-R, and R-R Junc.D, 1/mm3), calculated as the total junctions between trabecular plates and rods normalized by the bulk volume. Lastly, the orientation of trabecular bone network is characterized by axial bone volume fraction (aBV/TV), defined as axially aligned bone volume divided by the bulk volume.
µFEA of HRpQCT images
Whole bone and trabecular HRpQCT images of the radius and tibia were converted into micro finite element models. µFEA was then performed to estimate whole bone and trabecular stiffness. For each µFE model, a uniaxial compression test was performed with displacement equivalent to 1% apparent strain to calculate stiffness. Bone tissue was assumed to have an isotropic linear material property with Young’s modulus 15 GPa and Poisson’s ratio 0.3. Whole bone stiffness, defined as reaction force divided by the applied displacement, characterizes the mechanical competence of both cortical and trabecular compartments and is closely related to whole bone strength (38). Similarly, trabecular bone stiffness characterizes the mechanical competence of the trabecular bone compartment. Percent load carried by the cortical compartment at the distal and proximal surface of bone segments was also calculated.
Biochemical analysis
Blood samples were drawn in a fasting state. Serum total calcium and albumin were analyzed using standard methods (Quest Diagnostics, Madison, NJ, USA). Calcium values were corrected for low albumin (albumin < 4 g/dL). In patients with PHPT, intact PTH was measured by immunoradiometric assay (Scantibodies, Santee, CA, USA) in the Bone Marker Laboratory of the Metabolic Bone Diseases Program at CUMC. The normal range was 14 to 66 pg/mL, and the precision inter- and intra-assay coefficients were below 7% and 5%, respectively.
Statistical Analysis
Descriptive statistics and group comparisons are expressed as mean ± SEM. Differences in continuous variables between cases and controls were assessed by Student’s t-test. Dichotomous variables were compared using the chi-square test. Comparisons of percent difference in HRpQCT, ITS and mechanical measurements between cases and controls at the radius and tibia were calculated and then assessed by Student’s t-test for paired samples. Since serum PTH levels and BMI did not follow a normal distribution, the Spearman correlation test was used to estimate their correlation with HRpQCT indices. Finally, comparisons of correlations between groups and between sites were examined by Fisher’s Z transformation (39). All statistical tests were performed at the two-sided 0.05-level of significance. Statistical analysis was performed using SAS, version 9.2 (SAS Institute, Inc., Cary, NC, USA).
Results
Baseline clinical, biochemical and densitometric data of the 51 postmenopausal women with PHPT and 120 controls are described in Table 1. Case and control subjects did not differ on the basis of age, body weight, height, BMI, years since menopause, and current use of HRT and raloxifene. Bisphosphonate use was significantly greater among patients. As expected, serum calcium levels were higher in the PHPT group. The majority of PHPT patients (77%) were asymptomatic. Only 12 subjects had nephrolithiasis (n=6) and/or fragility fracture (n=8).
Table 1.
Baseline clinical, biochemical and densitometric data of 51 PHPT and 120 control subjects:
| Characteristics | PHPT (n=51) | Controls (n=120) | p-value |
|---|---|---|---|
| Age (years) | 70 ± 1 | 68 ± 1 | .20 |
| Weight (kg) | 67 ± 2 | 69 | .37 |
| Height (cm) | 160 ± 1 | 160 ± 1 | .94 |
| BMI (kg/cm2) | 26.0 ± 0.9 | 26.8 ± 0.6 | .42 |
| Years since menopause | 18 ± 2 | 19 ± 1 | .86 |
| Years since diagnosis | 8.4 ± 1.1 | NA | |
| Current medication use (%): | |||
| Bisphosphonate | 20 | 3 | <.0001 |
| HRT | 10 | 6 | .66 |
| Raloxifene | 6 | 4 | .94 |
| Serum total calcium (mg/dL) | 10.6 ± 0.1 | 9.5 ± 0.0 | <.0001 |
| PTH (pg/mL) | 76 ± 6 | ND | |
| L1–L4 BMD (g/cm2) | 0.915 ± 0.024 | 0.931 ± 0.013 | .56 |
| T-score | −1.1 ± 0.2 | −1.2 ± 0.1 | .74 |
| Total hip BMD (g/cm2) | 0.758 ± 0.019 | 0.812 ± 0.019 | .015 |
| T-score | −1.5 ± 0.2 | −1.1 ± 0.1 | .034 |
| Femoral neck BMD (g/cm2) | 0.642 ± 0.017 | 0.668 ± 0.009 | .03 |
| T-score | −1.9 ± 0.2 | −1.7 ± 0.1 | .23 |
| 1/3 radius BMD (g/cm2) | 0.589 ± 0.014 | 0.610 ± 0.007 | .16 |
| T-score | −1.8 ± 0.2 | −1.4 ± 0.1 | .15 |
| UD radius BMD (g/cm2) | 0.338 ± 0.011 | 0.379 ± 0.006 | .0007 |
| T-score | −1.8 ± 0.2 | −1.2 ± 0.1 | .0026 |
NA: not applicable; ND: no data
aBMD by DXA
aBMD was significantly lower in PHPT subjects than in controls at the total hip, femoral neck, and UD radius. Mean aBMD by DXA was similar in PHPT and controls at the lumbar spine and 1/3 radius (Table 1). In the PHPT group, the lumbar spine and total hip T-scores were higher than the T-scores at the femoral neck and both radial sites (Table 1).
HRpQCT standard analysis
As shown in Table 2 and representative 3D images of the radius in Figure 1, PHPT was associated with reduced volumetric densities (vBMD), and altered cortical and trabecular microarchitecture as assessed by HRpQCT.
Table 2.
Bone geometry, density and microarchitecture by HRpQCT in PHPT patients and controls:
| HRpQCT parameters | PHPT (n=51) | Control (n=120) | p-value | |
|---|---|---|---|---|
| Radius | Total Area (cm2) | 236 ± 7 | 224 ± 4 | .09 |
| Total vBMD (mgHA/cm3) | 241 ± 11 | 299 ± 7 | <.0001 | |
| Ct.vBMD (mgHA/cm3) | 801 ± 12 | 851 ± 7 | .0001 | |
| Ct.Th (mm) | 0.595 ± 0.026 | 0.722 ± 0.017 | <.0001 | |
| Tb.vBMD (mgHA/cm3) | 101 ± 6 | 131 ± 4 | <.0001 | |
| Tb.N (1/mm) | 1.53 ± 0.07 | 1.77 ± 0.03 | .003 | |
| Tb.Th (mm) | 0.054 ± 0.001 | 0.061 ± 0.001 | .0001 | |
| Tb.Sp (mm) | 0.711 ± 0.063 | 0.538 ± 0.02 | .01 | |
| Tb.Sp SD (mm) | 0.465 ± 0.070 | 0.271 ± 0.021 | .01 | |
| Tibia | Total Area (cm2) | 690 ± 16 | 662 ± 9 | .13 |
| Total vBMD (mgHA/cm3) | 212 ± 8 | 245 ± 5 | .0003 | |
| Ct.vBMD (mgHA/cm3) | 730 ± 14 | 785 ± 6 | .0005 | |
| Ct.Th (mm) | 0.739 ± 0.040 | 0.874 ± 0.025 | .004 | |
| Tb.vBMD (mgHA/cm3) | 130 ± 5 | 146 ± 3 | .006 | |
| Tb.N (1/mm) | 1.65 ± 0.07 | 1.73 ± 0.03 | .27 | |
| Tb.Th (mm) | 0.067 ± 0.002 | 0.071 ± 0.001 | .13 | |
| Tb.Sp (mm) | 0.613 ± 0.042 | 0.529 ± 0.011 | .06 | |
| Tb.Sp SD (mm) | 0.419 ± 0.069 | 0.257 ± 0.012 | .02 |
Total vBMD= total volumetric bone mineral density; Ct.vBMD= cortical volumetric bone mineral density; Ct.Th= cortical thickness; Tb.vBMD= trabecular volumetric bone mineral density; Tb.N= trabecular number; Tb.Th= trabecular thickness; Tb.Sp= trabecular separation; Tb.Sp.SD= trabecular distribution
Figure 1.
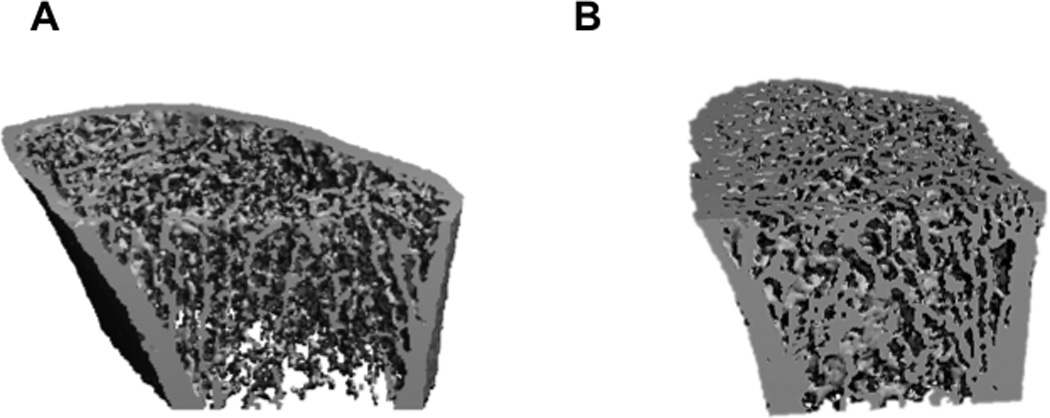
Representative HRpQCT images of the distal radius of PHPT (A) and control (B) subjects
At the radius and tibia, total bone area was not significantly different from control subjects. Total vBMD was significantly lower in PHPT at the radius (−19%) and tibia (−13%). Ct.vBMD and Ct.Th. were 6% and 18% lower at the radius, and 7% and 15% lower at the tibia in PHPT vs control subjects (p<.001 for all). Significant reductions of Tb.vBMD at the radius (−23%) and tibia (−11%) were also observed in PHPT (p<0.01). At the radius, trabecular microarchitectural indices in PHPT were different from controls (p< 0.05) with lower Tb.N (−13%), Tb.Th (−12%) and increased Tb.Sp (+32%). At the tibia, there were no significant differences in Tb.N and Tb.Th between the two groups, but Tb.Sp was higher in PHPT subjects (+16%) (Table 2 and Figure 2).
Figure 2.
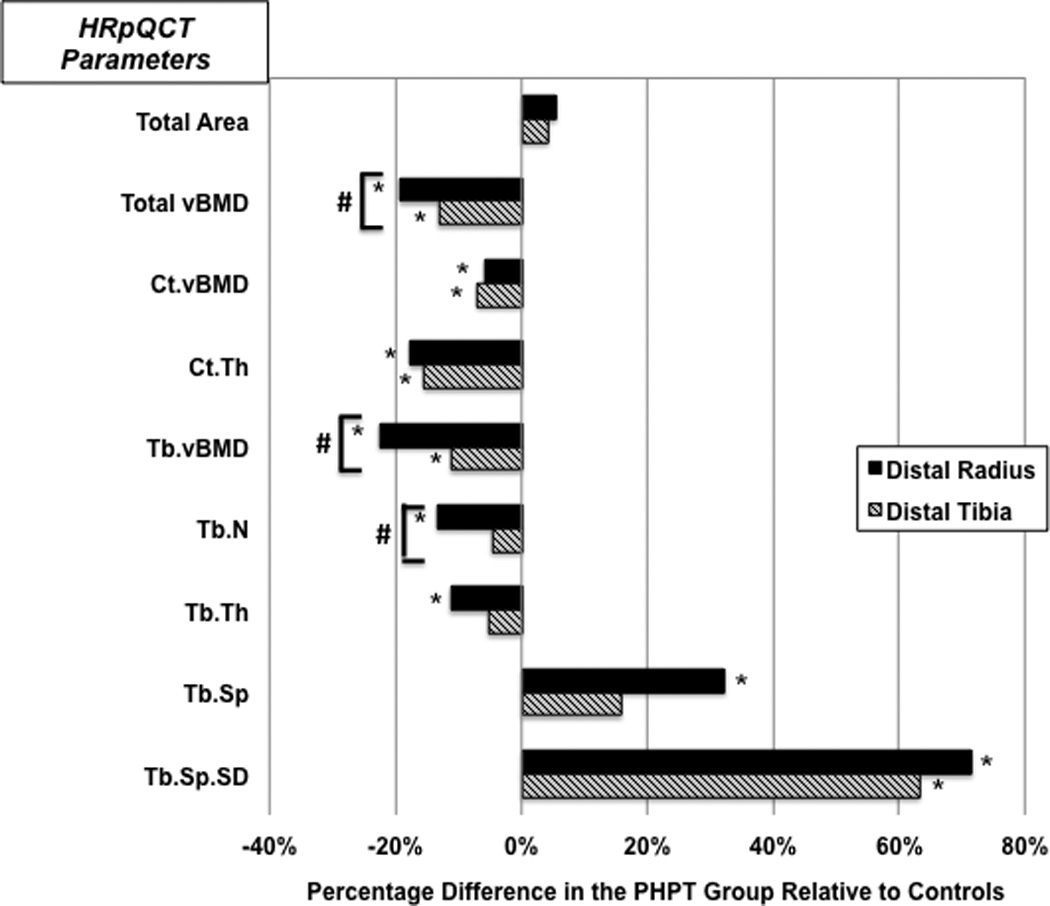
Comparison of HRpQCT results at the distal radius and tibia in PHPT and control groups
* Represent significant differences between groups (p<0.05)
# Represent significant differences for comparisons of the percentage difference between radius and tibia (p<0.05)
Total vBMD= total volumetric bone mineral density; Ct.vBMD= cortical volumetric bone mineral density; Ct.Th= cortical thickness, Tb.vBMD= trabecular volumetric bone mineral density; Tb.N= trabecular number; Tb.Th= trabecular thickness; Tb.Sp= trabecular separation; Tb.Sp.SD= trabecular distribution
As shown in Figure 2, compared to tibial measurements, the percentage differences between cases and controls were more pronounced at the radius for total vBMD (p=0.006), Tb.vBMD (p=0.0004), and Tb.N (p=0.02).
ITS-analysis of HRpQCT images
ITS analysis of the trabecular compartment revealed key microstructural differences at the radius, and, to a lesser extent, at the tibia in PHPT (Table 3 and Figure 3).
Table 3.
ITS and mechanical parameters in PHPT patients and controls:
| ITS and mechanical parameters |
PHPT (n=51) | Control (n=120) | p-value | |
|---|---|---|---|---|
| Radius | pBV/TV (%) | 4.8 ± 0.4 | 6.9 ± 0.3 | .0003 |
| rBV/TV (%) | 14.0 ± 0.6 | 16.1 ± 0.3 | .0005 | |
| P-R ratio | 0.334 ± 0.021 | 0.429 ± 0.019 | .0037 | |
| aBV/TV (%) | 6.1 ± 0.4 | 8.1 ± 0.2 | <.0001 | |
| pTb.N (1/mm) | 1.158 ± 0.030 | 1.296 ± 0.020 | .0002 | |
| rTb.N (1/mm) | 1.720 ± 0.029 | 1.811 ± 0.014 | .0061 | |
| pTb.Th (mm) | 0.204 ± 0.002 | 0.206 ± 0.000 | .3466 | |
| rTb.Th (mm) | 0.212 ± 0.000 | 0.214 ± 0.000 | .0192 | |
| pTb.S (mm2) | 0.135 ± 0.002 | 0.142 ± 0.003 | .0441 | |
| rTb.ℓ (mm2) | 0.710 ± 0.006 | 0.695 ± 0.008 | .1717 | |
| R-R Junc.D (1/mm3) | 2.451 ± 0.124 | 2.831 ± 0.066 | .0042 | |
| P-R Junc.D (1/mm3) | 2.207 ± 0.169 | 2.964 ± 0.109 | .0003 | |
| P-P Junc.D (1/mm3) | 0.966 ± 0.081 | 1.378 ± 0.057 | .0001 | |
| Trab Stiffness (N/mm) | 5,585± 943 | 10,359 ± 734 | .0003 | |
| Stiffness (N/mm) | 54,175 ± 2,845 | 69,567 ± 1,686 | <.0001 | |
| Ctload distal (%) | 50.0 ± 1.5 | 41.8 ± 0.9 | <.0001 | |
| Ctload proximal (%) | 95.3 ± 0.7 | 90.7 ± 0.6 | <.0001 | |
| Tibia | pBV/TV (%) | 9.1 ± 0.5 | 11.4 ± 0.4 | .0006 |
| rBV/TV (%) | 14.3 ± 0.6 | 14.4 ± 0.3 | .8894 | |
| P-R ratio | 0.690 ± 0.046 | 0.852 ± 0.040 | .0086 | |
| aBV/TV (%) | 9.5 ± 0.3 | 11.3 ± 0.3 | .0001 | |
| pTb.N (1/mm) | 1.396 ± 0.022 | 1.475 ± 0.013 | .0017 | |
| rTb.N (1/mm) | 1.762 ± 0.031 | 1.746 ± 0.016 | .6189 | |
| pTb.Th (mm) | 0.216 ± 0.002 | 0.219 ± 0.001 | .06 | |
| rTb.Th (mm) | 0.213 ± 0.001 | 0.218 ± 0.000 | .003 | |
| pTb.S (mm2) | 0.149 ± 0.003 | 0.157 ± 0.003 | .0384 | |
| rTb.ℓ (mm2) | 0.669 ± 0.004 | 0.668 ± 0.006 | .8882 | |
| R-R Junc.D (1/mm3) | 2.549 ± 0.151 | 2.388 ± 0.073 | .338 | |
| P-R Junc.D (1/mm3) | 3.132 ± .0147 | 3.446 ± 0.077 | .0427 | |
| P-P Junc.D (1/mm3) | 1.619 ± 0.072 | 1.894 ± 0.045 | .0014 | |
| Trab Stiffness (N/mm) | 65,372 ± 4,248 | 80,078 ± 2,896 | .0067 | |
| Stiffness (N/mm) | 184,204 ± 6,187 | 205,746 ± 4,061 | .005 | |
| Ctload distal (%) | 30.2 ± 1.2 | 27.5 ± 0.8 | .0649 | |
| Ctload proximal (%) | 72.4 ± 0.01.6 | 70.1 ± 0.8 | .1058 |
pBV/TV= plate bone volume fraction; rBV/TV= rod bone volume fraction; P-R ratio= plate-to-rod ratio; aBV/TV= axial bone volume fraction; pTb.N= plate number density; rTb.N= rod number density; pTb.Th= plate thickness; rTb.Th= rod thickness; pTb.S= plate surface area; rTb.ℓ= rod length; R-R Junc.D= rod–rod junction density; P-R Junc.D= plate-rod junction density; P-P Junc.D= plate–plate junction density, Trab. Stiffness= trabecular stiffness; Stiffness= whole bone stiffness; Ctload distal= cortical load at distal surface; and Ctload proximal= cortical load at proximal surface
Figure 3.
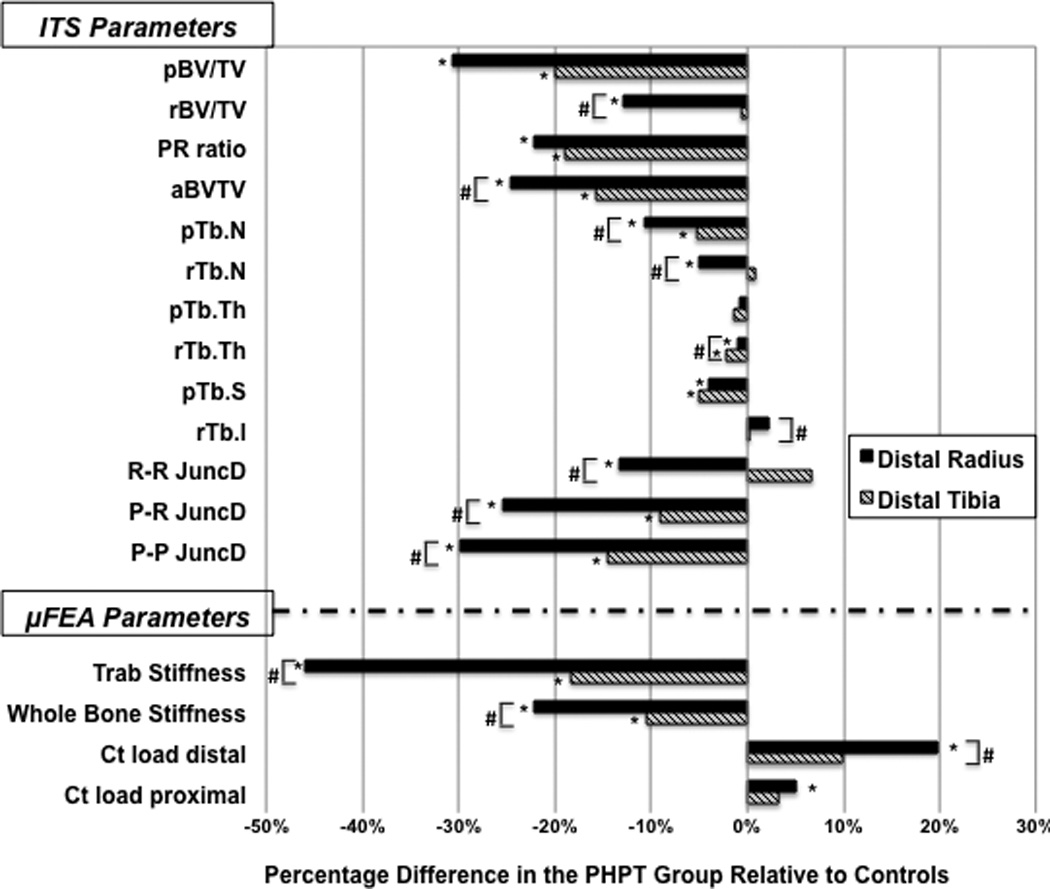
Comparison of the ITS and µFEA results at the distal radius and tibia in PHPT and control groups
* Represent significant differences between the groups (p<0.05)
# Represent significant differences for comparisons of the percentage difference between radius and tibia (p<0.05)
pBV/TV= plate bone volume fraction; rBV/TV= rod bone volume fraction; P-R ratio= plate-to-rod ratio; aBV/TV= axial bone volume fraction; pTb.N= plate number density; rTb.N= rod number density; pTb.Th= plate thickness; rTb.Th= rod thickness; pTb.S= plate surface area; rTb.ℓ= rod length; R-R Junc.D= rod–rod junction density; P-R Junc.D= plate–rod junction density; P-P Junc.D= plate–plate junction density, Trab. Stiffness= trabecular stiffness; Stiffness= whole bone stiffness; Ctload distal= cortical load at distal surface; and Ctload proximal= cortical load at proximal surface
At the radius, plate and rod bone volume fraction (pBV/TV, rBV/TV), plate and rod trabecular number (pTb.N, rTb.N), and plate-rod ratio (P-R ratio) were 31%, 13%, 11%, 5% and 22% lower in PHPT vs. controls, respectively (p<0.01). At the tibia, pBV/TV, pTb.N and P-R ratio were 20%, 5% and 19% lower in PHPT patients, respectively (p<0.01), whereas no significant differences for tibial rBV/TV and rTb.N were found.
The axial bone volume fraction (aBV/TV) was significantly reduced at the radius (−25%), and at the tibia (−16%) in PHPT vs controls. At the radius, rod-to-rod, plate-to-rod and plate-to-plate junction densities (R-R, P-R, and P-P JuncD) were significantly lower in PHPT at 13%, 26%, and 30%, respectively. Similarly, there was a significant decrease in P-R (−9%), and P-P JuncD (−15%) at the tibia in patients with PHPT.
The percentage-differences between cases and controls were again more pronounced at the radius as compared to the tibia for virtually all ITS parameters (Figure 3).
µFEA of HRpQCT images
The differences in volumetric density, cortical and trabecular microstructure were associated with significant changes in bone mechanical properties (Table 3 and Figure 3). Trabecular stiffness was 46% and 18% lower in the PHPT than in the control group at the radius and tibia, respectively. Whole bone stiffness was reduced by 22% at the radius, and 10% at the tibia. At the radius, the percentage of load carried by the cortical compartment was greater in PHPT, at both distal and proximal surfaces, at the radius (Figure 3). The increased percentage of load carried by the cortical compartment observed in PHPT may be explained by the abnormal trabecular microstructure, resulting in a shift in load distribution to the cortical compartment at the radius. At the tibia, since the trabecular abnormalities, although present, were not as great as at the radius, shift in load bearing to the cortical compartment did not differ statistically between groups.
As shown in Figure 3, percentage differences between cases and controls were greater at the radius than at the tibia for trabecular and whole bone stiffness, and for the percentage of load carried by the cortical compartment at the distal surface.
Analysis of the subgroup not on bisphosphonate therapy
Since the use of bisphosphonate was significantly greater among PHPT patients, we verified whether or not bisphosphonate use would change our outcomes. The comparison between cases and controls not currently on bisphosphonate therapy shows reduced volumetric densities, deterioration of microarchitecture by standard HRpQCT and ITS, and decreased bone strength in PHPT patients (data not shown). These results are similar to the ones observed when the whole group was analyzed, indicating that bisphosphonate use did not influence any of the outcome measures.
Relationships between PTH and BMI with Cortical and Trabecular indices
Among subjects with PHPT, serum PTH levels were inversely correlated with total vBMD, Tb.vBMD, and Tb.Th at the radius (r=−0.300, −0.326, −0.407, respectively; p<0.05 for all). At the tibia, significant negative correlations were found between serum PTH and total vBMD (r=−0.354), Ct.vBMD (r=−0.352), and Ct.Th (r=−0.350) (Figure 4). Similarly, at the radius, serum PTH levels correlated inversely and significantly with all ITS and mechanical parameters, except for rTb.N, pTb.S and R-R JuncD. At the tibia, whole bone stiffness, pBV/TV, aBV/TV, pTb.N, rTb.Th, P-P and P-R Junc.D were inversely correlated with serum PTH (p<0.05). In contrast, serum PTH did not show significant correlations with aBMD by DXA at any site (data not shown). Serum calcium was also not correlated with aBMD, vBMD, microstructural parameters or bone stiffness (data not shown).
Figure 4.
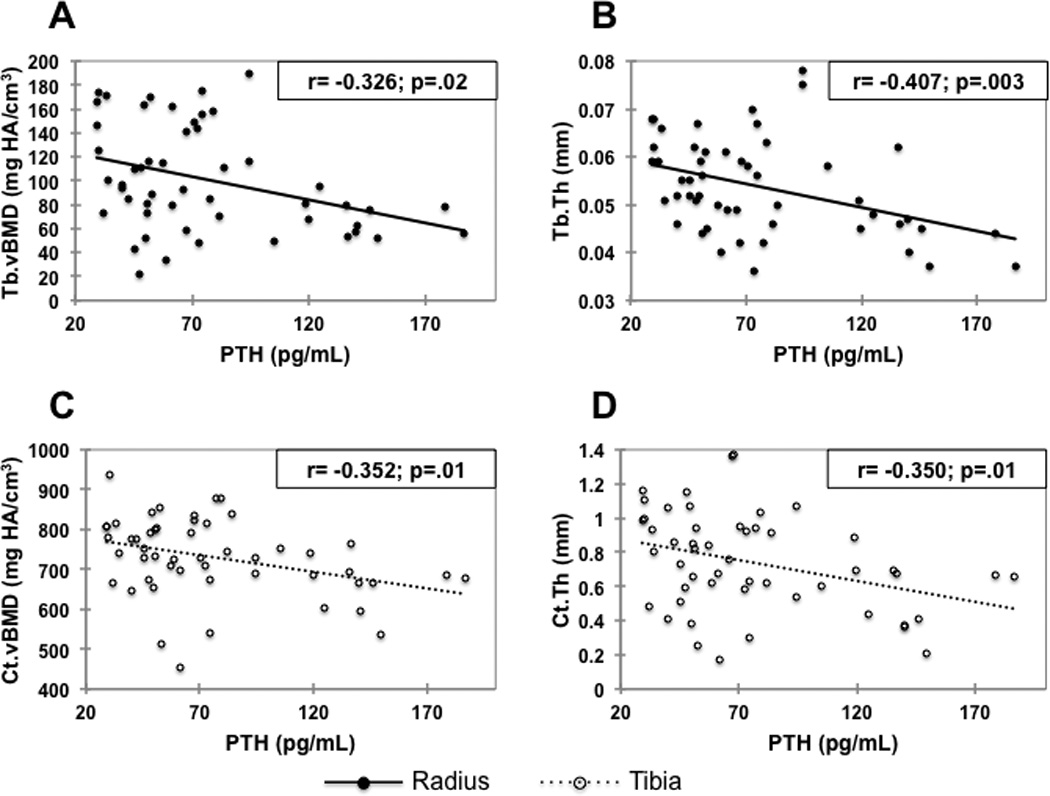
Correlations between PTH and Tb.vBMD (A) and Tb.Th (B) at the radius, and Ct.vBMD (C) and Ct.Th (D) at the tibia, in the PHPT group. Ct.vBMD and Ct.Th at the radius, and Tb.vBMD and Tb.Th at the tibia were not significantly correlated with PTH.
PTH= parathyroid hormone; Tb.vBMD= trabecular volumetric bone mineral density; Tb.Th= trabecular thickness; Ct.vBMD= cortical volumetric bone mineral density; and Ct.Th= cortical thickness.
To evaluate the influence of mechanical loading on trabecular and cortical bone compartments, we examined the relationships between BMI with HRpQCT-derived parameters at the tibia, a load bearing bone, in cases and controls and at the radius, a non-load bearing bone. At the tibia, cortical parameters were positively correlated with BMI in control subjects, whereas in the PHPT group, the correlation between Ct.vBMD and Ct.Th with BMI was not significant. Conversely, correlation coefficients between BMI and HRpQCT for trabecular indices such as Tb vBMD, Tb.N, and Tb.Sp were greater in PHPT (Table 4). The correlation coefficient between BMI and Tb.N at the tibia was significantly higher in the PHPT group (p=0.02 for comparison of correlations). The comparison of these correlations between cases and controls at the radial site did not show such major differences. Correlation coefficients between BMI and cortical HRpQCT indices, in comparison to the radial site, were greater at the tibia in the control group (Table 4). In PHPT, these correlations showed greater dependence upon BMI at the tibia than at the radius with regard to the following indices: Tb.N, Tb.Sp, Tb.Sp.SD, and Tb.vBMD (Table 4).
Table 4.
Correlations (r values) between BMI and HRpQCT parameters at the radius and at the tibia in subjects with PHPT and controls:
| HRpQCT parameters | BMI (kg/m2) | |||
|---|---|---|---|---|
| Radial Comparisons | Tibial Comparisons | |||
| PHPT | Control | PHPT | Control | |
| Total Area (cm2) | 0.031 | 0.053 | 0.205 | 0.079 |
| Total vBMD (mgHA/cm3) | 0.249 | 0.299** | 0.307* | 0.340*** |
| Ct.vBMD (mgHA/cm3) | 0.023 | 0.148 | −0.039 | 0.211* |
| Ct.Th (mm) | 0.210 | 0.289** | 0.158 | 0.341*** |
| Tb.vBMD (mgHA/cm3) | 0.312* | 0.312** | 0.396** | 0.294** |
| Tb.N (1/mm) | 0.287* | 0.309** | 0.533*** | 0.226* |
| Tb.Th (mm) | 0.109 | 0.164 | −0.156 | 0.189 |
| Tb.Sp (mm) | −0.299* | −0.324** | −0.532*** | −0.258* |
| Tb.Sp SD (mm) | −0.295* | −0.328** | −0.487*** | −0.165 |
p<.05 ;
p<.01 ;
p< .001
Discussion
The results of this study signal a major change in analytical approaches to bone strength in PHPT. Previously, DXA and histomorphometric analyses of the iliac crest bone biopsy gave important information but each was limited in either its resolving power (DXA) or in the fact that the iliac crest is not clearly representative of bones at risk in this disease for fracture. With HRpQCT, questions relevant to fracture risk in PHPT can be analyzed with regard to skeletal microstructure and, further, with ITS, a novel approach that allows for specific assignments of microarchitecture based on topological orientation and type of trabeculae. In addition, compartmental analyses of cortical and trabecular bone at a loaded (tibia) or unloaded (radius) site provide new insights into how in PHPT, a disorder of chronic PTH excess, compromised structural integrity is not limited to the cortical skeleton.
At the radius, by HRpQCT, women with PHPT have lower total, cortical, and trabecular densities along with a thinner cortex. Trabecular microarchitecture is affected with fewer, thinner, more widely and heterogeneously distributed trabeculae. At the tibia, these changes are not as widespread but reductions in vBMDs and cortical thickness are evident, along with more widely and heterogeneously distributed trabeculae. In contrast to the radius, no abnormalities at the tibia were appreciated in trabecular number or trabecular thickness.
The catabolic effects of PTH on both cortical and trabecular bone compartments reported here have been observed by peripheral quantitative computed tomography (pQCT) in PHPT (15, 40). While qualitatively similar to our observations, the resolution of pQCT is poor relative to HRpQCT (voxel size: 500–590 µm vs 82 µm) and thus does not permit a detailed compartmental analysis of cortical and trabecular bone. Applying HRpQCT, Hansen et al. (27) recently did show changes at the radius in 26 pre and postmenopausal women with PHPT. These investigators, however, were not able to appreciate significant differences at the tibia, perhaps because of the small number of subjects in their study (only 23 postmenopausal women) and less dramatic changes at the tibial site.
This report provides further insights, not explored previously, into trabecular microstructure at the individual trabecula level by ITS analysis of the HRpQCT images. ITS analysis, developed by Guo and his associates, has been validated for assessing trabecular microarchitecture by significant concordance with µCT (41). In PHPT, we found that plate-like trabeculae are depleted, and that the P-R ratio is reduced. This topological disturbance in microstructure leads to a trabecular network that is abnormal in plate-rod and plate-plate junctions at the radius and tibia, and rod-rod junctions at the radius. With relatively more rods than plates in the trabecular network, µFE analysis indicates that bone strength is compromised in terms of whole bone and trabecular stiffness. While both radial and tibial sites are compromised, greater deficits are seen in the distal radius. Such distortions lead to a significant increase in the load carried by the cortical compartment in the radius. These changes highlight another insight gleaned from this report, namely that with abnormal cortical structure in PHPT, the load carried by this compartment is disproportionately distributed from the trabecular compartment because it too is compromised.
Based upon these findings, the pattern of bone loss in PHPT shown in many studies by DXA needs to be reexamined. The discordant observations of preserved lumbar spine aBMD by DXA and trabecular microstructure abnormalities by HRpQCT could be explained by the DXA technology. As a 2D measure, DXA is influenced by bone size. The increased cross sectional area in patients with PHPT observed by us an others (40, 42–44), which might be a compensatory mechanism or a direct effect of PTH, could have accounted for the apparent preserved aBMD at the lumbar spine. Thus, the preservation of lumbar spine bone density by DXA in PHPT illustrates the uncertainty of this technology if geometric or microstructural abnormalities are present. Even the microstructural data by histomorphometric analysis of iliac crest bone biopsies in PHPT needs to be reexamined in light of these new data. By histomorphometry of bone biopsies from iliac crest, trabecular bone in postmenopausal women with PHPT is preserved as documented by no abnormalities in trabecular number, connectivity, or separation (5–8, 10, 45). In fact, µCT analysis of bone biopsy specimens showed that trabecular bone volume in postmenopausal women with PHPT is increased (9). It is becoming increasing clear, however, that the iliac crest might not be an ideally representative site of the peripheral skeleton. In fact, Cohen et al (46) have found modest or no correlations between microarchitecture parameters as assessed by HRpQCT of radius and tibia and histomorphometry and µCT of iliac crest biopsies. Since previous studies have shown strong correlations between microarchitecture assessed by HRpQCT and histomorphometry or µCT at the same bony regions (17, 18), site-to-site differences are likely to contribute to the weak correlations observed in the study of Cohen et al (46).
Even at peripheral sites, such as the radius and tibia, there are differences to be observed. The differences may well be due to the extent to which a site is loaded (tibia) or unloaded (radius). Deficits in skeletal microstructure were less pronounced at the tibia in other studies (19, 23), perhaps due to positive effects of mechanical loading at this site. We observed greater effects of loading on the cortical bone in normal postmenopausal women than in PHPT patients, as observed by higher correlation coefficients between BMI and cortical indices at the tibia in controls. In PHPT, the effect of loading was also compartment-specific with the trabecular bone affected to a greater extent than cortical bone. In fact, cortical parameters at the tibia were not significantly correlated with BMI, whereas the correlation coefficients between BMI and trabecular measurements were greater in PHPT than in controls. Further supporting the idea that mechanical loading ameliorates catabolic actions of PTH on trabecular bone, we showed that trabecular bone was much more profoundly affected at the distal radius than at the tibia, whereas cortical bone was equally affected at the radius and tibia in PHPT. In addition, correlations between PTH and HRpQCT-derived trabecular indices were significant at the radius but not at the tibia, indicating that the negative effects of PTH are blunted at the load-bearing tibial site. These data suggest that mechanical loading does not prevent cortical loss in PHPT, but it may help to counteract the deleterious effects of PTH on trabecular bone. These results provide a framework for understanding that the osteoanabolic action of PTH is not seen in PHPT, a state of chronic PTH excess, but rather is limited to the intermittent administration of the hormone when used as a therapeutic for osteoporosis.
These observations have implications for assessment of fracture risk in PHPT. The HRpQCT analysis that we have conducted suggests that there is a biomechanical basis for increased fracture risk in this disease. While studies of fracture risk in PHPT are by no means definitive, the cumulative experience suggests that both the central (trabecular) and peripheral (cortical) skeleton are at risk. If HRpQCT analyses correlate with fracture risk, then the clinical observations of fracture risk in PHPT and the detailed microstructural observations of this study are consistent. In fact, previous studies have correlated HRpQCT-based abnormalities in skeletal microstructure with fracture risk in postmenopausal women (19–23, 34, 35). Similarly, reductions in plate and rod BV/TV, plate and rod trabecular number, less axially aligned trabecular network, and reduced connectivity between plate-plate, and plate-rod like trabeculae by ITS-analysis of HRpQCT scans, all of which have been demonstrated in this study, have been described in postmenopausal women with fragility fractures (32). In several of these studies, deterioration of skeletal microstructure could distinguish between women with and without fractures even after adjusting for aBMD or T-score by DXA (19, 23, 32). Moreover, in the study by Pistoia et al (47), the correlation between bone strength (mechanically measured) and failure load predicted by 3DpQCT-based µFEA was stronger than its correlation with aBMD assessed by DXA. Our subjects with PHPT have similar deficiencies in skeletal microstructure and stiffness to those observed in postmenopausal women with fractures. Thus, the data provide a biomechanical mechanism to account for increased fracture risk in PHPT.
This study has some limitations. Only postmenopausal women were studied so that it is not known whether the results are applicable to men or premenopausal women with PHPT. Our study was not designed to assess differences between patients with or without fractures within the PHPT group. It remains to be seen whether these abnormalities will be appreciated to a greater extent among those who have sustained a fracture. The cross-sectional design prevented us from investigating whether or not the microstructural abnormalities at cortical and tibial sites as measured by HRpQCT will worsen over time in patients with PHPT and, if so, whether there are predictive features to this expectation. We have not yet studied subjects after parathyroidectomy in comparison to these preoperative, baseline data. HRpQCT is an analytical device that measures only peripheral sites, and, thus, it is possible that our findings will not reflect central sites such as the lumbar spine. This is unlikely in view of the recent study by Liu et al (48) in which volumetric density, bone microstructure and mechanical properties of peripheral sites as determined by HRpQCT correlated significantly with mechanical competence of the spine and hip.
Despite these limitations, our study has important strengths. The analytical power of HRpQCT applied to sites of great relevance to fracture risk is noteworthy. The added analytical power of ITS with µFEA provides another dimension not previously examined in this disease. The data provide greater understanding of biomechanical compromise in PHPT, helping to resolve a previous conundrum in which preserved trabecular bone by DXA or by histomorphometric studies of the iliac crest were not consistent with the clinical observations of increased fracture risk in PHPT. Further studies are likely to provide even greater insights into microstructural features of bone in PHPT and permit greater understanding of fracture risk in this disease.
Acknowledgments
All authors met guidelines for authorship: Study design (JPB, DJM), Study conduct (EMS, BCS, JPB, JU, MR, NC, DI, AGC, ED, SC), Data analysis (BCS, CZ, DM, BZ, JW), Data interpretation (BCS, EMS, JPB, ES, NC, XEG, SB), Drafting the manuscript (BCS and JPB), Revising manuscript content (all authors), Approving final version of manuscript (all authors).
Supported in part by the following NIH grants: DK32333, UL1 RR024156, K24 AR052665 (E. Shane), AR 055068, AR058004, AR051376, K23 DK 084337 (EM. Stein), K23 DK 095944 (N Cusano), and the Brazilian National Council of Technological and Scientific Development – CNPq (BC Silva).
Footnotes
Disclosures:
The authors state that they have no conflicts of interest
References
- 1.Cope O. The study of hyperparathyroidism at the Massachusetts General Hospital. N Engl J Med. 1966;274(21):1174–1182. doi: 10.1056/NEJM196605262742105. Epub 1966/05/26. [DOI] [PubMed] [Google Scholar]
- 2.Rubin MR, Bilezikian JP, McMahon DJ, Jacobs T, Shane E, Siris E, et al. The natural history of primary hyperparathyroidism with or without parathyroid surgery after 15 years. J Clin Endocrinol Metab. 2008;93(9):3462–3470. doi: 10.1210/jc.2007-1215. Epub 2008/06/12. [pii] 10.1210/jc.2007-1215. [DOI] [PMC free article] [PubMed] [Google Scholar]
- 3.Silverberg SJ, Shane E, Jacobs TP, Siris E, Bilezikian JP. A 10-year prospective study of primary hyperparathyroidism with or without parathyroid surgery. N Engl J Med. 1999;341(17):1249–1255. doi: 10.1056/NEJM199910213411701. Epub 1999/10/21. [DOI] [PubMed] [Google Scholar]
- 4.Bilezikian JP, Brandi ML, Rubin M, Silverberg SJ. Primary hyperparathyroidism: new concepts in clinical, densitometric and biochemical features. J Intern Med. 2005;257(1):6–17. doi: 10.1111/j.1365-2796.2004.01422.x. Epub 2004/12/21. [pii] 10.1111/j.1365-2796.2004.01422.x. [DOI] [PubMed] [Google Scholar]
- 5.Silverberg SJ, Shane E, de la Cruz L, Dempster DW, Feldman F, Seldin D, et al. Skeletal disease in primary hyperparathyroidism. Journal of bone and mineral research : the official journal of the American Society for Bone and Mineral Research. 1989;4(3):283–291. doi: 10.1002/jbmr.5650040302. Epub 1989/06/01. [DOI] [PubMed] [Google Scholar]
- 6.Parisien M, Cosman F, Mellish RW, Schnitzer M, Nieves J, Silverberg SJ, et al. Bone structure in postmenopausal hyperparathyroid, osteoporotic, and normal women. Journal of bone and mineral research : the official journal of the American Society for Bone and Mineral Research. 1995;10(9):1393–1399. doi: 10.1002/jbmr.5650100917. Epub 1995/09/01. [DOI] [PubMed] [Google Scholar]
- 7.Parisien M, Mellish RW, Silverberg SJ, Shane E, Lindsay R, Bilezikian JP, et al. Maintenance of cancellous bone connectivity in primary hyperparathyroidism: trabecular strut analysis. Journal of bone and mineral research : the official journal of the American Society for Bone and Mineral Research. 1992;7(8):913–919. doi: 10.1002/jbmr.5650070808. Epub 1992/08/01. [DOI] [PubMed] [Google Scholar]
- 8.Parisien M, Silverberg SJ, Shane E, de la Cruz L, Lindsay R, Bilezikian JP, et al. The histomorphometry of bone in primary hyperparathyroidism: preservation of cancellous bone structure. J Clin Endocrinol Metab. 1990;70(4):930–938. doi: 10.1210/jcem-70-4-930. Epub 1990/04/01. [DOI] [PubMed] [Google Scholar]
- 9.Dempster DW, Muller R, Zhou H, Kohler T, Shane E, Parisien M, et al. Preserved three-dimensional cancellous bone structure in mild primary hyperparathyroidism. Bone. 2007;41(1):19–24. doi: 10.1016/j.bone.2007.03.020. Epub 2007/05/11. [pii] 10.1016/j.bone.2007.03.020. [DOI] [PMC free article] [PubMed] [Google Scholar]
- 10.Uchiyama T, Tanizawa T, Ito A, Endo N, Takahashi HE. Microstructure of the trabecula and cortex of iliac bone in primary hyperparathyroidism patients determined using histomorphometry and node-strut analysis. J Bone Miner Metab. 1999;17(4):283–288. doi: 10.1007/s007740050096. Epub 1999/11/27. [DOI] [PubMed] [Google Scholar]
- 11.Khosla S, Melton LJ, 3rd, Wermers RA, Crowson CS, O'Fallon W, Riggs B. Primary hyperparathyroidism and the risk of fracture: a population-based study. Journal of bone and mineral research : the official journal of the American Society for Bone and Mineral Research. 1999;14(10):1700–1707. doi: 10.1359/jbmr.1999.14.10.1700. Epub 1999/09/22. [pii] 10.1359/jbmr.1999.14.10.1700. [DOI] [PubMed] [Google Scholar]
- 12.Vignali E, Viccica G, Diacinti D, Cetani F, Cianferotti L, Ambrogini E, et al. Morphometric vertebral fractures in postmenopausal women with primary hyperparathyroidism. J Clin Endocrinol Metab. 2009;94(7):2306–2312. doi: 10.1210/jc.2008-2006. Epub 2009/04/30. [pii] 10.1210/jc.2008-2006. [DOI] [PMC free article] [PubMed] [Google Scholar]
- 13.Yu N, Donnan PT, Flynn RW, Murphy MJ, Smith D, Rudman A, et al. Increased mortality and morbidity in mild primary hyperparathyroid patients. The Parathyroid Epidemiology and Audit Research Study (PEARS) Clin Endocrinol (Oxf) 2010;73(1):30–34. doi: 10.1111/j.1365-2265.2009.03766.x. Epub 2009/12/31. [pii] 10.1111/j.1365-2265.2009.03766.x. [DOI] [PubMed] [Google Scholar]
- 14.Vestergaard P, Mosekilde L. Fractures in patients with primary hyperparathyroidism: nationwide follow-up study of 1201 patients. World journal of surgery. 2003;27(3):343–349. doi: 10.1007/s00268-002-6589-9. Epub 2003/02/28. [DOI] [PubMed] [Google Scholar]
- 15.Charopoulos I, Tournis S, Trovas G, Raptou P, Kaldrymides P, Skarandavos G, et al. Effect of primary hyperparathyroidism on volumetric bone mineral density and bone geometry assessed by peripheral quantitative computed tomography in postmenopausal women. J Clin Endocrinol Metab. 2006;91(5):1748–1753. doi: 10.1210/jc.2005-2102. Epub 2006/02/24. [DOI] [PubMed] [Google Scholar]
- 16.Silverberg SJ, Locker FG, Bilezikian JP. Vertebral osteopenia: a new indication for surgery in primary hyperparathyroidism. J Clin Endocrinol Metab. 1996;81(11):4007–4012. doi: 10.1210/jcem.81.11.8923852. Epub 1996/11/01. [DOI] [PubMed] [Google Scholar]
- 17.Boutroy S, Vilayphiou N, Roux JP, Delmas PD, Blain H, Chapurlat RD, et al. Comparison of 2D and 3D bone microarchitecture evaluation at the femoral neck, among postmenopausal women with hip fracture or hip osteoarthritis. Bone. 2011;49(5):1055–1061. doi: 10.1016/j.bone.2011.07.037. Epub 2011/08/23. [DOI] [PubMed] [Google Scholar]
- 18.MacNeil JA, Boyd SK. Accuracy of high-resolution peripheral quantitative computed tomography for measurement of bone quality. Medical engineering & physics. 2007;29(10):1096–1105. doi: 10.1016/j.medengphy.2006.11.002. Epub 2007/01/19. [DOI] [PubMed] [Google Scholar]
- 19.Sornay-Rendu E, Boutroy S, Munoz F, Delmas PD. Alterations of cortical and trabecular architecture are associated with fractures in postmenopausal women, partially independent of decreased BMD measured by DXA: the OFELY study. Journal of bone and mineral research : the official journal of the American Society for Bone and Mineral Research. 2007;22(3):425–433. doi: 10.1359/jbmr.061206. Epub 2006/12/22. [DOI] [PubMed] [Google Scholar]
- 20.Vico L, Zouch M, Amirouche A, Frere D, Laroche N, Koller B, et al. High-resolution pQCT analysis at the distal radius and tibia discriminates patients with recent wrist and femoral neck fractures. Journal of bone and mineral research : the official journal of the American Society for Bone and Mineral Research. 2008;23(11):1741–1750. doi: 10.1359/jbmr.080704. Epub 2008/07/31. [DOI] [PubMed] [Google Scholar]
- 21.Stein EM, Liu XS, Nickolas TL, Cohen A, McMahon DJ, Zhou B, et al. Microarchitectural Abnormalities Are More Severe in Postmenopausal Women with Vertebral Compared to Nonvertebral Fractures. J Clin Endocrinol Metab. 2012 doi: 10.1210/jc.2012-1968. Epub 2012/07/24. [DOI] [PMC free article] [PubMed] [Google Scholar]
- 22.Stein EM, Liu XS, Nickolas TL, Cohen A, Thomas V, McMahon DJ, et al. Abnormal microarchitecture and stiffness in postmenopausal women with ankle fractures. J Clin Endocrinol Metab. 2011;96(7):2041–2048. doi: 10.1210/jc.2011-0309. Epub 2011/04/22. [DOI] [PMC free article] [PubMed] [Google Scholar]
- 23.Stein EM, Liu XS, Nickolas TL, Cohen A, Thomas V, McMahon DJ, et al. Abnormal microarchitecture and reduced stiffness at the radius and tibia in postmenopausal women with fractures. Journal of bone and mineral research : the official journal of the American Society for Bone and Mineral Research. 2010;25(12):2572–2581. doi: 10.1002/jbmr.152. Epub 2010/06/22. [DOI] [PMC free article] [PubMed] [Google Scholar]
- 24.Boutroy S, Bouxsein ML, Munoz F, Delmas PD. In vivo assessment of trabecular bone microarchitecture by high-resolution peripheral quantitative computed tomography. J Clin Endocrinol Metab. 2005;90(12):6508–6515. doi: 10.1210/jc.2005-1258. Epub 2005/09/29. [DOI] [PubMed] [Google Scholar]
- 25.Khosla S, Riggs BL, Atkinson EJ, Oberg AL, McDaniel LJ, Holets M, et al. Effects of sex and age on bone microstructure at the ultradistal radius: a population-based noninvasive in vivo assessment. Journal of bone and mineral research : the official journal of the American Society for Bone and Mineral Research. 2006;21(1):124–131. doi: 10.1359/JBMR.050916. Epub 2005/12/16. [DOI] [PMC free article] [PubMed] [Google Scholar]
- 26.Bacchetta J, Boutroy S, Vilayphiou N, Juillard L, Guebre-Egziabher F, Rognant N, et al. Early impairment of trabecular microarchitecture assessed with HR-pQCT in patients with stage II–IV chronic kidney disease. Journal of bone and mineral research : the official journal of the American Society for Bone and Mineral Research. 2010;25(4):849–857. doi: 10.1359/jbmr.090831. Epub 2009/09/25. [DOI] [PubMed] [Google Scholar]
- 27.Hansen S, Beck Jensen JE, Rasmussen L, Hauge EM, Brixen K. Effects on bone geometry, density, and microarchitecture in the distal radius but not the tibia in women with primary hyperparathyroidism: A case-control study using HR-pQCT. Journal of bone and mineral research : the official journal of the American Society for Bone and Mineral Research. 2010;25(9):1941–1947. doi: 10.1002/jbmr.98. Epub 2010/05/26. [DOI] [PubMed] [Google Scholar]
- 28.Hansen S, Hauge EM, Rasmussen L, Jensen JE, Brixen K. Parathyroidectomy improves bone geometry and microarchitecture in female patients with primary hyperparathyroidism. A 1-year prospective controlled study using high resolution peripheral quantitative computed tomography. Journal of bone and mineral research : the official journal of the American Society for Bone and Mineral Research. 2012 doi: 10.1002/jbmr.1540. Epub 2012/01/10. [DOI] [PubMed] [Google Scholar]
- 29.Liu XS, Zhang XH, Sekhon KK, Adams MF, McMahon DJ, Bilezikian JP, et al. High-resolution peripheral quantitative computed tomography can assess microstructural and mechanical properties of human distal tibial bone. Journal of bone and mineral research : the official journal of the American Society for Bone and Mineral Research. 2010;25(4):746–756. doi: 10.1359/jbmr.090822. Epub 2009/09/25. [DOI] [PMC free article] [PubMed] [Google Scholar]
- 30.Liu XS, Sajda P, Saha PK, Wehrli FW, Bevill G, Keaveny TM, et al. Complete volumetric decomposition of individual trabecular plates and rods and its morphological correlations with anisotropic elastic moduli in human trabecular bone. Journal of bone and mineral research : the official journal of the American Society for Bone and Mineral Research. 2008;23(2):223–235. doi: 10.1359/JBMR.071009. Epub 2007/10/03. [DOI] [PMC free article] [PubMed] [Google Scholar]
- 31.Liu XS, Bevill G, Keaveny TM, Sajda P, Guo XE. Micromechanical analyses of vertebral trabecular bone based on individual trabeculae segmentation of plates and rods. Journal of biomechanics. 2009;42(3):249–256. doi: 10.1016/j.jbiomech.2008.10.035. Epub 2008/12/23. [DOI] [PMC free article] [PubMed] [Google Scholar]
- 32.Liu XS, Stein EM, Zhou B, Zhang CA, Nickolas TL, Cohen A, et al. Individual trabecula segmentation (ITS)-based morphological analyses and microfinite element analysis of HR-pQCT images discriminate postmenopausal fragility fractures independent of DXA measurements. Journal of bone and mineral research : the official journal of the American Society for Bone and Mineral Research. 2012;27(2):263–272. doi: 10.1002/jbmr.562. Epub 2011/11/11. [DOI] [PMC free article] [PubMed] [Google Scholar]
- 33.Liu XS, Cohen A, Shane E, Stein E, Rogers H, Kokolus SL, et al. Individual trabeculae segmentation (ITS)-based morphological analysis of high-resolution peripheral quantitative computed tomography images detects abnormal trabecular plate and rod microarchitecture in premenopausal women with idiopathic osteoporosis. Journal of bone and mineral research : the official journal of the American Society for Bone and Mineral Research. 2010;25(7):1496–1505. doi: 10.1002/jbmr.50. Epub 2010/03/05. [DOI] [PMC free article] [PubMed] [Google Scholar]
- 34.Boutroy S, Van Rietbergen B, Sornay-Rendu E, Munoz F, Bouxsein ML, Delmas PD. Finite element analysis based on in vivo HR-pQCT images of the distal radius is associated with wrist fracture in postmenopausal women. Journal of bone and mineral research : the official journal of the American Society for Bone and Mineral Research. 2008;23(3):392–399. doi: 10.1359/jbmr.071108. Epub 2007/11/14. [DOI] [PubMed] [Google Scholar]
- 35.Vilayphiou N, Boutroy S, Sornay-Rendu E, Van Rietbergen B, Munoz F, Delmas PD, et al. Finite element analysis performed on radius and tibia HR-pQCT images and fragility fractures at all sites in postmenopausal women. Bone. 2010;46(4):1030–1037. doi: 10.1016/j.bone.2009.12.015. Epub 2010/01/02. [DOI] [PubMed] [Google Scholar]
- 36.Liu XS, Walker MD, McMahon DJ, Udesky J, Liu G, Bilezikian JP, et al. Better skeletal microstructure confers greater mechanical advantages in Chinese-American women versus white women. Journal of bone and mineral research : the official journal of the American Society for Bone and Mineral Research. 2011;26(8):1783–1792. doi: 10.1002/jbmr.378. Epub 2011/02/26. [DOI] [PMC free article] [PubMed] [Google Scholar]
- 37.Laib A, Hauselmann HJ, Ruegsegger P. In vivo high resolution 3D-QCT of the human forearm. Technology and health care : official journal of the European Society for Engineering and Medicine. 1998;6(5–6):329–337. Epub 1999/04/01. [PubMed] [Google Scholar]
- 38.Macneil JA, Boyd SK. Bone strength at the distal radius can be estimated from high-resolution peripheral quantitative computed tomography and the finite element method. Bone. 2008;42(6):1203–1213. doi: 10.1016/j.bone.2008.01.017. Epub 2008/03/25. [DOI] [PubMed] [Google Scholar]
- 39.Fisher RA. Statistical Methods for Research Workers. Fourteenth ed. Hafner Publishing Company; 1970. [Google Scholar]
- 40.Chen Q, Kaji H, Iu MF, Nomura R, Sowa H, Yamauchi M, et al. Effects of an excess and a deficiency of endogenous parathyroid hormone on volumetric bone mineral density and bone geometry determined by peripheral quantitative computed tomography in female subjects. J Clin Endocrinol Metab. 2003;88(10):4655–4658. doi: 10.1210/jc.2003-030470. Epub 2003/10/15. [DOI] [PubMed] [Google Scholar]
- 41.Liu XS, Shane E, McMahon DJ, Guo XE. Individual trabecula segmentation (ITS)-based morphological analysis of microscale images of human tibial trabecular bone at limited spatial resolution. Journal of bone and mineral research : the official journal of the American Society for Bone and Mineral Research. 2011;26(9):2184–2193. doi: 10.1002/jbmr.420. Epub 2011/05/11. [DOI] [PubMed] [Google Scholar]
- 42.Adami S, Braga V, Squaranti R, Rossini M, Gatti D, Zamberlan N. Bone measurements in asymptomatic primary hyperparathyroidism. Bone. 1998;22(5):565–570. doi: 10.1016/s8756-3282(98)00042-8. Epub 1998/05/26. [DOI] [PubMed] [Google Scholar]
- 43.Bilezikian JP. Bone strength in primary hyperparathyroidism. Osteoporosis international : a journal established as result of cooperation between the European Foundation for Osteoporosis and the National Osteoporosis Foundation of the USA. 2003;14(Suppl 5):S113–S115. doi: 10.1007/s00198-003-1482-4. discussion S5–7. Epub 2003/09/25. [DOI] [PubMed] [Google Scholar]
- 44.Parfitt AM. Parathyroid hormone and periosteal bone expansion. Journal of bone and mineral research : the official journal of the American Society for Bone and Mineral Research. 2002;17(10):1741–1743. doi: 10.1359/jbmr.2002.17.10.1741. Epub 2002/10/09. [DOI] [PubMed] [Google Scholar]
- 45.Christiansen P, Steiniche T, Vesterby A, Mosekilde L, Hessov I, Melsen F. Primary hyperparathyroidism: iliac crest trabecular bone volume, structure, remodeling, and balance evaluated by histomorphometric methods. Bone. 1992;13(1):41–49. doi: 10.1016/8756-3282(92)90360-9. Epub 1992/01/01. [DOI] [PubMed] [Google Scholar]
- 46.Cohen A, Dempster DW, Muller R, Guo XE, Nickolas TL, Liu XS, et al. Assessment of trabecular and cortical architecture and mechanical competence of bone by high-resolution peripheral computed tomography: comparison with transiliac bone biopsy. Osteoporosis international : a journal established as result of cooperation between the European Foundation for Osteoporosis and the National Osteoporosis Foundation of the USA. 2010;21(2):263–273. doi: 10.1007/s00198-009-0945-7. Epub 2009/05/21. [DOI] [PMC free article] [PubMed] [Google Scholar]
- 47.Pistoia W, van Rietbergen B, Lochmuller EM, Lill CA, Eckstein F, Ruegsegger P. Estimation of distal radius failure load with micro-finite element analysis models based on three-dimensional peripheral quantitative computed tomography images. Bone. 2002;30(6):842–848. doi: 10.1016/s8756-3282(02)00736-6. Epub 2002/06/08. [DOI] [PubMed] [Google Scholar]
- 48.Liu XS, Cohen A, Shane E, Yin PT, Stein EM, Rogers H, et al. Bone density, geometry, microstructure, and stiffness: Relationships between peripheral and central skeletal sites assessed by DXA, HR-pQCT, and cQCT in premenopausal women. Journal of bone and mineral research : the official journal of the American Society for Bone and Mineral Research. 2010;25(10):2229–2238. doi: 10.1002/jbmr.111. Epub 2010/05/26. [DOI] [PMC free article] [PubMed] [Google Scholar]