

Abstract
Objective
A double-blind, randomized, controlled study to determine if combined use of interferon beta-1a (IFN) 30ug IM weekly and glatiramer acetate (GA) 20mg daily is more efficacious than either agent alone in relapsing-remitting multiple sclerosis (RRMS).
Methods
1008 participants were randomized and followed until the last participant enrolled completed 3 yrs. The primary endpoint was reduction in annualized relapse rate utilizing a strict definition of relapse. Secondary outcomes included time to confirmed disability, Multiple Sclerosis Functional Composite (MSFC) score and MRI metrics.
Results
Combination IFN + GA was not superior to the better of the single agents (GA) in risk of relapse. Both the combination therapy and GA were significantly better than IFN in reducing the risk of relapse. The Combination was not better than either agent alone in lessening confirmed EDSS progression or change in MSFC over 36 months. The combination was superior to either agent alone in reducing new lesion activity and accumulation of total lesion volumes. In a post hoc analysis, combination therapy resulted in a higher proportion of participants attaining disease activity free status (DAFS) compared to either single arm; driven by the MRI results.
Interpretation
Combining the two most commonly prescribed therapies for MS did not produce a significant clinical benefit over three years. An effect was seen on some MRI metrics. In a test of comparative efficacy, GA was superior to IFN in reducing the risk of exacerbation. The extension phase for CombiRx will address if the observed differences in MRI and DAFS findings predict later clinical differences.
Introduction
Multiple sclerosis (MS) is an inflammatory, demyelinating and degenerative disease of the central nervous system for which disease modifying therapies have been available since 19931,2. There are currently nine distinct marketed entities, representing six different therapeutic strategies, all immunomodulatory3.
As additional agents undergo testing in MS, it seems likely that no single therapy will have the desired combination of efficacy sufficient to eliminate all disease activity, and the short and long term safety profiles expected for chronic disease management. One reasonable approach to this problem is combination therapy4. The concurrent use of two effective drugs with different mechanisms of action could have an additive or synergistic benefit without additional side effects. Interferon beta-1a (IFN) and glatiramer acetate (GA) are an obvious choice for combination therapy, since both have good safety, modest efficacy as monotherapy, probable different mechanisms of action5 and currently remain the most commonly prescribed therapies for relapsing-remitting MS (RRMS).
We report here the results of the National Institutes of Health (NIH) sponsored CombiRx trial which tests the combination of IFN and GA in RRMS utilizing a design to answer important demographic, epidemiologic and prognostic questions beyond the primary outcome.
Participants and Methods
CombiRx was a 3-arm, randomized, double-blind, placebo-controlled, multi-center, phase-III trial of combination therapy utilizing a partial 2×2 factorial design with a 2:1:1 randomization allocation (Figure 1) to combination IFN + GA or each single agent with matching placebo. There was no placebo IFN + placebo GA treatment arm; all participants received at least one active agent. All participants who completed the core study were followed for a minimum of 3 years and up to 7 years, if they entered into the extension phase of the trial (Figure 1). A detailed description of the study and the baseline characteristics of the participants were previously reported6. Here we provide the results of the three year core study.
Figure 1.
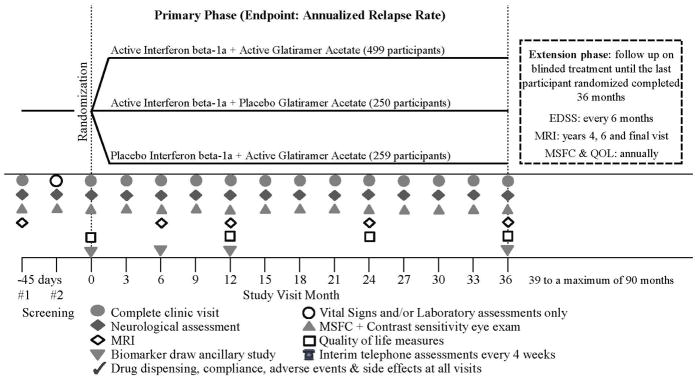
CombiRx Design & Trial Assessments
Participants
Participants were between the ages of 18–60, with an Expanded Disability Status Scale (EDSS) score 0–5.5, diagnosis of RRMS by Poser or McDonald criteria, with at least 2 exacerbations in the prior three years where one exacerbation could be an MRI change meeting the 2001 McDonald MRI criteria for dissemination in time (Tables 1 & 2)7. Exclusion of prior history of seizure activity was added under Amendment 1 of the protocol.
Table 1.
Baseline Characteristics of Participants
| Treatment Group | ||||
|---|---|---|---|---|
| Demographics | IFN + GA (N=499) | IFN (N=250) | GA (N=259) | All (N=1008) |
| Sex, Female, N (%) | 372 (74.6) | 173 (69.2) | 185 (71.4) | 730 (72.4) |
| Race, White, N (%) | 440 (88.2) | 212 (84.8) | 234 (90.3) | 886 (87.9) |
| Ethnicity, Non-Hispanic/Non-Latino, N(%) | 446 (89.4) | 225 (90.0) | 237 (91.5) | 908 (90.1) |
| Age (years)a | ||||
| Mean (SD)a | 37.1 (9.4) | 37.6 (10.2) | 39.0 (9.5) | 37.7 (9.7) |
| Median (range) | 37 (18–61)b | 37.5 (18–60) | 38 (19–60) | 37 (18–61) |
| Clinical characteristics | ||||
| Duration of disease (years), Mean (SD) | 1.1 (3.1) | 1.4 (4.0) | 1.0 (2.9) | 1.2 (3.3) |
| Relapses in Prior 3 Years, Mean (SD) | 2.4 (0.8) | 2.6 (1.2) | 2.4 (0.9) | 2.4 (1.0) |
| Relapses in prior 12 months, Mean (SD) | 1.7 (0.7) | 1.7 (0.9) | 1.6 (0.7) | 1.7 (0.8) |
| EDSS Score, Mean (SD) | 1.9 (1.2) | 2.0 (1.2) | 1.9 (1.2) | 2.0 (1.2) |
mean age: IFN+GA vs GA, p = 0.025
Participant 61 years old admitted on protocol exception
Table 2.
Baseline MRI Characteristics
| Treatment Group | ||||
|---|---|---|---|---|
| IFN + GA (N=499) | IFN (N=250) | GA (N=259) | All (N=1008) | |
| Z4 composite score (SD) | −0.1 (2.7) | −0.1 (2.7) | 0.3 (3.1) | 0 |
| With gadolinium enhancing lesions, N (%) | 189 (37.9) | 104 (41.6) | 106 (40.9) | 399 (39.6) |
| Number of enhancements, Mean (SD) | 4.4 (4.9) | 4.1 (5.5) | 4.6 (7.6) | 4.3 (5.8) |
| Median (range) | 3 (1–39) | 3 (1–41) | 2 (1–41) | 3 (1–41) |
| Volume Mean (SD) mL | 0.3 (0.4) | 0.3 (0.5) | 0.3 (0.7) | 0.3 (0.5) |
| Volume Median (range) mL | 0.1 (0.003–2.6) | 0.1 (0.003–3.4) | 0.1 (0.003–4.3) | 0.1 (0.003–4.3) |
| Total Lesion Volume, mL | ||||
| Mean (SD) | 12.1 (13.5) | 11.7 (12.2) | 12.9 (13.7) | 12.2 (13.2) |
| Median (range) | 7.0 (0.1–87.4) | 7.6 (0.4–79.5) | 7.8 (0.4–73.5) | 7.5 (0.1–87.4) |
| T1-hypointense lesion component volume, mL | ||||
| Mean (SD) | 1.6 (2.1) | 1.6 (2.0) | 1.9 (2.5) | 1.7 (2.2) |
| Median (range) | 0.85 (0–14.8)a | 0.84 (0.01–13.6) | 0.94 (0.01–15.4) | 0.86 (0–15.4) |
| T2-hyperintense lesion component volume, mL | ||||
| Volume Mean (SD) | 10.5 (11.8) | 10.1 (10.7) | 11.0 (11.6) | 10.5 (11.5) |
| Volume Median (range) | 6.2 (0.1–76.2) | 6.6 (0.4–69.8) | 6.7 (0.3–60.9) | 6.4 (0.1–76.2) |
| Normalized CSF (SD), % | 22.1 (2.2) | 22.2 (2.2) | 22.3 (2.4) | 22.2 (2.3) |
1 participant had 0 T1-hypointense lesion count
Protocol and Procedures
The trial enrolled participants from January 2005 through April 2009, with study follow-up closing in April 2012 when the final participant enrolled completed 36 months on study. The protocol and all 4 amendments received approval by the applicable central or institutional review boards and the NIH appointed study data and safety monitoring committee (DSMC) before site initiation and recruitment of participants. Informed consent was obtained prior to any screening procedures or enrollment.
The trial was conducted in 68 sites, both private practice and academic, in the US and Canada. Participants were consented, screened and if eligible, randomized via a computerized Data Entry System (DES) that masked treatment arm allocation and drug dispensing to participants and all site personnel for the entire duration of the trial period. Participants were randomized using a permuted block design within sites with block sizes of 6 and 12. All participants administered the same number of injections. Interferon-β1a (IFN, Avonex, Biogen-Idec) 30 μg was administered intramuscularly weekly and glatiramer acetate (GA, Copaxone, Teva Pharmaceuticals) 20 mg was administered subcutaneously daily, with matched placebo preparations, for a total of 8 injections per week. Active drug and matched placebo were kindly provided by the respective manufacturers.
After enrollment, participants returned to clinic every 12 weeks for neurological assessments by a treating clinician and an examining clinician, both blinded to treatment assignment. All study sites underwent training before site initiation, and periodic refresher courses in all study procedures including training of any new study evaluators. A standard manual of all trial related procedures was provided and the EDSS scoring sheet had detailed instructions for scoring the functional scales and calculation of the EDSS. Annual investigator/coordinator meetings were held over the course of the trial to reinforce study compliance and interest in the trial. Magnetic resonance imaging (MRI) was performed at entry and at months 6, 12, 24, and 36 (Figure 1).
Primary Outcome
The primary outcome of the trial was the annualized relapse rate (ARR). There were three types of exacerbations recorded for this study: protocol defined exacerbations (PDE); non-protocol defined exacerbations (NPDE) and suspected relapses; differentiated by timing of and change in EDSS examination (Figure 2). Only the protocol defined relapses were included in the primary analyses. The designation of the type of relapse was determined centrally according to data entered onto a relapse assessment form and the change in EDSS.
Figure 2.

Relapse Definitions
Additional Outcomes
Confirmed progression in a participant was defined as a 1.0 increase in the EDSS from baseline, when baseline ≤ 5.0; or an increase of 0.5 from baseline, when baseline ≥ 5.5, sustained for 6 months (2 successive quarterly visits) as assessed by the blinded EDSS examiner and confirmed centrally. The Multiple Sclerosis Functional Composite (MSFC) was conducted using the protocol specified by the MSFC training manual (web link www.nationalmssociety.org/for-professionals/researchers/clinical-study-measures/msfc/index.aspx) measuring changes from baseline over time8. The MSFC reference standard was the pooled baseline population of this study.
MRI
Change in a composite score constructed from four MRI measures (Z4)9, and analysis of several measures of brain tissue integrity were the main and additional MRI outcomes. MRI of the brain with and without contrast was acquired using a standardized protocol that included seven separate scan series10. MRI scanners were restricted to General Electric, Philips, and Siemens machines of 1.5 or 3.0 Tesla field strengths. Baseline MRI was received at the MRI Analysis Center (MRI-AC) at least one week before randomization and all subsequent scans were to be performed within 7 days of the scheduled visit. Semi-automated processing was used to extract the enhancing lesion volume, the strictly T2 hyperintense and T1 hypointense lesion volumes, total normal appearing white matter, grey matter and cerebrospinal fluid (CSF) volumes11,12. Symmetric inverse consistent nonlinear registration aligned serial image sets for a given subject to their baseline images13. Serial registered sets of the fully processed dual FSE, FLAIR, pre and post-Gd T1, final segmented and Gd seeded images were reviewed by an expert to enumerate new or substantially enlarged T2-hyperintense lesions that lacked any evidence of enhancement.
Safety
Safety was assessed by recording all adverse events, serious and non-serious. Estimated glomerular filtration rate (eGFR) monitoring prior to MRI was added in 2008, to ensure that participants with low eGFRs would not receive gadolinium chelates during MRI. Safety was monitored by the NIH appointed independent DSMB and an external safety monitor.
Statistical Analysis
Descriptive analyses (means, medians, standard deviations, frequency distributions) and correlation analyses (Spearman rank correlations) were conducted to assess and describe the cohort. Baseline comparability and early terminations were assessed by parametric and nonparametric one factor (treatment group) analysis of variance or chi-square analyses, as applicable.
Primary Outcome
The prespecified primary analysis was a Cox proportional hazards model with the Anderson Gill modification to handle repeated occurrences of relapses within a participant. Baseline covariates that differed across treatment arms were a priori included to examine the intensity of relapses per unit of time (the relapse hazard rate). The observed ARR was computed for each treatment arm by summing all relapses and dividing the total number of relapses by the total person years of experience in that arm up through the 3 year visit, with confidence intervals for ARR calculated using a Poisson regression model with the same covariates as the Cox model. In line with the hypotheses of the trial, the first comparison made was a two-tailed test between the single agent arms. The subsequent comparison was a one-sided test of the combination versus the best of the single agents. If there was not a statistically significant difference between the single agent arms, the combination was compared to the nominal single agent winner. In addition, Poisson regression was performed as a sensitivity analysis for the number of relapses, with and without adjustment for overdispersion (Pearson) and offset for time on study, with the same covariates as the Cox model.
Secondary and Tertiary Outcomes
Secondary endpoints for the trial were confirmed progression in EDSS, change in MSFC, and change in the Z4 composite on the MRI. Tertiary endpoints presented here include median EDSS change, components of the MSFC, selected quantitative MRI measures, Clinical Activity Free Status (no exacerbation, no EDSS progression). Analyses for secondary, tertiary and post-hoc outcomes included ANOVA, ANCOVA, linear mixed models, and chi-square tests as applicable.
Disease Progression
The proportion of participants experiencing confirmed EDSS progression was compared using likelihood ratio chi-square tests, as well as a covariate adjusted logistic regression analysis.
MRI
The primary MRI variable was change in an MRI composite Z4 score9; the unweighted sum of the individual Z scores for enhanced tissue volume, total T2 hyperintense lesion component, T1 hypointense lesion component, and normalized CSF, (an inverse measure of atrophy with the appropriate sign so that all scores are directionally compatible – larger is worse) from baseline to 36 months by treatment cohort using general linear models adjusted for baseline Z4 and age. Secondary outcomes included cumulative enhanced lesion numbers, combined unique lesion activity (CUA; defined as the sum of the number of new enhanced lesions and the number of new unenhanced T2 and substantially enlarged unenhanced T2 lesions) were analyzed using Pearson chi square tests. Enhanced tissue volume, total lesion volume and its strictly T2 and T1 lesion volume components, grey and white matter volumes and normalized CSF were assessed using general linear models adjusted for baseline MRI measure and age.
MSFC
Changes in the MSFC over the period from baseline to 36 months between the three treatment cohorts were assessed using generalized linear mixed models techniques and expanded to include random effects for the clinics and participants. Repeated measures longitudinal models were constructed using all of the MSFC data available to assess the trajectory over time among the treatment groups and examine the variability of response within group. Mean change in the average time for the timed walk, 9-hole peg test and PASAT 3 score from baseline to 36 months between the treatment cohorts used analysis of covariance techniques as well as the repeated measures longitudinal analyses.
Power and Sample Size
The original sample size of the trial was estimated for a 2:1:1 randomization for combination treatment versus single agent arms, based on the pivotal trials of IFN and GA, before overall relapse rates declined in more contemporary trials14. The sample size was selected on the basis of comparing the better of the monotherapy groups (GA + placebo or IFN + placebo) with the combination of IFN + GA. Success over the best single agent rate obtained a result sufficient to meet the clinician’s clinical questions and FDA criteria required for establishing effectiveness of a combination therapy. A pre-planned comparative efficacy assessment between the two single agents with a sample size of 217 in each group had 88% power to detect a difference in ARR of 0.266, assuming a common standard deviation of 0.87, using a two group t-test with a 0.05 two-sided significance level. Following the single agent comparison, there is 90% power with 434 participants in the combination arm to detect an ARR difference of 0.266, between combination arm over the best single arm, assuming an ARR of 0.76 in the single agent arm and an ARR of 0.494 in the combination arm, using a one-sided t-test. This is equivalent to an additional additive effect of a 35% reduction from the best single agent rate with 868 total participants (434 + 217 + 217). Assuming a 10% drop out rate, the number randomized needed to be 965 participants (868/0.90) and to be conservative, the sample size was increased to 1,000 participants; with 500 in the IFN + GA arm, and 250 in each single agent arm with matching placebo. A safety analysis based upon the 6-month MRI results was performed at a nominal p-value of 0.05 when 70% of participants reached Month 6.
Analysis Populations (ITT, mITT, safety)
An intent-to-treat cohort (ITT), defined as all participants who were recruited and randomized into the study was used for the primary analyses. The safety population was defined as all participants who received at least one dose of study drug and had at least one post-baseline assessment of the safety parameter being analyzed. Participants withdrawn for adverse reactions and/or drop-out were considered as failures and evaluated as such in this safety assessment. The modified ITT (mITT) population included all randomized participants that had taken a least 1 dose of a study medication and had at least 1 valid post-baseline MRI.
Missing Values
For the primary outcome and analysis, the Cox Model allows for use of time on study for all participants and thus no imputation was utilized. Those that terminated the study prior to experiencing a relapse were considered censored; only their time on study contributed to time relapse free.
P-values < 0.05 were considered meaningful for the primary comparisons since success for the combination required statistical significance against each single agent arm to be declared superior. Analyses were performed using JMP v9 and SAS v9.3 (Cary, NC).
Role of the Funding Source and Study Management
The study was funded by the NIH with medications and matched placebos provided by Biogen Idec and Teva Pharmaceuticals to a central distribution site at the Veterans Administration Distribution Center at Perry Point, Maryland. Design, analysis, and decision to publish results were the responsibility of the study investigators and the DSMB. The trial was listed on www.clincaltrials.gov, NCT00211887. The Clinical Coordinating Center (CCC) was located at the Mount Sinai School of Medicine, Corinne Goldsmith Dickinson Center for Multiple Sclerosis; the Statistical and Data Management Center (SDMC) located at the University of Alabama at Birmingham, School of Public Health, Department of Biostatistics; and The MRI-AC located at the University of Texas Health Science Center at Houston. Complete description of study management and procedures has been reported6.
Results
Baseline Characteristics and Cohort Disposition
The characteristics of eligible participants at baseline are shown in Table 1, as detailed6. The cohort was statistically balanced across treatment groups with the exception of age; therefore, results were assessed by group as well as with adjustments for age. The mean time on study was balanced across treatment arms. A higher proportion of participants in the GA treatment completed month 36 (p= 0.029, Figure 3). There were no overall differences among groups in primary reason for termination (p = 0.72).
Figure 3.

Consort Diagram
Annualized Relapse Rate (ARR)
Utilizing the most stringent relapse definition, PDE, the primary outcome assessment comparing the ARR of the combination group at 36 months was not statistically superior to the better of the two single agent arms (GA), when adjusting for baseline age (p=0.27) (Figure 4, Table 3). GA was significantly better than IFN, reducing the risk of exacerbation by 31%; and the combination IFN + GA was significantly better than IFN, reducing the risk of exacerbation by 25% (p = 0.027, 0.022 respectively). The results were similar combining PDE with the NPDE, a less stringent definition for exacerbation (Figure 4, Table 3). Additional covariate adjusted models (age, race, number of relapses in prior 3 years, prior 12 months and MRI activity at baseline) produced similar results. Analysis of the number of relapses using Poisson Regression did not affect this outcome. There was no difference between groups in time to first exacerbation (p = 0.19) or proportion of subjects with relapses (PDE: IFN vs GA, p = 0.14, IFN+GA vs IFN, p = 0.19, IFN+GA vs GA, p = 0.21). Although not shown here, the 24 month results were very similar to these 36 month results.
Figure 4.

Annualized Relapse Rate by Treatment Group
IFN + GA – Solid Black
IFN – Gray Hashed
GA – Solid Gray
Table 3.
Exacerbation Summary and Relapse Risk Comparisons by Exacerbation Type and Treatment Group
| Relapse Information by Type | IFN + GA (N=499) | IFN (N=250) | GA (N=259) |
|---|---|---|---|
| No. Protocol Defined Exacerbations (PDE) | 150 | 97 | 70 |
| No. Non-protocol Defined Exacerbations (NPDE) | 135 | 96 | 78 |
| No. PDE + NPDE | 285 | 193 | 148 |
| Total Person Years | 1218.9 | 604.4 | 650.7 |
| No. (%) Participants Relapse Free: | |||
| PDE | 384 (77.0) | 185 (74.0) | 206 (79.5) |
| PDE + NPDE | 305 (61.1) | 139 (55.6) | 166 (64.1) |
| PDE Treatment Group Comparisons | Hazard Ratio (95% CI) | p-valuea | |
| IFN + GA vs GA | 1.10 (0.82–1.46) | 0.27 | |
| IFN vs GA | 1.43 (1.04–1.95) | 0.025 | |
| PDE + NPDE Treatment Group Comparisons | |||
| IFN + GA vs GA | 1.01 (0.83–1.25) | 0.44 | |
| IFN vs GA | 1.36 (1.08–1.69) | 0.008 | |
Age adjusted, Cox Proportional Hazards Model with Anderson-Gill Modification
Secondary Outcomes: Disease Progression, MSFC, MRI
Disease Progression and MSFC
There were no differences between groups for the proportions showing six month confirmed progression of EDSS, with progression observed in 22–25% of the participants (Table 4). There was no difference in the MSFC score between groups, with all groups showing small increases, primarily driven by the PASAT. The 9 hole peg test and 25 foot timed walk were minimally worse after 36 months (Table 4).
Table 4.
EDSS Progression and Multiple Sclerosis Functional Composite (MSFC)
| IFN + GA | IFN | GA | |
|---|---|---|---|
| No. Eligible for Progressiona | 472 | 241 | 246 |
| No. (%) with EDSS Progression | 113 (23.9) | 52 (21.6) | 61 (24.8) |
| EDSS Progression by Baseline (BL) EDSSb | |||
| No. / No. with BL EDSS = 0 (%) | 43/65 (66.2) | 17/28 (60.7) | 18/26 (69.2) |
| No. / No. with BL EDSS > 0 (%) | 70/407 (17.2) | 35/213 (16.4) | 43/220 (19.6) |
| No. with MSFC at Month 0: | 498 | 250 | 257 |
| MSFC at Month 0: | |||
| Mean (SD) | 0.03 (0.73) | −0.01 (0.75) | −0.03 (0.73) |
| No. with MSFC at Months 0 & 36 | 413 | 208 | 215 |
| MSFC and Components: Month 36 change from Baseline (Month 36 minus Month 0) | |||
| MSFCc: | |||
| Mean (SD) | 0.1 (0.5) | 0.1 (0.5) | 0.2 (0.5) |
| Median (range) | 0.1 (−3.5, 2.3) | 0.1 (−2.0, 1.8) | 0.2 (−3.0, 2.4) |
| Timed 25 foot walk (sec) d: | |||
| Mean (SD) | 0.1 (1.7) | 0.2 (1.1) | 0.2 (1.7) |
| Median (range) | 0.1 (−16.2, 15.3) | 0.1 (−6.2, 6.3) | 0.2 (−7.1, 12.8) |
| 9 hole peg test (sec)e: | |||
| Mean (SD) | −0.4 (3.2) | −0.4 (3.8) | −0.1 (4.1) |
| Median (range) | −0.6 (−17.9, 35.2) | −0.4 (−39.1, 10.5) | −0.1 (−16.4, 48.8) |
| PASAT 3 (no. correct)f: | |||
| Mean (SD) | 3.2 (8.3) | 3.5 (8.1) | 4.3 (7.4) |
| Median (range) | 2 (−56, 56) | 2.5 (−57, 52) | 3 (−12, 56) |
Participants must reach Month 9 to be assessed for 6-month confirmed progression
OR: 9.2 (95% CI 6.1, 14.0) for progression for BL EDSS = 0 versus BL EDSS > 0, p <0.0001; regardless of treatment arm (no treatment arm differences, all p > 0.20)
MSFC, positive indicates improvement
T25FW, positive indicates worsening
9HPT, negative indicates improvement
PASAT3, positive indicates improvement
MRI
The primary MRI outcome, change in the Z4 composite from baseline to month 36, did not differ between the IFN and GA groups (p = 0.52) or between the nominal monotherapy winner IFN and the combination (p = 0.23), adjusted for baseline Z4 and age (Table 5). Similarly, analyses at months 6, 12, and 24 demonstrated no significant differences between the treatment arms.
Table 5.
MRI Results at Month 36
| Characteristics | IFN + GA | IFN | GA |
|---|---|---|---|
| N with Month 36 MRI | 388 | 187 | 215 |
| Change in Z4 | |||
| Mean (SD)a | −0.02 (1.30) | 0.05 (1.27) | 0.10 (2.09) |
| T2 Volume at Month 36, mL | |||
| Volume Mean (SD) | 8.99 (10.92) | 9.42 (10.16) | 10.93(12.39) |
| Volume Median (range) | 4.66 (0.1, 67.1) | 5.88 (0.2, 63.0) | 6.54 (0.2, 80.0) |
| Change from baseline in the T2-hyperintense lesion volume component, mL | |||
| Mean (SD)b | −1.38 (5.38) | −0.25 (4.18) | 0.01 (4.81) |
| Median (range) | −0.87 (−29.1, 50.4) | −0.20 (−17.7, 16.7) | 0.06 (−19.6, 19.1) |
| Change from baseline in normalized CSF, % | |||
| Mean (SD) | 0.60 (1.34) | 0.51 (1.22) | 0.57 (1.14) |
| Percent change | 2.91 (6.32) | 2.46 (5.70) | 2.78 (5.30) |
| Change from baseline in normal appearing gray matter, mL | |||
| Mean change (SD) | −2.60 (27.98) | −2.99 (23.55) | −5.16 (23.66) |
| Percent change | −0.33 (4.79) | −0.36 (3.92) | −0.77 (3.93) |
| Change from baseline in normal appearing white matter, mL | |||
| Mean change (SD) | −1.73 (22.63) | −0.71 (17.01) | −1.72 (15.66) |
| Percent change | −0.41 (5.61) | −0.12 (3.59) | −0.37 (3.48) |
N for Z4: IFN + GA 381, IFN 185, GA 211
IFN + GA vs. IFN, p=0.008; IFN vs. GA, p=0.48, adjusted for baseline T2-hyperintense lesion volume component and age.
All three treatments appeared to be effective in reducing MRI-defined disease activity as measured by enhanced lesion numbers within 6 months of their initiation (Figure 5a). While there was no difference in the change in number of enhancements from month 0 to 36 between IFN and GA monotherapy arms (p = 0.82), the combination of IFN + GA was superior to the nominal winner IFN (p = 0.01) in reducing enhancement numbers, adjusted for baseline age and the number of enhancements at baseline. Similar results were seen for the cumulative number of enhancements on study and the proportion of subjects free of enhancements at month 36 (IFN + GA = 89.8%, IFN = 84.8%, GA = 84.5%). Given the rather long interval between imaging sessions in this trial, a more appropriate MRI measure of disease activity may be the CUA on study. No statistical difference was evident between IFN and GA alone in reducing CUA lesion numbers on study (p = 0.69), but there was a robust difference between IFN + GA and the nominal winner IFN (p < 0.0001; Figure 5b). The proportion of subjects free of CUA through month 36 (IFN + GA = 49.2%, IFN = 32.2%, GA = 32.5%) favored combined therapy (p < 0.0001) with no differences found between the monotherapy groups (p = 0.95). Significant changes were evident for the accumulated total lesion volume for the IFN + GA combination (p = 0.003) compared to IFN the nominal winner (IFN vs. GA, p = 0.68; Figure 5c). This was also true for the strictly T2-hyperintense lesion component (Table 5). While, similar trends were present for the change in accumulated T1-hypointense lesion component, these did not meet significance for the IFN + GA combination compared to the nominal winner (p = 0.06; Figure 5d). The effects of therapy on other MRI measures of brain pathology (normal appearing grey and white matter volumes and global atrophy as reflected by the change in normalized CSF from baseline) did not differ statistically between the treatment arms (Table 5).
Figure 5. MRI Lesion Activity and Volume Measures Over Time to 36 Monthsa.


Figure 5A. Mean GD Lesions
Figure 5B. Cumulative Combined Unique Activity (CUA) on Study
Figure 5C. Total Lesion Volume
Figure 5D. T1 Hypointense Lesion Volume
Figure 5E. Normalized CSF
a – Month 0 adjusted for age, Months 6 – 36 adjusted for Month 0 and age
IFN + GA - Solid Black Line with Solid Black Diamond
IFN – Long Dashed Line with Upright Triangle
GA – Short Dashed Line with Inverse Triangle
Clinical and Disease Activity Free Status (DAFS)
There was a pre-planned assessment of the percentages with no evidence of clinical activity (no exacerbations and no confirmed progression) which was similar for all groups (Figure 6a). When analyzed, post hoc, for a full DAFS (no clinical activity and no CUA) there was a significant effect of the combination over either single arm using either the PDE or NPDE relapse definition (Figure 6b).
Figure 6. Clinical and Disease Activity Free Status.


Figure 6A. Clinical Activity Free Status
Figure 6B. Disease Activity Free Status
IFN + GA – Solid Black
IFN – Gray Hashed
GA – Solid Gray
Safety
There were no safety issues identified as resulting from the combination therapy. The usual adverse events seen with the single agents were reported. There were 4 deaths; 3 in the core study and 1 in the extension: seizure activity secondary to MS (IFN+GA), pulmonary embolism (IFN), large cell lymphoma of the CNS which upon review was present at entry to the study (GA), and death from anoxic brain injury following a drug overdose in the extension phase (IFN). Full safety data is provided in the supplemental tables: Serious Adverse Events (Supp Table 1), Adverse Events (Supp Table 2).
Discussion
CombiRx was a multicenter, NIH sponsored study to determine whether the combination of the two most commonly prescribed MS disease modifying agents would be superior to either agent alone. This trial confirmed that such a combination study could be performed, that a dedicated group of investigators and clinical trial staff could be assembled, and that such a trial could provide high quality, comparative efficacy data. Moreover, the study provides a large, well characterized dataset that can be mined for demographic, epidemiologic, prognostic and methodologic information that will ultimately be publicly available; leveraging the resources used in answering the primary questions.
The results of this study confirm the safety of the combination therapy, but do not demonstrate sufficient clinical efficacy to warrant endorsement of this combination of drugs, as yet. The positive effects on the MRI outcomes are intriguing indicators of potential benefit, but with insufficient clinical impact over the three year follow-up period. The positive effect on DAFS, driven by the MRI results, is of interest in light of the very low ARR seen over the three years. As relapse rates drop to the low levels seen in this and other recent pivotal trials, we will need more sensitive outcomes to allow determination of improved therapies aimed at eliminating all disease activity15. Absent a new clinical metric, this will necessitate using the increased sensitivity of MRI to detect MS disease activity and pathology.
The design of this study allowed for a comparative efficacy analysis between the two single agents, GA and IFN. For a combination therapy to be successful, it should be superior to the better of the single agents used as monotherapy. GA was significantly better than IFN for reduction in ARR, utilizing any of our definitions of relapse. No differences were found between the two agents for the other the clinical outcomes reported here, and both monotherapies performed very well. While there were no significant differences between GA and IFN as monotherapy in the MRI assessments, IFN performed nominally better.
All three treatments performed extremely well as reflected by the low ARR observed using PDE or PDE + NPDE as the outcome measure. The low ARRs in CombiRx are surprising. The protocol defined ARRs are among the lowest reported to date for the agents utilized in this study, or any other pivotal study with other MS therapeutic agents that utilized similar definitions. Collecting all relapses, whether they met the protocol definition, the non-protocol definition (not being seen within 7 days) or suspect relapses, where a change in the EDSS was not evident to the blinded observer, allows us to examine the impact of relapse definition on the trial results. The rates increase proportionately for each less strict definition of relapse (Table 3). This is important, as while it does not explain the lack of hypothesized clinical efficacy, it does have implications for interpretation of the meaning of low rates in contemporary trials. The lower rates are not merely a product of patient selection, but also adherence to more rigid definitions of relapses.
The results on confirmed EDSS progression show that most patients fared quite well on any of the treatments with low rates of progression over a three year period. However, those entering the study with an EDSS of 0 were much more likely to progress than the rest of the cohort (Table 4). Similarly, results of the MSFC did not show enhanced benefit from the combination.
While no statistical differences or strong trends were seen between the three treatment arms on any of the global measures of tissue loss (Table 5), it is perhaps noteworthy that the trajectory of global tissue loss was attenuated over time for all participants (Figure 5e). The usual rate of loss of brain parenchymal tissue reported in the literature for untreated RRMS cohorts is about 1% per annum16. In this trial, the rate of tissue loss across all subjects was 2.1% in year one, 0.7% in year two and 0.01% in year three. Nearly 2/3 of the loss of tissue that occurred in year one, occurred over the first six months of the study, and may well reflect the consequence of events that occurred before randomization and initiation of therapy as suggested by Hardmeier and colleagues17. We cannot exclude the possibility that so called ‘pseudoatrophy’ may have contributed to an apparent accelerated tissue loss over the first 6 – 12 months of our study18. However, if present, this is unlikely to have been due to pre-baseline therapy with corticosteroids as the effects of methylprednisolone on transient reductions in brain tissue volumes19, are likely to have resolved by the time that baseline MRI were obtained due to the exclusion of patients receiving such treatments within 30 days of randomization in this trial. Moreover, few methylprednisolone treated attacks occurred within the first 6 months of study entry and those that occurred were similarly distributed between the three study arms. Neither low dose IFN or GA is recognized to be associated with neurotoxic effects that might contribute to time dependent cerebral tissue loss20. While speculative in the absence of a comparative randomized placebo group, this suggests that patients in our trial on either or both forms of therapy benefited from a considerable amount of tissue protection. The apparent stabilization of tissue loss after year 1 that we observed is consistent with what has been reported in other randomized17,22 and observational trials16 of subjects after the first year of initiation of treatment with the IFNs or GA.
The CombiRx study sets a framework for future MS therapeutic studies. While not showing a clinical benefit for this combination, it provides interesting longer term outcome assessments and more data on understanding the relative roles of clinical and MRI metrics. The core MRI results show very interesting patterns of potential benefit for the combination compared to the single agent groups in reducing lesion load and activity. We will look to see if this effect produces a corresponding clinical effect in the extension portion of this study with subjects followed well beyond 3 years.
Supplementary Material
Acknowledgments
This study was funded by The National Institutes of Health, The National Institute of Neurological Disorders and Stroke (Phase III study: UO1NS045719, Planning Grant: R21NS41986) and is listed on www.clinicaltrials.gov: NCT00211887. Study agents and matched placebo were kindly provided by their manufacturers, Biogen Idec and Teva Pharmaceutical. We are deeply indebted to the participants and the clinical site investigators/study staff for their dedication to this study.
The CombiRx Analysis Centers: Clinical Coordinating Center: Corinne Goldsmith Dickinson Center for MS, Icahn School of Medicine at Mount Sinai, Director-Fred D. Lublin, M.D.; Statistical and Data Management Center: University of Alabama at Birmingham School of Public Health, Director-Gary Cutter, PhD; MRI Analysis Center: University of Texas Health Science Center at Houston, Director-Jerry Wolinsky, M.D.
Data & Safety Monitoring Committee: Anne Lindblad (Chair), Jason Fine, Gary Franklin, David Miller, Emmanuelle Waubant; Past Chair: Stan van den Noort
External medical monitor-Rene Elkin; recruitment monitor-Aaron Miller
Executive Committee: Fred D. Lublin, Jerry Wolinsky, Gary Cutter, Ponnada Narayana, Stacey Cofield, Robin Conwit, Flavia Nelson
Advisory Committee: Robert Lisak, John Noseworthy, Stephen Reingold, Richard Rudick
CombiRx Investigators Group
M. Agius, Sacramento, CA; K. Bashir, Birmingham, AL; R. Baumhefner, Los Angeles, CA; G. Birnbaum, Golden Valley, MN; G. Blevins, Edmonton, AB, Canada; R. Bomprezzi, Phoenix, AZ; A. Boster, Columbus, OH; T. Brown, Kirkland, WA; J. Burkholder, Canton, OH; A. Camac, Lexington, MA; D. Campagnolo, Phoenix, AZ; J. Carter, Scottsdale, AZ; B. Cohen, Chicago, IL; J. Cooper, Berkeley, CA; J. Corboy, Aurora, CO; A. Cross, Saint Louis, MO; L. Dewitt, Salt Lake City, UT; J. Dunn, Kirkland, WA; K. Edwards, Latham, NY; E. Eggenberger, East Lansing, MI; J. English, Atlanta, GA; W. Felton, Richmond, VA; P. Fodor, Colorado Springs, CO; C. Ford, Albuquerque, NM; M. Freedman, Ottawa, ON, Canada; S. Galetta, Philadelphia, PA; G. Garmany, Boulder, CO; A. Goodman, Rochester, NY; M. Gottesman, Mineola, NY; C. Gottschalk, New Haven CT; M. Gruenthal, Albany, NY; M. Gudesblatt, Patchogue, NY; M. Hagan, Billings, MT; R. Hamill, Burlington, VT; J. Herbert, New York, NY; R. Holub, Albany, NY; W. Honeycutt, Maitland, FL; B. Hughes, Des Moines, IA; G. Hutton, Houston, TX; D. Jacobs, Philadelphia, PA; K. Johnson, Baltimore, MD; L. Kasper, Lebanon, NH; J. Kattah, Peoria, IL; M. Kaufman, Charlotte, NC; M. Keegan, Rochester, MN; O. Khan, Detroit, MI; B. Khatri, Milwaukee, WI; M. Kita, Seattle, WA; B. Koffman, Toledo, OH; E. Lallana, Lebanon, NH; N. Lava, Albany, NY; J. Lindsey, Houston, TX; P. Loge, Billings, MT; S. Lynch, Kansas City, KS; F. McGee, Richmond, VA; L. Mejico, Syracuse, NY; L. Metz, Calgary, AB Canada; P. O’Connor, Toronto, ON, Canada; D. Okuda, Phoenix, AZ; K. Pandey, Albany, NY; H. Panitch, Burlington, VT; D. Pelletier, New Haven, CT; J. Preiningerova, New Haven, CT; K. Rammohan, Columbus, OH; C. Riley, New Haven, CT; P. Riskind, Worcester, MA; L. Rolak, Marshfield, WI; W. Royal, Baltimore, MD; S. Scarberry, Fargo, ND; A. Schulman, Richmond, VA; T. Scott, Pittsburgh, PA; C. Sheppard, Uniontown, OH; W. Sheremata, Miami, FL; L. Stone, Cleveland, OH; W. Stuart, Atlanta, GA; S. Sriram, Nashville, TN; V. Thadani, Lebanon, NH; F.P. Thomas, Saint Louis, MO; B. Thrower, Atlanta, GA; M. Tullman, New York, NY; A. Turel, Danville, PA; T. Vollmer, Phoenix, AZ; S. Waldman, La Habra, CA; B. Weinstock-Guttman, Buffalo, NY; J. Wendt, Tucson, AZ; R. Williams, Billings, MT; D. Wynn, Northbrook, IL; M. Yeung, Calgary, AB, Canada.
References
- 1.Weiner HL. The challenge of multiple sclerosis: how do we cure a chronic heterogeneous disease? Ann Neurol. 2009;65:239–248. doi: 10.1002/ana.21640. [DOI] [PubMed] [Google Scholar]
- 2.The IFNB MS study group. Interferon beta-1b is effective in relapsing-remitting multiple sclerosis. I. Clinical results of a multicenter, randomized, double-blind, placebo-controlled trial. The IFNB Multiple Sclerosis Study Group. Neurology. 1993;43:655–661. doi: 10.1212/wnl.43.4.655. [DOI] [PubMed] [Google Scholar]
- 3.Castro-Borrero W, Graves D, Frohman TC, et al. Current and emerging therapies in multiple sclerosis: a systematic review. Ther Adv Neurol Disord. 2012;5:205–220. doi: 10.1177/1756285612450936. [DOI] [PMC free article] [PubMed] [Google Scholar]
- 4.Conway D, Cohen JA. Combination therapy in multiple sclerosis. Lancet Neurol. 2010;9:299–308. doi: 10.1016/S1474-4422(10)70007-7. [DOI] [PubMed] [Google Scholar]
- 5.Graber JJ, McGraw CA, Kimbrough D, et al. Overlapping and distinct mechanisms of action of multiple sclerosis therapies. Clin Neurol Neurosurg. 2010;112:583–591. doi: 10.1016/j.clineuro.2010.05.002. [DOI] [PubMed] [Google Scholar]
- 6.Lindsey J, Scott T, Lynch S, et al. The CombiRx trial of combined therapy with interferon and glatiramer cetate in relapsing remitting MS: Design and baseline characteristics. Mult Scler Relat Disord. 2012;1:81–86. doi: 10.1016/j.msard.2012.01.006. [DOI] [PMC free article] [PubMed] [Google Scholar]
- 7.McDonald WI, Compston A, Edan G, et al. Recommended diagnostic criteria for multiple sclerosis: guidelines from the International Panel on the diagnosis of multiple sclerosis. Ann Neurol. 2001;50:121–127. doi: 10.1002/ana.1032. [DOI] [PubMed] [Google Scholar]
- 8.Cutter GR, Baier ML, Rudick RA, et al. Development of a multiple sclerosis functional composite as a clinical trial outcome measure. Brain. 1999;122:871–882. doi: 10.1093/brain/122.5.871. [DOI] [PubMed] [Google Scholar]
- 9.Wolinsky JS, Narayana PA, Noseworthy JH, et al. Linomide in relapsing and secondary progressive MS: part II: MRI results. MRI Analysis Center of the University of Texas-Houston, Health Science Center, and the North American Linomide Investigators[see comments] Neurology. 2000;54:1734–1741. doi: 10.1212/wnl.54.9.1734. [DOI] [PubMed] [Google Scholar]
- 10.O’Connor P, Wolinsky JS, Confavreux C, et al. Randomized trial of oral teriflunomide for relapsing multiple sclerosis. N Engl J Med. 2011;365:1293–1303. doi: 10.1056/NEJMoa1014656. [DOI] [PubMed] [Google Scholar]
- 11.Sajja BR, Datta S, He R, et al. Unified approach for multiple sclerosis lesion segmentation on brain MRI. Ann Biomed Eng. 2006;34:142–151. doi: 10.1007/s10439-005-9009-0. [DOI] [PMC free article] [PubMed] [Google Scholar]
- 12.Datta S, Sajja BR, He R, et al. Segmentation and quantification of black holes in multiple sclerosis. Neuroimage. 2006;29:467–474. doi: 10.1016/j.neuroimage.2005.07.042. [DOI] [PMC free article] [PubMed] [Google Scholar]
- 13.Tao G, He R, Datta S, et al. Symmetric inverse consistent nonlinear registration driven by mutual information. Comput Methods Programs Biomed. 2009;95:105–115. doi: 10.1016/j.cmpb.2009.01.011. [DOI] [PMC free article] [PubMed] [Google Scholar]
- 14.Inusah S, Sormani MP, Cofield SS, et al. Assessing changes in relapse rates in multiple sclerosis. Multiple Sclerosis. 2010;16:1414–1421. doi: 10.1177/1352458510379246. [DOI] [PubMed] [Google Scholar]
- 15.Lublin FD. Disease activity free status in MS. Mult Scler Relat Disord. 2012;1:6–7. doi: 10.1016/j.msard.2011.08.001. [DOI] [PubMed] [Google Scholar]
- 16.Khan O, Bao F, Shah M, et al. Effect of disease-modifying therapies on brain volume in relapsing-remitting multiple sclerosis: Results of a five-year brain MRI study. J Neurol Sci. 2012;312:7–12. doi: 10.1016/j.jns.2011.08.034. [DOI] [PubMed] [Google Scholar]
- 17.Hardmeier M, Wagenpfeil S, Freitag P, et al. Rate of brain atrophy in relapsing MS decreases during treatment with IFNbeta-1a. Neurology. 2005;64:236–240. doi: 10.1212/01.WNL.0000149516.30155.B8. [DOI] [PubMed] [Google Scholar]
- 18.Khoury S, Bakshi R. Cerebral pseudoatrophy or real atrophy after therapy in multiple sclerosis. Ann Neurol. 2010;68:778–779. doi: 10.1002/ana.22254. [DOI] [PubMed] [Google Scholar]
- 19.Rao AB, Richert N, Howard T, et al. Methylprednisolone effect on brain volume and enhancing lesions in MS before and during IFN beta-1b. Neurology. 2002;59:688–694. doi: 10.1212/wnl.59.5.688. [DOI] [PubMed] [Google Scholar]
- 20.Petzold A, Mondria T, Kuhle J, et al. Evidence for acute neurotoxicity after chemotherapy. Ann Neurol. 2010;68:806–815. doi: 10.1002/ana.22169. [DOI] [PubMed] [Google Scholar]
- 21.Cohen JA, Chun J. Mechanisms of fingolimod’s efficacy and adverse effects in multiple sclerosis. Ann Neurol. 2011;69:759–777. doi: 10.1002/ana.22426. [DOI] [PubMed] [Google Scholar]
- 22.Rudick RA, Fisher E, Lee JC, et al. Use of the brain parenchymal fraction to measure whole brain atrophy in relapsing-remitting MS. Multiple Sclerosis CollaborativeResearch Group. Neurology. 1999;53:1698–1704. doi: 10.1212/wnl.53.8.1698. [DOI] [PubMed] [Google Scholar]
Associated Data
This section collects any data citations, data availability statements, or supplementary materials included in this article.