Abstract
Objective
Molecular imaging and clinical endpoints are frequently discordant in Parkinson disease (PD) clinical trials raising questions about validity of these imaging measures to reflect disease severity.
We compared striatal uptake for 3 PET tracers with in vitro measures of nigral cell counts and striatal dopamine in MPTP treated monkeys.
Methods
Sixteen macaques had MRI and baseline PETs using 6-[18F]fluorodopa (FD), [11C] dihydrotetrabenazine (DTBZ) and [11C] 2beta-carbomethoxy-3beta-4-fluorophenyltropane (CFT). MPTP (0 to 0.31 mg/kg) infused unilaterally via the internal carotid artery produced stable hemiparkinsonism by three weeks. After eight weeks, PETs were repeated and animals euthanized for striatal dopamine measurements and unbiased counts of tyrosine hydroxylase stained nigral cells.
Results
Striatal uptake for each radiotracer (FD, DTBZ, CFT) correlated with stereologic nigral cell counts only for nigral loss < 50% (r2= 0.84; r2= 0.86; r2= 0.87, p<0.001 respectively; n=10). In contrast, striatal uptake correlated with striatal dopamine over the full range of dopamine depletion (r2= 0.95; r2= 0.94; r2= 0.94, p<0.001; n=16). Interestingly, indices of striatal uptake of FD, DTBZ and CFT correlated strongly with each other (r2=0.98, p<0.001).
Interpretation
Tracer uptake correlated with nigral neurons only when nigral loss < 50%. This along with previous work demonstrating that nigral cell counts correlate strongly with parkinsonism ratings may explain discordant results between neuroimaging and clinical endpoints. Furthermore, strong correlations among striatal uptake for these tracers support lack of differential regulation of decarboxylase activity (FD), vesicular monoamine transporter type 2 (DTBZ), and dopamine transporter (CFT) within 2 months after nigrostriatal injury.
Introduction
Parkinson disease (PD) is a common disabling progressive neurodegenerative disease associated with pathologic loss of nigral dopaminergic neurons and their striatal terminal fields. Although multiple therapies provide symptomatic relief, no intervention has proven to slow or reverse PD. To develop disease modifying therapies, it is necessary to have a metric of disease progression. Clinical measures of disease progression remain subjective and may be confounded by symptomatic effects of the intervention or concomitant therapies. Hence, neuroimaging biomarkers that accurately reflect the severity of nigrostriatal neuron loss as measures of PD progression are critical for development of disease modifying therapy.
Three classes of radiotracers are commonly used for positron emission tomography (PET) or single photon emission computed tomography (SPECT)-based imaging to assess pre-synaptic dopaminergic nigrostriatal neurons: 6-[18F]fluorodopa (FD; primarily reflects decarboxylase activity), [11C]dihydrotetrabenazine (DTBZ; reflects vesicular monoamine transporter type 2, VMAT2) and 2-beta-[11C]carbomethoxy-3-beta-4-fluorophenyltropane (CFT; reflects membranous dopamine transporter, DAT)1. However, discrepancies between neuroimaging and clinical measures raise questions about the validity of these metrics. 2-4
Indeed, no convincing data demonstrate whether any of these widely used neuroimaging markers faithfully reflect reduction of nigrostriatal dopaminergic neurons that could be used as measures of disease progression in PD. 5 In this study, we compared PET measures of striatal uptake for FD, DTBZ and CFT in a nonhuman primate model of PD and investigated their relationship with unbiased stereologic counts of nigral neurons. Although the MPTP model does not represent the pathophysiology of idiopathic PD, it offers a unique opportunity to perform quantitative measurements of pre-synaptic dopaminergic markers and neuronal counts across a wide range of nigrostriatal injury, thus addressing a major limitation of many previous studies which had poor data distribution.
Methods
Subjects
Sixteen male macaques (mean age =5.4±1.0) were studied. The welfare of the animals conformed to the requirements of National Institutes of Health (NIH). This work was conducted at the Nonhuman Primate Facility of Washington University in St. Louis with approval from its Institutional Animal Care and Use Committee (IACUC). Animals were maintained in facilities with 12-hour dark and light cycles, given access to food and water ad libitum and provided a variety of psychologically enriching tasks to prevent inappropriate deprivation.
Study Design
Each animal had a brain MRI and baseline PETs using FD, DTBZ and CFT. A variable dose of MPTP (0 to 0.31 mg/kg) was infused unilaterally via the internal carotid artery. 6 Animals were always able to care for themselves and received no dopaminergic drugs at any time. After eight weeks, PETs were repeated. Each animal was euthanized after the last scan, the brain rapidly removed and tissue prepared, stained and counted.
MRI scan
Animals were scanned under anesthesia using 3T Siemens MAGNETOM Trio TM. A magnetization prepared rapid gradient echo (MPRAGE) scan was obtained for identification of regions of interest (ROI).
PET scans
Animals were scanned under anesthesia 6 using the Siemens Microsystems (Knoxville, TN) MicroPET Focus 220 scanner. 7A transmission scan to measure attenuation was followed by intravenous administration of 7.7-10.4 mCi [11C]DTBZ, 7.7-10.4 mCi [11C]CFT or 3-10 mCi [18F]FD. PET data were collected for 120 min (three 1-minute frames, four 2-minute frames, three 3-minute frames and twenty 5-minute frames) for all tracers. We waited at least 3 hours between radiopharmaceutical injections. FD was done as a single study or the last PET of the day given its longer half-life (110 min for 18F). We also collected a baseline emission scan just prior to the 2nd PET scan of the day to ensure that there was negligible residual striatal radioactivity before doing the 2nd injection of radiotracer.
PET analysis: All VOI analyses were done by investigators blinded to the clinical status of the monkeys. PET image reconstructed resolution was <2.0 mm full width half maximum for all 3 dimensions at the center of the field of view. Correction for movement of individual frames was unnecessary since the anesthetized animal’s head was immobile. The first baseline PET image for each animal acted as the target image with subsequent PETs co-registered to it. Caudate, putamen and an occipital region (as a reference) were manually traced on the MPRAGE for each animal. The MPRAGE was co-registered to the target PET scan of that animal using vector gradient method and the traced VOIs were transformed into PET space using the same transformation matrix. 8 To reduce volume averaging with the neighboring regions, the MRI based striatal VOIs were trimmed to include only voxels with at least 90% of the maximal counts within that VOI. The reference region included a pair of hemi-cylinders in occipital cortex on either side of the midline, set back from midline and the posterior edges to avoid vascular activity and transformed to PET space as described above. After extracting the tissue activity curves, we calculated the influx constant KOCC for FD (data from 24-94 min) 9, and the non-displaceable binding potential (BPND) for CFT and DTBZ 10 (data from 30-115 min and15-60 min respectively).
Ex vivo Measurements
Euthanasia & Sample Preparation
Animals were euthanized and the samples were prepared as previously described.11
In vitro measures
Striatal dopamine was measured using high performance liquid chromatography with electrochemical detection (HPLC-EC).11, 12 The values were expressed as ng/gm of brain tissue. Unbiased stereological counts of nigrostriatal neurons was done on tyrosine hydroxylase (TH) immunostained midbrain slices, as previously described.11 Only TH-positive neurons were counted as long as a nucleus could be distinguished. There were no TH-negative nigral cells as judged by their morphology. Small amorphous clumps of TH-positive material without an identifiable nucleus on the severely affected side were not counted as cells.
Statistical Analysis
For all the measurements we calculated a ratio of injected to control side to account for inter-subject variations. Results were analyzed using SPSS (version 18.0.2 IBM, Chicago. IL). Pearson correlation was performed for determining the relationship of the PET measures (FD, CFT, DTBZ), the nigrostriatal dopaminergic cell counts, and striatal dopamine. Each animal contributed a single point except one animal that was not included in the nigral count data due to midbrain tissue damage during processing. A two-tailed P value of less than 0.05 was considered significant.
Results
All 16 monkeys completed the study and demonstrated a stable wide range of severity of parkinsonism after three weeks, from none in controls to severe unilateral parkinsonism with the highest doses of MPTP. Behavioral measures have been reported in a separate paper. 13 Baseline measures of each of the radioligands revealed consistent injected-control ratios of striatal uptake (Table 1).
TABLE.1.
Baseline left-right ratios of FD KOCC and BPND or for each radioligand.
| FD Kocc | DTBZ BPND | CFT BPND | |
|---|---|---|---|
| Baseline ratio mean± SD |
0.98 (±0.04) | 1.00 (±0.04) | 0.99 (±0.38) |
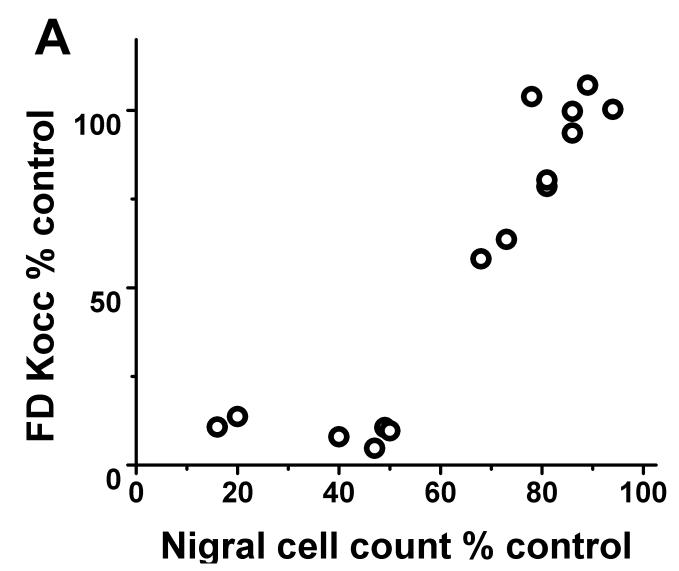
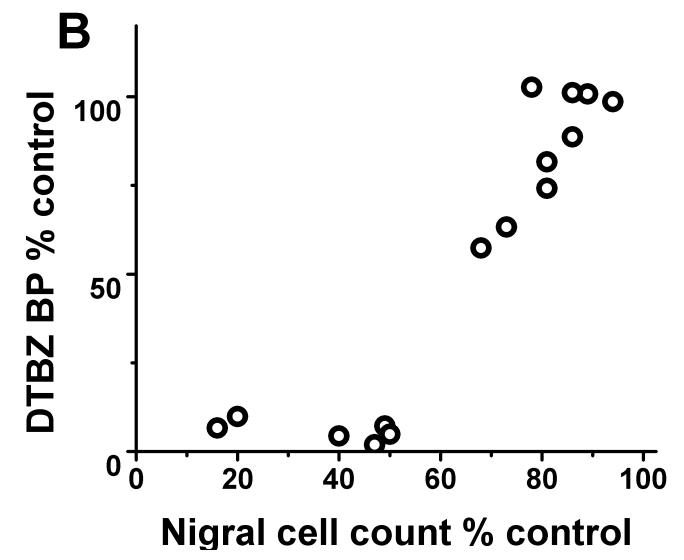
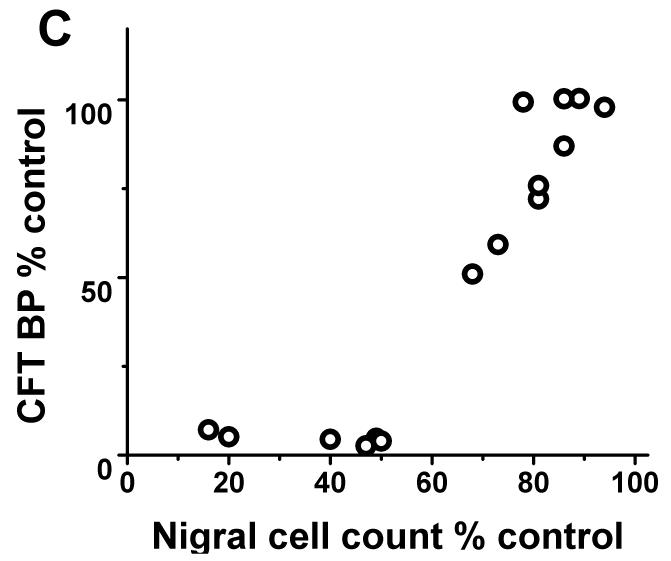
Each of the radiotracers demonstrated a consistent relationship with respect to nigral dopaminergic cell loss. The residual striatal uptake of FD, DTBZ and CFT linearly correlated with nigral cell counts (r2= 0.84, p<0.001; r2= 0.86, p< 0.001; r2= 0.87, p<0.001 respectively; n=10) but only when nigral neuronal loss did not exceed 50%. Once nigral neuronal loss exceeded 50%, striatal uptake of FD, DTBZ and CFT showed a flooring effect (Fig 1).
FIGURE 1.
There was flooring effect of striatal FD KOCC ratio, DTBZ and CFT BPND ratio with nigral cell loss > 50%. There was a significant linear correlation between KOCC or BPND and nigral cell count expressed in % of control side excluding those with > 50% nigral cell loss (Pearson: r2= 0.84, p<0.001; r2= 0.86, p< 0.001; r2= 0.87, p<0.001 respectively; n=10).
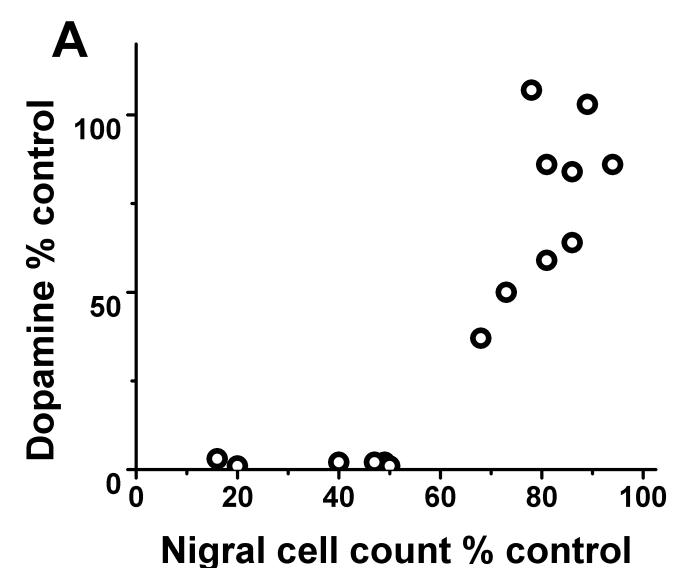
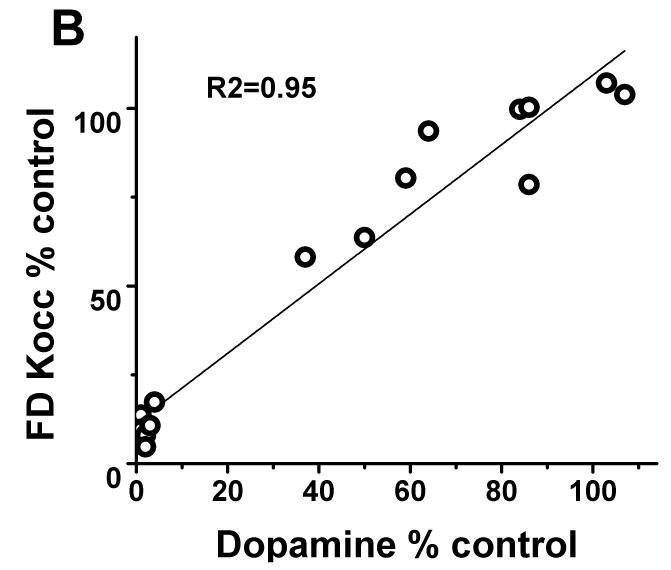
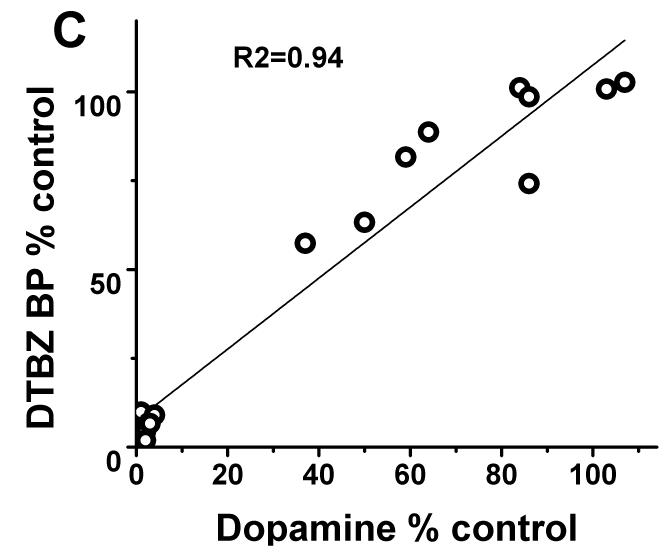
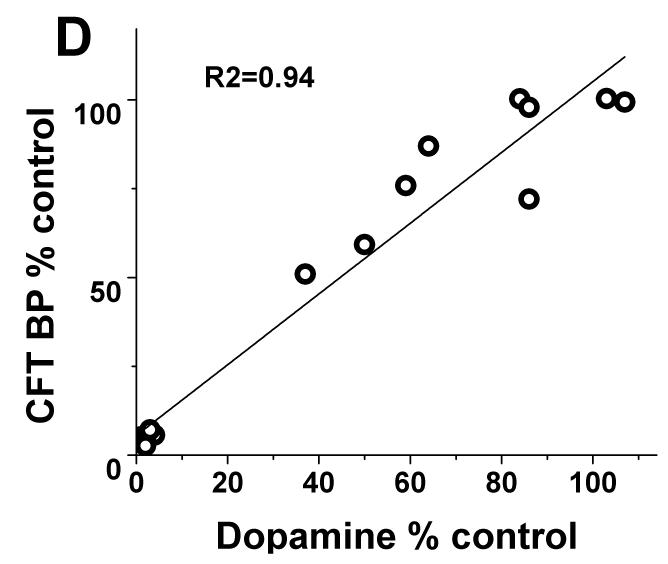
In contrast, striatal KOCC for FD and BPND for DTBZ and CFT linearly correlated with striatal dopamine measures throughout the full range of striatal dopamine loss (r2= 0.95; r2= 0.94; r2= 0.94 respectively with p<0.001, n=16) (Fig 2B-D). Exclusion of the clustered data points representing severe striatal dopamine loss did not diminish the strength of this linear correlation; a strong significant correlation persisted between striatal dopamine and FD, DTBZ and CFT uptake (without the clustered points: r2= 0.84; r2= 0.85; r2= 0.86 respectively with p<0.001, n=10). As expected, striatal dopamine measures had the same relationship to nigral cell counts as did the striatal PET measures. Striatal dopamine correlated with nigral cell counts but showed a flooring effect with nigral counts <50% (r2=0.68; p<0.001, n=10) (Fig 2A).
FIGURE 2.
(A) Striatal dopamine measures had flooring effect with > 50% nigral cell loss. (B-D): There was a linear distribution of striatal dopamine (% control side) compared to striatal FD KOCC, DTBZ and CFT BPND (% control side) with or without the clustered data points (Pearson’s correlation: r2= 0.95; r2= 0.94; r2= 0.94 respectively with p<0.001, n=16; r2= 0.84; r2= 0.85; r2= 0.86 respectively with p<0.001, n=10).
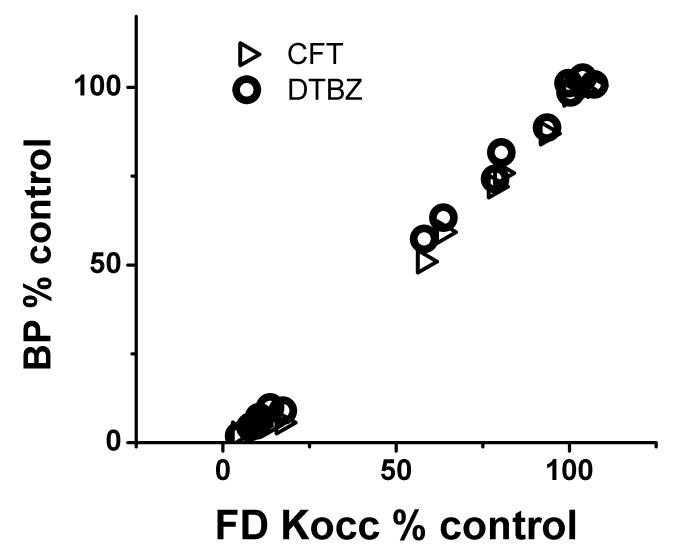
The injected-control ratio of striatal uptake for each radiotracer strongly correlated with each of the other two (r2=0.98, p<0.001 for each pairwise comparison) (Fig 3).
FIGURE 3.
Right-left ratio of striatal uptake for each radiotracer expressed in % of control side strongly correlated with each of the other two (Pearson: r2=0.98, p<0.001).
Absolute values for the reported measures are available in supplementary tables. MPTP had no effect on the tracer uptake for any of the ligands in the reference region (supplementary figure).
Discussion
The current study presents three key findings. First, striatal uptake measures of FD, DTBZ, or CFT did not faithfully reflect nigral cell counts throughout the full range of neuronal loss. Rather, striatal uptake correlated with nigral cell count, only with cell loss less than 50%. Second, striatal uptake for each radiotracer strongly correlated with striatal dopamine, a measure of terminal field function. Third, striatal uptake of all three radiotracers highly correlated with each other, suggesting a lack of differential regulation for the relevant specific binding sites (VMAT2 and DAT) or decarboxylase activity, regardless of the severity of the nigrostriatal damage. Each of these points plays a critical role in interpretation of clinical studies using these radiotracers.
We found that striatal uptake of FD, DTBZ, and CFT correlated with nigral cell counts as long as the nigral cell loss was less than 50%. Interestingly, striatal dopamine had a similar flooring effect when compared to the nigral cell counts. Previous reports on the correlation between striatal FD uptake and nigral cells have been inconsistent. An early study including only five humans reported a correlation between striatal FD uptake performed 5 to 62 months prior to death and postmortem measures of nigral TH-immunostained cell counts. 14 This study was limited by counting TH-stained cells only on a single midbrain slice from individuals with different diseases who were exposed to various medications. A study of eight MPTP-lesioned monkeys compared nigral cell counts also made from only one midbrain slice to striatal FD uptake but the distribution of data available for the analysis revealed two distinct clusters thereby casting doubt on the validity of the correlation analysis. 15 Only one study used graded MPTP lesioning and unbiased stereology. 16 This study limited analysis to those animals with no more than 35% loss of nigral neurons and found a significant correlation between FD uptake and striatal dopamine content, but no significant correlation to nigral cell counts. Poor distribution of data and limited severity of nigrostriatal injury in that study may contribute to the discrepancy with our findings since we included a wider range of injury. A recent study compared nigral dopaminergic cell counts with the striatal specific uptake ratio (SUR) of a DAT marker ([18F]FECNT) in six monkeys. 17 They reported strong correlations between striatal SUR and nigral dopaminergic cell counts. However, the correlation between striatal uptake and nigral cell counts was based on only 3 affected animals.
Our study, on the other hand, does confirm previous findings of correlation between striatal DAT tracer or FD uptake and striatal dopamine content. SPECT studies of DAT radioligands in rodents with nigrostriatal injury demonstrated a correlation between DAT binding and striatal dopamine. 18, 19 Another study reported a strong correlation between striatal dopamine and striatal FD uptake in MPTP treated monkeys. 15 Finally a study in PD patients found a correlation between striatal FD uptake and amphetamine induced raclopride displacement, an indirect measure of displaceable striatal dopamine. 20 Thus, several studies now confirm that the striatal uptake of either FD or a DAT radiotracer correlates with striatal dopamine.
Importantly, we found no differential regulation of striatal uptake of FD, DTBZ or CFT. This confirms our ex vivo findings of lack of differential regulation for VMAT and DAT as measured with autoradiography.11 However it differs from several other studies in humans and animals that suggest striatal DTBZ uptake changes differently from either FD or [11C]methylphenidate (MP, another DAT radioligand) in PD patients or MPTP-treated monkeys. 21, 22 A cross-sectional study showed that striatal MP uptake decreased to a greater extent than DTBZ uptake with increased PD severity, whereas FD uptake did not decrease much. 23 The authors proposed that this differential effect across the three radiotracers reflected up-regulation for FD, down-regulation for MP and little or no regulation affecting DTBZ uptake. Similarly, a study of asymptomatic carriers of the LRRK2 mutation, known to cause dopa-responsive parkinsonism, found normal striatal FD uptake whereas DTBZ and MP were both reduced, with MP showing the greater reduction. These authors suggested that the preservation of striatal FD uptake reflected up-regulation due to compensatory mechanisms or a disease process that targeted DAT more specifically. The discrepancies in these human studies and our findings might be explained by including subjects at different clinical stages, various lengths of drug exposure or differences in radiotracer specificity. Of course, differences between PD in humans and an MPTP-induced nonhuman primate model could contribute to these discrepancies between past studies and our findings as well.
Important considerations for human studies
Our findings strongly indicate that none of the PET radiotracers reflect nigral neuronal loss, once that loss exceeds 50%. We recently reported that there is a linear correlation between the severity of the hemiparkinsonism and the full range of nigral cell loss in these animals. 13 This contrasts with the flooring effect found for all terminal field measures, including the PET measures we now report, when nigral cell loss exceeds 50%. This could be the explanation for many inconsistencies between imaging and clinical measures of progression in human PD studies. 24, 25 Striatal uptake of these radiotracers may no longer accurately reflect the integrity of nigral dopaminergic neurons especially once nigral cell loss exceeds a critical threshold. Thus, the radiotracers may provide a linearly related measure of loss in mildly affected PD patients but as the disease progresses the PET measure may no longer reflect additional nigral cell destruction. Such a flooring effect of DTBZ uptake has been suggested by comparing the less to the more affected sides of PD patients. 26
The discrepancy between the nigral cell count and striatal dopamine measures raises the critical question of what pathogenic process would be optimal to quantify PD progression. Our findings suggest that in vivo PET measures of pre-synaptic nigrostriatal neurons reflect nigral counts only when the degree of injury is relatively mild. These PET measures, however, correlate with striatal dopamine throughout the full range of nigral cell loss. Yet, it remains uncertain whether striatal dopamine adequately measures disease progression. At least in monkeys, blinded clinical measures of parkinsonism strongly correlated with nigral neurons counts but did not correlate with striatal dopamine suggesting that nigral counts may be the more relevant measure.13 Other indirect measures such as changes in networks using MRI-based connectivity studies 27 or PET covariance maps of FDG 28 may reflect disease progression but whether these measures adequately reflect pathology in more severely affected patients is unclear. Development of in vivo imaging methods to measure alpha-synuclein deposition may be a better measure of the pathogenic process, 29 and may be less sensitive to symptomatic treatment effects but that remains to be proven.
Our study also determines whether striatal VMAT2, DAT and aromatic decarboxylase activities are differentially regulated. We found no evidence of differential regulation for these pre-synaptic markers. These PET measures strongly correlated with each other and with striatal dopamine. This is consistent with our ex vivo quantitative autoradiographic measures for DAT and VMAT2 in MPTP treated monkeys.11 These data do not exclude the possibility of regulation but rather show that any regulation, if present, must have occurred at a similar rate for all the above terminal field measures. Alternatively, differential regulation could take longer to develop than the two months during which we studied our animals. However, our animals had stable clinical measures of parkinsonism for more than one month prior to the final measures and previous studies demonstrate that these clinical and PET-based measures remain constant for at least a year. 30 It is possible that differences in the noise properties of imaging tracers, potentially confounding effects of drug treatment or different rate and mechanism of nigral cell injury contributed to the apparent differential regulation reported in PD patients.
It is important to note that the pathophysiology of nigrostriatal injury caused by MPTP in monkeys likely differs from that in people with PD. The anatomic distribution of the lesion severity differs since the MPTP-treated animals did not have preferentially more severe lesions in posterior putamen, as is commonly found in human idiopathic PD. Furthermore, striatal DAT transports this neurotoxin into dopaminergic neurons. The subsequent neuronal injury could begin in terminal fields 31 causing preferential loss of terminal field function before nigral cell bodies. However, initial axonal injury may occur in PD as well. 32 Our study did not investigate the time-course of the MPTP-induced injury to determine whether terminal field function declines before more proximal nigral injury. Nevertheless, this does not affect interpretation of the relationship between PET findings and in vitro measures since we included a full range of nigral cell damage in our studies. A preferential terminal field injury would be expected to affect the relationship between terminal fields and cell bodies at each level of severity rather than only after 50% nigral cell loss. Thus, we believe that this mode of injury is not likely to limit our findings to this specific pathologic injury.
Although the MPTP model does not represent the pathophysiology of PD, it allowed us to perform quantitative measurements of pre-synaptic dopaminergic markers and neuronal counts across a wide range of nigrostriatal injury. Overall, our data validated the FD, DTBZ and CFT PET measures showing that they at best reflect nigral cell count only with a cell loss less than 50% and the striatal dopamine content over the full range of dopamine depletion.
Supplementary Material
Acknowledgment
This study was funded by NIH (NS050425, NS058714, NS41509, and NS075321); Michael J Fox Foundation; Murphy Fund; American Parkinson Disease Association (APDA) Center for Advanced PD Research at Washington University; Greater St. Louis Chapter of the APDA; McDonnell Center for Higher Brain Function; Hartke Fund; Barnes-Jewish Hospital Foundation (Elliot Stein Family Fund for PD Research & the Jack Buck Research Fund).
We also thank Christina Zukas, Darryl Craig, and Terry Anderson for expert technical assistance.
Reference List
- 1.Brooks DJ, Frey KA, Marek KL, et al. Assessment of neuroimaging techniques as biomarkers of the progression of Parkinson’s disease. Exp.Neurol. 2003;184(Suppl 1):S68–S79. doi: 10.1016/j.expneurol.2003.08.008. [DOI] [PubMed] [Google Scholar]
- 2.Fahn S, Oakes D, Shoulson I, et al. Levodopa and the progression of Parkinson’s disease. N.Engl.J.Med. 2004;351:2498–508. doi: 10.1056/NEJMoa033447. [DOI] [PubMed] [Google Scholar]
- 3.Ravina B, Eidelberg D, Ahlskog JE, et al. The role of radiotracer imaging in Parkinson disease. Neurology. 2005;64:208–15. doi: 10.1212/01.WNL.0000149403.14458.7F. [DOI] [PubMed] [Google Scholar]
- 4.Biglan KM, Holloway RG. Surrogate endpoints in Parkinson’s disease research. Curr.Neurol.Neurosci.Rep. 2003;3:314–20. doi: 10.1007/s11910-003-0008-y. [DOI] [PubMed] [Google Scholar]
- 5.Dorsey ER, Holloway RG, Ravina BM. Biomarkers in Parkinson’s disease. Expert.Rev.Neurother. 2006;6:823–31. doi: 10.1586/14737175.6.6.823. [DOI] [PubMed] [Google Scholar]
- 6.Tabbal SD, Mink JW, Antenor JA, Carl JL, Moerlein SM, Perlmutter JS. 1-Methyl-4-phenyl-1,2,3,6-tetrahydropyridine-induced acute transient dystonia in monkeys associated with low striatal dopamine. Neuroscience. 2006;141:1281–7. doi: 10.1016/j.neuroscience.2006.04.072. [DOI] [PubMed] [Google Scholar]
- 7.Tai YC, Ruangma A, Rowland D, et al. Performance evaluation of the microPET focus: a third-generation microPET scanner dedicated to animal imaging. J Nucl.Med. 2005;46:455–63. [PubMed] [Google Scholar]
- 8.Rowland DJ, Garbow JR, Laforest R, Snyder AZ. Registration of [18F]FDG microPET and small-animal MRI. Nucl.Med.Biol. 2005;32:567–72. doi: 10.1016/j.nucmedbio.2005.05.002. [DOI] [PubMed] [Google Scholar]
- 9.Patlak CS, Blasberg RG. Graphical evaluation of blood-to-brain transfer constants from multiple-time uptake data: Generalizations. J.Cereb.Blood Flow Metab. 1985;5:584–90. doi: 10.1038/jcbfm.1985.87. [DOI] [PubMed] [Google Scholar]
- 10.Logan J, Fowler JS, Volkow ND, Wang GJ, Ding YS, Alexoff DL. Distribution volume ratios without blood sampling from graphical analysis of PET data. J.Cereb.Blood Flow Metab. 1996;16:834–40. doi: 10.1097/00004647-199609000-00008. [DOI] [PubMed] [Google Scholar]
- 11.Tian L, Karimi M, Loftin SK, et al. No differential regulation of dopamine transporter (DAT) and vesicular monoamine transporter 2 (VMAT2) binding in a primate model of Parkinson disease. PLoS.One. 2012;7:e31439. doi: 10.1371/journal.pone.0031439. [DOI] [PMC free article] [PubMed] [Google Scholar]
- 12.Karimi M, Carl JL, Loftin S, Perlmutter JS. Modified high-performance liquid chromatography with electrochemical detection method for plasma measurement of levodopa, 3-O-methyldopa, dopamine, carbidopa and 3,4-dihydroxyphenyl acetic acid. J.Chromatogr.B Biomed.Sci.Appl. 2006;836:120–3. doi: 10.1016/j.jchromb.2006.03.027. [DOI] [PubMed] [Google Scholar]
- 13.Tabbal SD, Tian L, Karimi M, Brown CA, Loftin SK, Perlmutter JS. Low nigrostriatal reserve for motor parkinsonism in nonhuman primates. Exp.Neurol. 2012;237:355–62. doi: 10.1016/j.expneurol.2012.07.008. [DOI] [PMC free article] [PubMed] [Google Scholar]
- 14.Snow BJ, Tooyama I, McGeer EG, et al. Human positron emission tomographic [18F]fluorodopa studies correlate with dopamine cell counts and levels. Ann.Neurol. 1993;34:324–30. doi: 10.1002/ana.410340304. [DOI] [PubMed] [Google Scholar]
- 15.Pate BD, Kawamata T, Yamada T, et al. Correlation of striatal fluorodopa uptake in the MPTP monkey with dopaminergic indices. Ann.Neurol. 1993;34:331–8. doi: 10.1002/ana.410340306. [DOI] [PubMed] [Google Scholar]
- 16.Yee RE, Irwin I, Milonas C, et al. Novel observations with FDOPA-PET imaging after early nigrostriatal damage. Mov.Disord. 2001;16:838–48. doi: 10.1002/mds.1168. [DOI] [PubMed] [Google Scholar]
- 17.Masilamoni G, Votaw J, Howell L, et al. (18)F-FECNT: validation as PET dopamine transporter ligand in parkinsonism. Exp.Neurol. 2010;226:265–73. doi: 10.1016/j.expneurol.2010.08.024. [DOI] [PMC free article] [PubMed] [Google Scholar]
- 18.Alvarez-Fischer D, Blessmann G, Trosowski C, et al. Quantitative [(123)I]FP-CIT pinhole SPECT imaging predicts striatal dopamine levels, but not number of nigral neurons in different mouse models of Parkinson’s disease. Neuroimage. 2007;38:5–12. doi: 10.1016/j.neuroimage.2007.05.056. [DOI] [PubMed] [Google Scholar]
- 19.Gleave JA, Farncombe TH, Saab C, Doering LC. Correlative single photon emission computed tomography imaging of [(123)I]altropane binding in the rat model of Parkinson’s. Nucl.Med.Biol. 2011;38:741–9. doi: 10.1016/j.nucmedbio.2010.12.006. [DOI] [PubMed] [Google Scholar]
- 20.Piccini P, Pavese N, Brooks DJ. Endogenous dopamine release after pharmacological challenges in Parkinson’s disease. Ann.Neurol. 2003;53:647–53. doi: 10.1002/ana.10526. [DOI] [PubMed] [Google Scholar]
- 21.Lee CS, Samii A, Sossi V, et al. In vivo positron emission tomographic evidence for compensatory changes in presynaptic dopaminergic nerve terminals in Parkinson’s disease. Ann Neurol. 2000;47:493–503. [PubMed] [Google Scholar]
- 22.Chen MK, Kuwabara H, Zhou Y, et al. VMAT2 and dopamine neuron loss in a primate model of Parkinson’s disease. J Neurochem. 2008;105:78–90. doi: 10.1111/j.1471-4159.2007.05108.x. [DOI] [PMC free article] [PubMed] [Google Scholar]
- 23.Lee CS, Samii A, Sossi V, et al. In vivo positron emission tomographic evidence for compensatory changes in presynaptic dopaminergic nerve terminals in Parkinson’s disease. Ann.Neurol. 2000;47:493–503. [PubMed] [Google Scholar]
- 24.Freed CR, Greene PE, Breeze RE, et al. Transplantation of embryonic dopamine neurons for severe Parkinson’s disease. New Engl.J.Med. 2001;344:710–8. doi: 10.1056/NEJM200103083441002. [DOI] [PubMed] [Google Scholar]
- 25.Lang AE, Gill S, Patel NK, et al. Randomized controlled trial of intraputamenal glial cell line-derived neurotrophic factor infusion in Parkinson disease. Ann.Neurol. 2006;59:459–66. doi: 10.1002/ana.20737. [DOI] [PubMed] [Google Scholar]
- 26.Martin WR, Wieler M, Stoessl AJ, Schulzer M. Dihydrotetrabenazine positron emission tomography imaging in early, untreated Parkinson’s disease. Ann.Neurol. 2008;63:388–94. doi: 10.1002/ana.21320. [DOI] [PubMed] [Google Scholar]
- 27.Helmich RC, Derikx LC, Bakker M, Scheeringa R, Bloem BR, Toni I. Spatial Remapping of Cortico-striatal Connectivity in Parkinson’s Disease. Cereb.Cortex. 2009 doi: 10.1093/cercor/bhp178. [DOI] [PubMed] [Google Scholar]
- 28.Tang CC, Poston KL, Dhawan V, Eidelberg D. Abnormalities in metabolic network activity precede the onset of motor symptoms in Parkinson’s disease. J.Neurosci. 2010;30:1049–56. doi: 10.1523/JNEUROSCI.4188-09.2010. [DOI] [PMC free article] [PubMed] [Google Scholar]
- 29.Braak H, Ghebremedhin E, Rub U, Bratzke H, Del Tredici K. Stages in the development of Parkinson’s disease-related pathology. Cell Tissue Res. 2004;318:121–34. doi: 10.1007/s00441-004-0956-9. [DOI] [PubMed] [Google Scholar]
- 30.Perlmutter JS, Tempel LW, Black KJ, Parkinson D, Todd RD. MPTP induces dystonia and parkinsonism: Clues to the pathophysiology of dystonia. Neurology. 1997;49:1432–8. doi: 10.1212/wnl.49.5.1432. [DOI] [PubMed] [Google Scholar]
- 31.Meissner W, Prunier C, Guilloteau D, Chalon S, Gross CE, Bezard E. Time-course of nigrostriatal degeneration in a progressive MPTP-lesioned macaque model of Parkinson’s disease. Mol.Neurobiol. 2003;28:209–18. doi: 10.1385/MN:28:3:209. [DOI] [PubMed] [Google Scholar]
- 32.Burke RE. Intracellular signalling pathways in dopamine cell death and axonal degeneration. Prog.Brain Res. 2010;183:79–97. doi: 10.1016/S0079-6123(10)83005-5. [DOI] [PMC free article] [PubMed] [Google Scholar]
Associated Data
This section collects any data citations, data availability statements, or supplementary materials included in this article.


