

Abstract
The perciform suborder Notothenoidei provides a compelling opportunity to study the adaptive radiation of a marine species flock in the cold Southern Ocean surrounding Antarctica. To enable genome-level studies of these psychrophilic fishes, we estimated the sizes of the genomes of 11 Antarctic species and generated high-quality BAC libraries for 2, the notothen Notothenia coriiceps and the icefish Chaenocephalus aceratus. Our results indicate that evolution of phylogenetically derived notothenioid families, [e.g., the icefishes (Channichthyidae)], was accompanied by genome expansion. Species (n = 6) of the basal family Nototheniidae had C values that ranged between 0.98 and 1.20 pg, whereas those of the icefishes, the notothenioid crown group, were 1.66–1.83 pg (n = 4 species). The BAC libraries VMRC-19 (N. coriiceps) and VMRC-21 (C. aceratus) comprised 12X and 10X coverage of the respective genomes and had average insert sizes of 138 and 168 kb. Greater than 60% of paired BAC ends sampled from each library (~0.1% of each genome) contained repetitive sequences, and the repetitive element landscapes of the 2 genomes (13.4% of the N. coriiceps genome and 14.5% for C. aceratus) were similar. The representation and depth of coverage of the libraries were verified by identification of multiple Hox gene contigs: six discrete Hox clusters were found in N. coriiceps and at least five Hox clusters were found in C. aceratus. Given the unusual anatomical and physiological adaptations of the notothenioids, the availability of these BAC libraries sets the stage for expanded analysis of the psychrophilic mode of life.
The modern ichthyofauna of the Southern Ocean is uniquely depauperate with respect to species diversity (Eastman, 2005). Although the Southern Ocean constitutes approximately 10% of our planet’s oceanic waters, the number of fish species is quite small (~300 species vs. a global diversity of ~25,000 species), and almost half belong to a single perciform suborder, the Notothenioidei. The origin of this taxonomic restriction results from the dramatic paleoclimatic and paleogeographic history of Antarctica (Eastman, ’93) during the Cenozoic Era.
The opening of the Drake Passage, which separates Antarctica from South America, occurred via tectonic rifting ~40–34 million years (Myr) ago (Kennett, ’77; Livermore et al., 2005; Scher and Martin, 2006). The onset of widespread glaciation of Antarctica ~34 Myr ago (Zachos et al., 2001), which is attributable to declining atmospheric CO2 (DeConto and Pollard, 2003), the establishment of the Antarctic Circumpolar Current and the development of the Antarctic Polar Front (between ~50 and 60°S), decoupled the Southern Ocean from warmer, subtropical waters to the north (Kennett, ’77). A cooling trend that began in the late Paleocene/early Eocene (~55 Myr ago), when water temperatures were 15–20°C, accelerated during the Miocene until the Southern Ocean approached the freezing point of seawater (−1.9°C) ~14–5 Myr ago (Clarke, ’90).
As the Southern Ocean cooled, the shallow water, cosmopolitan, and temperate fish fauna of late Eocene (38 Myr ago) became largely extinct owing to the destruction of inshore habitat and changes in trophic structure caused by repeated ice sheet scouring of the continental margin (Eastman, 2005). Thus, fish diversity was reduced and new ecological niches became available to taxa, such as the notothenioid fishes, which were diversifying in situ. Today, species of the notothenioid suborder constitute 46% of all the fish species of the Southern Ocean. At the highest latitudes, notothenioid species dominance is particularly clear, encompassing 77% of species diversity and 90% of biomass (Eastman, 2005).
The ancestral notothenioid stock probably arose as a sluggish, bottom-dwelling perciform species some 40–60 Myr ago in the cool temperate shelf waters of the Antarctic continent (DeWitt, ’71; Eastman, ’93; Eastman and Clarke, ’98). With the elimination of most of the Eocene ichthyofauna, the notothenioids diversified to fill the many vacated niches. Lacking swim bladders, the Notothenioidei evolved toward pelagic or partially pelagic zooplanktivory and piscivory by reduction of skeletal mineralization and enhancement of lipid deposition. Termed pelagization, the tailoring of morphology for life in the water column is the hallmark of the notothenioid radiation, has arisen independently several times in different clades (Eastman, ’97, ’99; Near et al., 2007), and reflects the retention of larval characteristics in the adult (pedomorphism) (Eastman, ’97). In the dominant family Nototheniidae, ~50% of the Antarctic species are semipelagic, epibenthic, cryopelagic, or pelagic (Eastman, 2005). On the basis of their rapid speciation (average time for speciation of 0.76–2.1 Myr), geographical restriction, and high endemism, the Notothenioidei are the best described example of a marine species flock (Eastman, 2000; Eastman and McCune, 2000).
Absence of niche competition alone would not have guaranteed the radiation of the notothenioids had they not evolved biochemical and physiological adaptations to their frigid environment. One key evolutionary adaptation of the notothenioids was the de novo acquisition of antifreeze glycoproteins, which bind to the surfaces of ice crystals that form in these fishes to inhibit ice propagation in their hyposmotic fluids (Cheng, ’98; Cheng and Detrich, 2007). The evolution of the antifreeze glycoprotein genes from a pancreatic, trypsinogen-like gene (Chen et al., ’97; Cheng and Chen, ’99) is a remarkable exemplar of a critical genetic innovation that fostered an extensive species radiation (Montgomery and Clements, 2000).
The notothenioids are notable not only for their resistance and compensatory adaptations to the extreme Antarctic marine environment, but also for their regressive evolutionary changes or losses of function [the “disaptations” of Montgomery and Clements (2000) and references therein]. Antarctic notothenioids are cold stenotherms—these high latitude species typically live at temperatures between −1.9 and +2°C and have incipient lethal temperatures near 5°C that cannot be raised by acclimation in the laboratory (Somero and DeVries, ’67). This stenothermality results in part from adaptive alterations to the biochemical, cellular, and physiological systems of these fishes. Major examples of compensatory adaptation include efficient microtubule assembly (Williams et al., ’85; Detrich et al., ’89, ’92, 2000; Paluh et al., 2004) and protein translocation at cold temperatures (Römisch et al., 2003), homeoviscous adaptation of membrane lipids to preserve membrane fluidity (Logue et al., 2000), and cold-stable lens crystallins that prevent cataract formation (Kiss et al., 2004). Consistent with their long isolation in a constantly cold environment, the Antarctic notothenioids have lost the inducible heat shock response (Hofmann et al., 2000; Buckley et al., 2004), which seems to have been recruited to an adaptive, constitutive status to deal with elevated denaturation of proteins caused by cold stress (Place et al., 2004; Place and Hofmann, 2005; Todgham et al., 2007). Other striking regressive changes include the loss of erythrocytes (Ruud, ’54) and the respiratory transport protein hemoglobin (Cocca et al., ’95, 2000; Zhao et al., ’98; Near et al., 2006) by all species of the icefish family and independent losses of cardiac myoglobin in a subset of icefish species (Sidell et al., ’97; O’Brien and Sidell, 2000; Sidell and O’Brien, 2006).
Recently, Chen et al. (2008) reported a large-scale transcriptomic up-regulation of 177 gene families in the Antarctic toothfish, Dissostichus mawsoni (Nototheniodei: Nototheniidae), with respect to their orthologs in temperate and tropical fish. At the genomic level, they found that 118 gene families in several notothenioid species have undergone substantial gene duplication relative to the temperate/tropical species. Overlap of the duplicated gene set with the transcriptionally up-regulated gene set suggested that gene family expansion may contribute to cold adaptation of cellular and physiological function, a conclusion supported by the augmentation of tubulin genes in the bullhead notothen, Notothenia coriiceps (Parker and Detrich, ’98). It is notable that 17 families of LINEs showed Antarctic-specific duplication, which suggests that LINE expansion may have facilitated gene duplication in Antarctic notothenioids by retrotransposition-mediated gene transduction (Xing et al., 2006).
The above findings suggest that the genomes of notothenioids are evolutionarily dynamic and that this plasticity may have contributed to the overall success of the group. The development of genomic resources from these difficult-to-obtain specimens is thus important, well justified, and valuable to a wide community of genomic, evolutionary, and ecological biologists and biomedical scientists. In 2003, we collected high molecular weight (HMW) DNA from a wide assortment of notothenioid fishes, with the aim of enabling genomic studies in this group, and subsequently submitted a white paper to the BAC library network at the National Human Genome Research Institute (NHGRI) to request construction of high-quality and high-representation BAC genomic libraries from selected notothenioid species. We were informed that BAC libraries would be generated from two of the species: Chaenocephalus aceratus (blackfin or Scotia Arc icefish) and N. coriiceps (bullhead notothen or yellowbelly rockcod). The selection of these two species was largely strategic in that C. aceratus represents a lineage (icefishes) devoid of erythrocytes and lacking hemoglobin genes, whereas N. coriiceps represents an erythrocyte-producing species in which hemoglobin genes are intact and functional. Thus, these two species, although not representative of the entire gamut of notothenioids, are extremely useful for genomic comparisons of processes that involve differences in their respective physiologies and anatomies as a result of hemoglobin loss by the icefishes. In this article, we describe the generation of BAC libraries from these 2 representative notothenioid species and further provide genome size estimates for 11 species of notothenioid fishes. Quality assurance data are provided for both BAC libraries that validate the utility of these resources for genomic analyses.
MATERIALS AND METHODS
Collection of Specimens
Specimens of the 11 notothenioid species (see Table 1 for names) used in this study (including the Antarctic blackfin icefish, C. aceratus, and the bullhead notothen, N. coriiceps) were collected by bottom trawls or via baited fish traps deployed from the ARSV Laurence M. Gould in Dallmann Bay near Brabant Island in the Palmer Archipelago. They were transported alive to Palmer Station, Antarctica, where they were maintained in seawater aquaria at −1.5 to +0.5°C.
Table 1.
Estimated genome sizes of notothenioid fishes relative to outgroups.
| Family | Species | No. examined | C value (pg) |
|---|---|---|---|
| Gasterosteidae | Gasterosteus aculeatusa,b,c | NA | 0.58–0.70 |
| Percidae | Perca flavescens,c,d P. fluviatilis,a,e Sander luciopercaa | NA | 0.90–1.22 |
| Serranidae | Mycteroperca interstitialis,c M. tigris,b,c,f Siniperca chuatsig | NA | 0.80–1.30 |
| Nototheniidae | Dissostichus mawsoni | 3 | 1.20±0.04 |
| Gobionotothen gibberifrons | 1 | 0.98 | |
| Lepidonotothen nudifrons | 1 | 1.12 | |
| Notothenia coriiceps | 2 | 1.13±0.21 | |
| Trematomus larseni | 2 | 1.16±0.001 | |
| Trematomus newnesi | 1 | 1.01 | |
| Bathydraconidae | Parachaenichthys charcoti | 2 | 1.34±0.05 |
| Channichthyidae | Chaenocephalus aceratus | 2 | 1.79±0.14 |
| Champsocephalus gunnari | 2 | 1.83±0.22 | |
| Chionodraco rastrospinosus | 2 | 1.66±0.04 | |
| Pseudochaenichthys georgianus | 2 | 1.79±0.09 |
NA, not applicable.
Vinograd (’98);
Hinegardner (’68);
Hinegardner and Rosen (’72);
Vialli (’57);
Mirsky and Ris (’51);
Cui et al. (’91).
Sample Collection for Genome Size Estimates and High Molecular Weight DNA
All specimens used in this study were anesthetized with MS222 (0.1% (w/v)). Red-blooded species (non-icefishes) were bled by collecting blood through heparinized microhematocrit tubes from small incisions in the caudal sinus. For each specimen, we collected approximately 100 μL of blood. Blood was transferred to siliconized 1.5 mL microfuge tubes and brought to 1 mL with 1 × phosphate buffered saline (PBS). A 50 μl aliquot (for genome size determination) was fixed in 70% ethanol for 30 min and frozen at −70°C. The remainder was centrifuged briefly at 3,000 rpm and the supernatants removed. Cells were resuspended in 500 μL of PBS, counted with a hemacytometer, brought to a cell concentration of ~105 cells/mL in 1% InCert agarose (FMC) in 1 × PBS, and then embedded in Bio-Rad plug molds (80 μL per plug). HMW DNA was prepared in situ in the agarose plugs using methods described earlier (Amemiya et al., ’96).
For icefishes, it was necessary to collect significant amounts of blood (>25 mL) in order to isolate sufficient numbers of leucocytes for flow cytometry and agarose embedding owing to the relative low numbers of cells per hematocrit volume (Hureau et al., ’77). Ten-milliliter heparinized syringes were used to collect blood via cardiac puncture of anesthetized specimens using 18-gauge needles. Blood samples were transferred to 15 mL conical centrifuge tubes, cells were collected by centrifugation for 10 min in a refrigerated table top centrifuge at 2,000 rpm, and the buffy coats were removed. Cells were transferred to siliconized 1.5 mL microfuge tubes, and samples were handled as described above for the red-blooded species.
Flow Cytometric Determination of Genome Size
Samples for flow cytometry were thawed on ice, centrifuged at 3,000 rpm for 30 sec in a microfuge, and the respective supernatants removed. Cells were resuspended in 1 mL of 1 × PBS and allowed to equilibrate for at least 30 min on ice. Just before flow cytometry, cells were pelleted as above, resuspended in propidium iodide staining solution (Arumuganathan and Searle, ’91), and incubated on ice for 15 min. Flow cytometric measurements were performed using a FACSort flow cytometer (Becton-Dickinson, San Jose, CA). An internal standard, chicken erythrocyte nuclei (2.33 pg/2C nucleus), was included in each run. Several thousand cells were measured per sample and each experiment consisted of four replicates. The genome sizes of the 11 species were calculated via comparison to the internal standard.
BAC Cloning
HMW DNAs were analyzed from two specimens each of C. aceratus and N. coriiceps via pulsed field gel (PFG) analysis on a CHEF DRIII apparatus (Bio-Rad, Hercules, CA). The DNAs were of generally good quality based on their size distribution in the PFG runs (Amemiya et al., ’96). BAC library construction closely followed earlier published methods (Osoegawa et al., ’98; Danke et al., 2004). In short, HMW DNA from one specimen of each species was subjected to a series of partial digest titrations using EcoRI and EcoRI methylase, visually assessed via analytical PFG electrophoresis, then subjected to preparative scale-up using optimized digestion conditions. Restriction fragments were run in preparative PFGs using a CHEF–Mapper apparatus (Bio-Rad), fragments of desired sizes excised and electroeluted (Strong et al., ’97), and purified fragments ligated with EcoRI-digested and dephosphorylated pCCBACE1 vector (Epicentre Technologies, Madison, WI). The ligation products were then transformed into DH10B (T1 resistant) electro-competent cells (Invitrogen) and plated onto LB-agar media supplemented with chloramphenicol (12.5 μg/mL). Crude analysis of the transformant insert sizes was performed with the Colony Fast-Screen system (Epicentre Technologies); PFG analysis of NotI-digested transformants was subsequently used to more accurately analyze the insert sizes and to determine which size fraction would ultimately be utilized for construction of the libraries. Once selected, the appropriate size fractions were ligated in scaled-up reactions and bulk transformations were carried out. Transformants were flash frozen (liquid nitrogen bath) in SOC medium containing 7.5% glycerol and stored at −70°C. Before arraying, frozen transformants were thawed at room temperature and ~400 colonies were plated per 10 cm2 LB agar plate containing 12.5 μg/mL chloramphenicol, 120 μg/mL X-gal, and 0.1 mM IPTG. Colonies were cultured overnight at 37°C. White (recombinant) colonies were picked into 384-well microtiter dishes (Genetix, Boston, MA) containing LB media with 12.5 μg/mL chloramphenicol and 7.5% glycerol using a colony picking robot (Norgren Systems, Ronceverte, WV) and then cultured overnight at 37°C and stored at −70°C. Both libraries encompass at least 10X coverage based on the average insert sizes, the percentage of empty clones (Table 2), and the respective genome size as estimated by flow cytometry (described above). Replicas of the library as well as high-density colony filters (22 cm2) were made using the Total Array System (BioRobotics, Boston, MA).
Table 2.
Summary statistics for BAC libraries constructed in this study.
| C. aceratus (VMRC-21) | N. coriiceps (VMRC-19) | |
|---|---|---|
| Vector used | pCC1BAC | pCC1BAC |
| Restriction enzyme used | EcoRI | EcoRI |
| DNA source | Leucocytes | Erythrocytes |
| Number of 384-well plates | 336 | 288 |
| E. coli strain used | DH10B T1 resistant | DH10B T1 resistant |
| Empty wells | 0 | 0 |
| Estimated non-recombinant clones and vector artifact clones | 6,451 (5%) | 8,847 (8%) |
| Estimated insert-containing clones | 122,573 (95%) | 101,745 (92%) |
| Average insert size | 168 kb | 138 kb |
| Median insert size | 168 kb | 155 kb |
| Estimated genome coverage | 10X | 12X |
| Restriction enzyme used | EcoRI | EcoRI |
Quality Control Experiments
Average insert sizes were determined from ~120 randomly selected clones per library via restriction analysis as earlier described (Danke et al., 2004). To establish insert cloning efficiency and obtain estimates of repetitive element densities in the two notothenioid fishes, paired reads of BAC clones representing ~0.1% of each genome were obtained by automated DNA sequencing (The Institute for Genomic Research, now the J. Craig Venter Institute, Rockville, MD). Sequence from a total of 2.0 × 10⁶ bp of the C. aceratus genome, representing 2,733 ends, and of 1.0 × 10⁶ bp of the N. coriiceps genome (1,388 ends) was obtained. The end sequence data were also analyzed for repetitive elements using RepeatMasker v3.0 (Smit et al., 2004), CENSOR (Kohany et al., 2006), and the Repbase Update (Jurka et al., 2005). To assure that the library encompassed expected genomic regions we hybridized high density colony filters with a generic Hox homeobox probe and restriction fingerprinted all resultant clones using an automated fingerprinting method (Schein et al., 2004).
Animal Care
Research involving Antarctic fishes was approved by Northeastern University’s Institutional Animal Care and Use Committee and conformed to NIH guidelines.
RESULTS AND DISCUSSION
Genome Size Estimates
Figure 1 illustrates the relationships between the 11 notothenioid species examined in this study. The six notothens (family Nototheniidae, n = 50 species total), one dragonfish (Bathydraconidae, n = 16), and four icefishes (Channichthyidae, n = 16) represent a cross section of red- and white-blooded species. [See Eastman (2005) and his web site http://www.oucom.ohiou.edu/dbms-eastman for a complete listing of valid notothenioid species.] Percids (perches) are thought to be the sister group to the notothenioids, and the Serranidae (sea basses) and Gasterosteidae (sticklebacks) are also closely related (Dettaï and Lecointre, 2004).
Figure 1.

Phylogenetic relationships among the 11 notothenioid species examined in this study. Six notothens of a basal, red-blooded family (Nototheniidae) and four icefishes of the white-blooded notothenioid crown group (Channichthyidae) are shown with the size ranges of their genomes (see Table 1 for species names and genome estimates). One species (P. charcoti) of the red-blooded dragonfish (Bathydraconidae), the sister group to the icefish, is also presented. The perches (Percidae) are the probable sister group to the Notothenioidei (see Table 1 for the species used to obtain the genome range estimate). The positions of the notothenioid families Bovichtidae, Eleginops, Artedidraconidae, and Harpagiferidae (gray font; not examined herein) are shown for comparison. The closed circles indicate key evolutionary events during the diversification of the Notothenioidei: the acquisition of antifreeze proteins; the decline in hemoglobin multiplicity and performance; and the losses of hemoglobins and of red blood cells by the icefishes. The tree is based on the studies of Lecointre et al. (’97), Balushkin (2000), Near et al. (2004), and Near and Cheng (2008).
Genome size determinations were estimated for the notothenioids by flow cytometry using erythrocytes from non-icefish specimens and leukocytes from icefishes, with chicken erythrocyte nuclei as an internal standard. Figure 2 shows graphical results from representative flow cytometry experiments for two red-blooded notothens, Gobionotothen gibberifrons and N. coriiceps (panels A, B), and for two white-blooded icefishes, C. aceratus and Chionodraco rastrospinosus (panels C, D). Genome size estimates for all species examined in this study, and for several related groups, are summarized in Figure 1 and Table 1.
Figure 2.
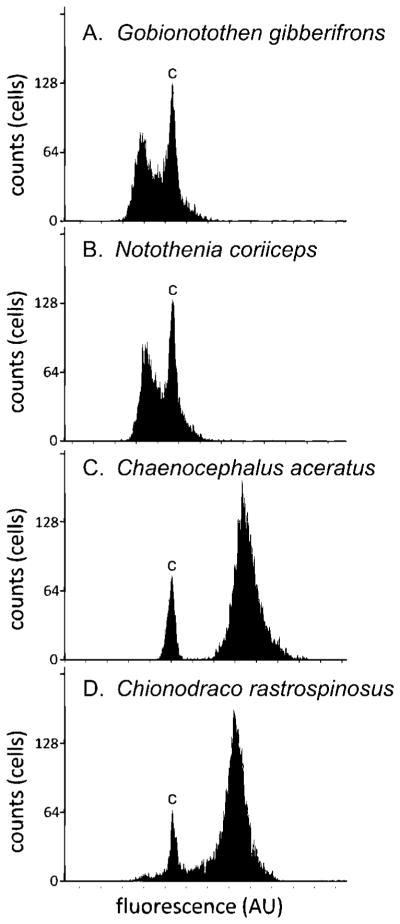
Representative flow cytometric histograms of four notothenioid specimens: (A) Gobionotothen gibberifrons; (B) Notothenia coriiceps; (C) Chaenocephalus aceratus; (D) Chionodraco rastrospinosus. The Y-axis represents the number of cells counted and the X-axis represents propidium iodide fluorescence in arbitrary units (AU). The peak labeled “C” in each panel was obtained from chicken erythrocyte nuclei (internal control, 2.33 pg per 2C nucleus); relative DNA contents were determined by extrapolation with this internal control and are given in Table 1. The peaks for the two nototheniids (A and B) fall to the left of the internal standard, whereas those for the two channichthyids (C and D) fall to the right of the internal standard and indicate the larger genome sizes for the two icefishes. The plots shown in A–D are from single flow cytometric runs; an additional three runs were performed for each specimen in order to assure consistency and accuracy. Thus, the final determination of genome size was based on several thousands of cell measurements.
Although our taxonomic sampling of the Notothenioidei is incomplete, there is a trend toward increased genome size as one moves from the phylogenetically basal Nototheniidae to the derived families Bathydraconidae and Channichthyidae. The basal Nototheniidae, by contrast, have genomes whose sizes are comparable to those of outgroups Percidae, Serranidae, and Gasterosteidae, suggesting that a C value of ~1 pg is ancestral for the notothenioid suborder. Our genome size estimates for the 11 notothenioids fall in a range that is consistent with the limited number of earlier measurements (Morescalchi et al., ’92, ’96; Hardie and Hebert, 2003, 2004; Chen et al., 2008). Furthermore, comparison of data for the two species common to our study and earlier reports, Antarctic toothfish D. mawsoni and blackfin icefish C. aceratus, indicate that our estimates are robust. We calculate that the genome of D. mawsoni contains 1.20 pg of DNA, which is slightly greater than values (0.97, 1.03 pg) reported earlier (Hardie and Hebert, 2003, 2004; Chen et al., 2008), whereas our result for C. aceratus (1.79 pg) is slightly smaller than the 1.86 pg reported by Chen et al. (2008). The small sample size of our study precludes a definitive analysis of the patterns of genome evolution, but our estimates do support the hypothesis that genome expansion accompanied the evolution of phylogenetically derived notothenioids. In particular, the icefishes (channichthyids), which are considered the most phylogenetically derived group within the notothenioids, have notably larger genomes (Figs. 1 and 2; Table 1).
Chen et al. (2008) recently reported that 118 gene families are substantially expanded in polar notothenioids with respect to temperate representatives, and that five notothenioid species show a trend toward increased genome size that correlates with a derived phylogenetic position. They suggest that evolutionary adaptation of Antarctic notothenioids to chronic and extremely cold temperature has led to expansion of gene families involved in metabolic processes (e.g., protein biosynthesis, folding and degradation, lipid metabolism, etc.) that are critical to the physiological fitness of these organisms. Our results provide a complementary, non-exclusive rationale, namely that genome expansion may have been driven in part to offset reduced hemoprotein function in polar notothenioids. Relative to temperate and tropical fishes, basal notothenioid clades (i.e., Nototheniidae) have low hematocrits and red cell hemoglobin concentrations (Kunzmann et al., ’91). Furthermore, hemoglobin multiplicity, functionality, and concentration tend to decline in red-blooded species the more derived their notothenioid group (D’Avino and di Prisco, ’88; Kunzmann et al., ’91; Bargelloni et al., ’98; di Prisco, ’98; di Prisco et al., 2007). Loss of hemoprotein expression by icefishes was clearly maladaptive as shown by their numerous compensatory cardiovascular adaptations, including increases in mitochondrial densities in heart muscle, cardiac output, and capillary density (Near et al., 2006; Sidell and O’Brien, 2006; Cheng and Detrich, 2007; Detrich, 2007). Thus, we hypothesize that the genomes of icefishes also expanded to provide additional gene templates to support the observed changes in cardiovascular physiology. The two BAC libraries described in this report provide the opportunity to examine these and other hypotheses in detail.
BAC Library Construction
BAC libraries were constructed for two notothenioids, the red-blooded notothen N. coriiceps and the white-blooded channichthyid C. aceratus. These taxa were selected by the NIH BAC Resource Network (http://www.genome.gov/10001844) as representative of two disparate lineages of the Antarctic notothenioids that, by comparative genomics, could reveal new information regarding the genetics of evolutionary adaptation to extreme environments. Construction of the libraries was performed under the auspices of the NHGRI and followed rigid quality control standards that mandated: (1) 10X genomic coverage; (2) average insert size of ~150 kb; (3) assurance that the library contained a minimum of 95% insert-containing clones; and (4) little or no detectable contamination by bacterial DNA sources.
The single most important factor in generating large insert BAC clones is the preparation of HMW DNA of impeccable integrity and quality. Agarose embedding of cells and subsequent processing of DNA needed to be accomplished while in the field in Antarctica under less than ideal laboratory conditions. Nonetheless, efforts were made to process the specimens immediately after collection and to apply fastidious technique. Because a PFG apparatus was not available in the field in Antarctica, the quality of the isolated DNAs could be assessed only after the samples were transported back to Seattle. Based on visual inspection of these DNAs by PFG electrophoresis (not shown), it was concluded that most of the DNAs prepared in the field (including those of C. aceratus and N. coriiceps) were of relatively HMW and seemed to be of suitable quality for BAC library construction.
In pilot experiments, agarose-embedded DNAs from both species were subjected to partial digestions with EcoRI. After PFG verification, optimized reaction conditions were scaled up for preparative runs (Osoegawa et al., ’98). Large-scale digests were separated on preparative pulsed field gels and fractions were taken. The quality of EcoRI partial digests was assessed by analytical pulsed field gels (Fig. 3A). Fractions containing fragments in the desired size range (roughly between 140 and 200 kb) were used to scale up the ligations and transformations (which were subsequently archived in bulk at −70°C). Figure 3B shows a gel of 20 randomly selected C. aceratus clones that were digested with NotI in order to determine insert sizes. In total, more than 100 individual BAC clones were analyzed in this way and more than 200 additional clones were analyzed using the less robust EpilyseTM method (Epicentre Technologies). Once it was determined that the insert sizes and cloning efficiency met the NHGRI quality standards, clones were thawed, plated, and robotically picked into 384-well microtiter dishes. Summary statistics for the resultant libraries are given in Table 2. The libraries have been designated VMRC-19 (N. coriiceps) and VMRC-21 (C. aceratus) and comprise 12X and 10X coverage of the respective genomes based on the total number of clones in the library, the average insert sizes, and the genome sizes determined for the taxa (Table 1).
Figure 3.

Analytical pulsed field gels for Chaenocephalus aceratus BAC library construction. (A) Samples from successive partial digest fractions (1–8) excised from a preparative pulsed field gel of bulk digested C. aceratus HMW DNA. Fractions 5 and 6 were eluted from the preparative gel and pooled for construction of the BAC library. (B) Analysis of C. aceratus BAC clones generated from fractions 5 and 6. Miniprep DNAs from 20 individual clones were digested with NotI (which excises the insert); the vector band is indicated by the arrow. Insert sizes in this batch of clones ranges from ~80 kb (clone 2) to ≥170 kb (clones 3 and 12). The doublet appearance of many of the bands is owing to a gel loading artifact. Molecular weight standards were run on the outer lanes of the gels; sizes are indicated in kb.
BAC End Sequencing—Quality Control
To determine the efficiency of insert cloning and to assess potential bacterial contamination of the two libraries, paired reads of BAC clones representing ~0.1% of each genome were generated. Sequence reads averaging 734 bp were obtained from 89% of the C. aceratus insert ends and comparable values were found for N. coriiceps (756 bp, 90%) (Table 3). Clones consisting only of vector sequences were rare (5.8%) and inserts of bacterial origin were not detected.
Table 3.
Summary statistics for BAC end sequence (BES) analyses.
| Datum | C. aceratus | N. coriiceps |
|---|---|---|
| Number of BAC clones | 1536 | 768 |
| Total BESs (forward and reverse) | 2733 | 1388 |
| Non-successful BESs | 339 | 148 |
| Total Mb of sequences surveyed | 2.0 | 1.0 |
| Genome size (pg) | 1.79 | 1.13 |
| Percent genome sequenced | 0.12 | 0.10 |
| Minimum sequence length (bp) | 63 | 35 |
| Average sequence length (bp) | 734 | 756 |
| Maximum sequence length (bp) | 985 | 961 |
| Percent GC content | 42 | 42 |
| Percent BAC ends with repetitive sequence | 68.2 | 62.3 |
| Percent transposable elements (TEs) | 13 | 12 |
| % SSR and satellites | 1.5 | 1.4 |
BAC End Sequencing—Genome Characteristics and Repetitive Element Analysis
Large-scale BAC end sequencing of C. aceratus and of N. coriiceps (Table 3) indicated that the GC contents of the two species are comparable (42%), in agreement with earlier estimates of notothenioid genomes (41–43%) obtained by analytical ultracentrifugation (Bucciarelli et al., 2002). Furthermore, their repetitive element landscapes [transposable elements (TEs), simple-sequence repeats (SSRs) and satellite DNAs] are similar (Table 3); 14.5% of the 2 Mb of C. aceratus sequence consisted of TEs, SSRs, and satellite DNA compared with the 13.4% found for 1Mb of N. coriiceps. sequence Greater than 60% of the BAC ends sampled from each library contained repetitive sequences (Table 3), with a somewhat higher proportion found in the icefish (68.2% for C. aceratus, 62.3% for N. coriiceps).
Figure 4 and Table 4 provide details of the repetitive elements of the two notothenioid genomes. When extrapolated to genome size, their repetitive element profiles were very similar (Fig. 4B). Examination of individual DNA transposons and LTR and non-LTR retrotransposons reinforced the similarity of the repetitive element landscapes of the two fishes, but some exceptions were found. For example, representation of the Mariner/Tc1 transposon, Gypsy and Copia LTR retrotransposons, and SINE elements differed between C. aceratus and N. coriiceps. We did not observe the LINE expansion (17 elements whose numbers increased 8- to >300-fold in more phylogenetically derived notothenioids) reported by Chen et al. (2008), most likely because our random sampling regime lacked the specificity of their EST-based approach.
Figure 4.

Repetitive element landscapes of the genomes of C. aceratus and of N. coriiceps. (A) Total genomic copy numbers of repetitive elements for C. aceratus and for N. coriiceps. (B) Repetitive element copy numbers normalized to genome size. Species: C. aceratus, white bars; N. coriiceps, red bars. Abbreviations: CR1, chicken repeat 1; DIRS1, Dictyostelium intermediate sequence repeat 1; ERV, endogenous retroviral sequence; hAT, hobo, Ac, and Tam3 family; L1, long interspersed element 1; LTR, long terminal repeat; SINE, short interspersed element; SSR, simple sequence repeat; TE, transposable element. Repetitive elements in the paired-end reads of the BAC inserts were evaluated by use of RepeatMasker v3.0 (Smit et al., 2004), CENSOR (Kohany et al., 2006), and the Repbase Update (Jurka et al., 2005). Error bars were calculated by the method of Shedlock et al. (2007).
Table 4.
Repetitive elements in BAC end sequences.
| Repetitive element classa | C. aceratus | N. coriiceps |
|---|---|---|
| Transposable elements | 1,390 | 618 |
| DNA transposons | 566 (40.9) | 253 (41.1) |
| Mariner/Tc1 | 27 (1.9) | 32 (5.2) |
| Kolobok | 32 (2.3) | 17 (2.8) |
| Harbinger | 30 (2.2) | 7 (1.1) |
| hAT | 211 (15.2) | 91 (15.0) |
| Other | 266 (19.1) | 106 (17.0) |
| LTR retrotransposons | 258 (18.3) | 80 (13.0) |
| Gypsy | 156 (11.0) | 49 (7.9) |
| Copia | 25 (1.8) | 1 (0.2) |
| DIRS | 46 (3.3) | 17 (2.8) |
| Other | 31 (2.2) | 13 (2.1) |
| Non-LTR retrotransposons | 468 (33.4) | 241 (38.6) |
| CR1 | 337 (24.0) | 157 (25.0) |
| L1 | 46 (3.3) | 31 (5.0) |
| SINE | 52 (3.7) | 37 (6.0) |
| Other | 33 (2.4) | 13 (2.6) |
| Endogenous retrovirus | 98 (7.0) | 44 (7.0) |
| SSRs and Satellites | 474 | 246 |
See legend to Figure 4 for abbreviations.
Hox Cluster Isolation
To confirm that the respective libraries contained authentic gene sequences at appropriate depth of coverage, we screened high density colony filters of each library using a cocktail of Hox probes. These probes were generated from C. aceratus and N. coriiceps genomic DNA using degenerate PCR (Kim et al., 2000). In total, we scored 125 hybridizing clones for C. aceratus and 81 for N. coriiceps. These clones were then assembled into contigs using an automated restriction fingerprinting procedure (Fjell et al., 2003; Schein et al., 2004), which tentatively identified at least 5 discrete Hox contigs in C. aceratus (average size ~21 clones) and 6 discrete contigs in N. coriiceps (average size ~10 clones). An example of this finger-printing procedure is given in Figure 5. All contigs generated by the automated fingerprinting procedure were, by sequence analysis, Hox gene-containing (data not shown). The reason for the discrepancy between the clone numbers in the C. aceratus vs. N. coriiceps Hox contigs is not known, but may be related to differences in probe labeling. Nonetheless, the depth of coverage (~10 and ~21 clones per Hox cluster for N. coriiceps and C. aceratus, respectively) is in line with the estimated coverage of these libraries (≥10X). In addition, the fact that >4 Hox clusters were found in these taxa clearly supports the existence of a whole genome duplication event at the base of the teleost lineage (Wittbrodt et al., ’98; Meyer and Schartl, ’99; Crow et al., 2006). Details of the Hox clusters of the respective species will be reported elsewhere.
Figure 5.

Restriction fingerprint and contig assembly of a Hox cluster from C. aceratus. The 16 clones in this contig were assembled from HindIII fingerprints of 125 putative Hox-containing clones that were selected on the basis of hybridization with a bulk Hox homeobox probe. (A) Fragments from 16 clones that comprised an assembled contig are depicted in a gel format output from the automated fingerprinting procedure; bars indicate fragments that were used for the assembly algorithm. (B) Tiling path of the 16 BAC clones of the assembled contig. DNA sequencing of Hox PCR amplicons verified that the contig comprised a Hox cluster (HoxDa).
Implications of the Data and Public Accessibility
Fishes of the suborder Notothenoidei present a unique opportunity to study the adaptive radiation of a marine species flock in an extremely cold environment, the Southern Ocean. To enable genome-level studies among these psychrophilic fishes, we determined genomic sizes for 11 notothenioid species and generated high-quality BAC libraries for two, N. coriiceps (VMRC-19) and C. aceratus (VMRC-21). The choice of species for library production was based primarily on their overt hematopoietic differences: N. coriiceps is a red-blooded species that forms all hematopoietic lineages, whereas C. aceratus is representative of the white-blooded icefishes that have lost their hemoglobin genes and capacity for erythropoiesis. However, the notothenioids possess many unusual anatomical and physiological adaptations, some of which mimic maladaptive human genetic diseases (Albertson et al., 2009). For example, many notothenioid species have evolved neutral (or near neutral) buoyancy in part through reduction of bone mineralization (De Vries and Eastman, ’78; Eastman and DeVries, ’81; Near et al., 2003, 2007), a condition that resembles human osteopenia (decreased bone mineral density) and can lead to osteoporosis. In this context, the skeleton of N. coriiceps is robustly ossified, whereas that of C. aceratus is poorly mineralized. Albertson et al. (2009) argued that identification of the genetic factors that underlie the evolved bone features of buoyant notothenioids is likely to improve our understanding of the mechanisms that regulate bone density in humans. Thus, the two notothenioid BAC libraries described herein will prove useful as resources to facilitate uncovering the genetic changes that adapt organisms to the psychrophilic mode of life and that cause some human genetic diseases.
The BAC libraries are ≥10X coverage in depth with median insert sizes >150 kb. The use of ever-improving next generation sequencing technology for obtaining high-quality contiguous sequence (Wicker et al., 2006; Dohm et al., 2007; Smith et al., 2008, 2009) should further increase the utility of these BAC resources. Our analysis of the repetitive element landscapes of N. coriiceps and of C. aceratus will contribute to a better understanding of the phylogenetic relationship of notothenioid fishes to other teleosts (cf. Shedlock et al., 2007). The BAC libraries for the two species have been archived at the BACPAC Resources Center in Children’s Hospital of Oakland Research Institute (http://bacpac.chori.org), which serves as a distribution center for high-density filters and individual clones.
Acknowledgments
We thank the personnel of the Office of Polar Programs of the National Science Foundation, of Raytheon Polar Services Company, and of the ARSV Laurence M. Gould, without whose support this work could not have been accomplished. Guillaume Lecointre (Muséum National d’Histoire Naturelle, Paris) and Andrew Shedlock (Museum of Comparative Zoology, Harvard University) provided valuable advice on the phylogeny of the notothenioids and on analysis of the repetitive sequence data, respectively. Deborah Tinnemore, Joshua Danke, Aru K. Arumuganathan, Michael Rego, and Jeramiah Smith provided technical assistance. BAC fingerprinting was performed by Jacquie Schein’s group at the Michael Smith Genome Sciences Centre, Vancouver, Canada. For inquiries regarding access to the BAC libraries please contact Pieter de Jong (pdejong@chori.org). Research funding was provided by the National Institutes of Health to C. T. A. (NIH-U01-HG02526) and by the National Science Foundation to C. T. A. (ANT-0632527) and to H. W. D. (OPP-0336932 and ANT-0635470).
LITERATURE CITED
- Albertson RC, Cresko W, Detrich HW, III, Postlethwait JH. Evolutionary mutant models for human disease. Trends Genet. 2009;25:74–81. doi: 10.1016/j.tig.2008.11.006. [DOI] [PMC free article] [PubMed] [Google Scholar]
- Amemiya CT, Ota T, Litman GW. Construction of P1 artificial chromosome (PAC) libraries from lower vertebrates. In: Lai E, Birren B, editors. Analysis of nonmammalian genomes. San Diego: Academic Press; 1996. pp. 223–256. [Google Scholar]
- Arumuganathan K, Searle ED. Estimation of nuclear DNA contents in plants by flow cytometry. Plant Mol Biol. 1991;9:229–241. [Google Scholar]
- Balushkin AV. Morphology, classification, and evolution of notothenioid fishes of the Southern Ocean (Notothenioidei, Perciformes) J Ichthyol. 2000;40:S74–S109. [Google Scholar]
- Bargelloni L, Marcato S, Patarnello T. Antarctic fish hemoglobins: evidence for adaptive evolution at subzero temperature. Proc Natl Acad Sci USA. 1998;95:8670–8675. doi: 10.1073/pnas.95.15.8670. [DOI] [PMC free article] [PubMed] [Google Scholar]
- Bucciarelli G, Bernardi G, Bernardi G. An ultracentrifugation analysis of two hundred fish genomes. Gene. 2002;295:153–162. doi: 10.1016/s0378-1119(02)00733-3. [DOI] [PubMed] [Google Scholar]
- Buckley BA, Place SP, Hofmann GE. Regulation of heat shock genes in isolated hepatocytes from an Antarctic fish, Trematomus bernacchii. J Exp Biol. 2004;207:3649–3656. doi: 10.1242/jeb.01219. [DOI] [PubMed] [Google Scholar]
- Chen L, DeVries AL, Cheng C-HC. Evolution of antifreeze glycoprotein gene from a trypsinogen gene in Antarctic noththenioid fish. Proc Natl Acad Sci USA. 1997;94:3811–3816. doi: 10.1073/pnas.94.8.3811. [DOI] [PMC free article] [PubMed] [Google Scholar]
- Chen Z, Cheng CH, Zhang J, Cao L, Chen L, Zhou L, Jin Y, Ye H, Deng C, Dai Z, Xu Q, Hu P, Sun S, Shen Y, Chen L. Transcriptomic and genomic evolution under constant cold in Antarctic notothenioid fish. Proc Natl Acad Sci USA. 2008;105:12944–12949. doi: 10.1073/pnas.0802432105. [DOI] [PMC free article] [PubMed] [Google Scholar]
- Cheng C-HC. Origin and mechanism of evolution of antifreeze glycoproteins in polar fishes. In: di Prisco G, Pisano E, Clarke A, editors. Fishes of Antarctica. A biological overview. Milano, Italy: Springer; 1998. pp. 311–328. [Google Scholar]
- Cheng C-HC, Chen L. Evolution of an antifreeze glycoprotein: a blood protein that keeps Antarctic fish from freezing arose from a digestive enzyme. Nature. 1999;401:443–444. doi: 10.1038/46721. [DOI] [PubMed] [Google Scholar]
- Cheng C-HC, Detrich HW., III Molecular ecophysiology of Antarctic notothenioid fishes. Phil T Roy Soc B. 2007;362:2215–2232. doi: 10.1098/rstb.2006.1946. [DOI] [PMC free article] [PubMed] [Google Scholar]
- Clarke A. Temperature and evolution: Southern Ocean cooling and the Antarctic marine fauna. In: Kerry KR, Hempel G, editors. Antarctic ecosystems: ecological change and conservation. Berlin: Springer; 1990. pp. 9–22. [Google Scholar]
- Cocca E, Ratnayake-Lecamwasam M, Parker SK, Camardella L, Ciaramella M, di Prisco G, Detrich HW., III Genomic remnants of α-globin genes in the hemoglobinless Antarctic icefishes. Proc Natl Acad Sci USA. 1995;92:1817–1821. doi: 10.1073/pnas.92.6.1817. [DOI] [PMC free article] [PubMed] [Google Scholar]
- Cocca E, Detrich HW, III, Parker SK, di Prisco G. A cluster of four globin genes from the Antarctic fish Notothenia coriiceps. J Fish Biol. 2000;57:33–50. [Google Scholar]
- Crow KD, Stadler PF, Lynch VJ, Amemiya C, Wagner GP. The “fish-specific” Hox cluster duplication is coincident with the origin of teleosts. Mol Biol Evol. 2006;23:121–136. doi: 10.1093/molbev/msj020. [DOI] [PubMed] [Google Scholar]
- Cui J, Ren X, Yu Q. Nuclear DNA content variation in fishes. Cytologia. 1991;56:425–429. [Google Scholar]
- Danke J, Miyake T, Powers T, Schein J, Shin H, Bosdet I, Erdmann M, Caldwell R, Amemiya CT. Genome resource for the Indonesian coelacanth, Latimeria menadoensis. J Exp Zool Part A. 2004;301:228–234. doi: 10.1002/jez.a.20024. [DOI] [PubMed] [Google Scholar]
- D’Avino R, di Prisco G. Antarctic fish hemoglobin: an outline of the molecular structure and oxygen binding properties—I. molecular structure. Comp Biochem Physiol B. 1988;90:579–584. [Google Scholar]
- DeConto RM, Pollard D. Rapid Cenozoic glaciation of Antarctica induced by declining atmospheric CO2. Nature. 2003;421:245–249. doi: 10.1038/nature01290. [DOI] [PubMed] [Google Scholar]
- Detrich HW., III . The unusual cardiovascular system of the hemoglobinless Antarctic icefishes. In: Aird WC, editor. Endothelial biomedicine. Cambridge: Cambridge University Press; 2007. pp. 74–78. [Google Scholar]
- Detrich HW, III, Johnson KA, Marchese-Ragona SP. Polymerization of Antarctic fish tubulins at low temperatures: energetic aspects. Biochemistry. 1989;28:10085–10093. doi: 10.1021/bi00452a031. [DOI] [PubMed] [Google Scholar]
- Detrich HW, III, Fitzgerald TJ, Dinsmore JH, Marchese-Ragona SP. Brain and egg tubulins from Antarctic fishes are functionally and structurally distinct. J Biol Chem. 1992;267:18766–18775. [PubMed] [Google Scholar]
- Detrich HW, III, Parker SK, Williams RC, Jr, Nogales E, Downing KH. Cold adaptation of microtubule assembly and dynamics: structural interpretation of primary sequence changes present in the α- and β-tubulins of Antarctic fishes. J Biol Chem. 2000;275:37038–37047. doi: 10.1074/jbc.M005699200. [DOI] [PubMed] [Google Scholar]
- Dettaï A, Lecointre G. In search of notothenioid (Teleostei) relatives. Antarct Sci. 2004;16:71–85. [Google Scholar]
- De Vries AL, Eastman JT. Lipid sacs as a buoyancy adaptation in an Antarctic fish. Nature. 1978;271:352–353. [Google Scholar]
- DeWitt HH. Coastal and deep-water benthic fishes of the Antarctic. In: Bushnell VC, editor. Antarctic map folio series, Folio 15. New York: American Geographical Society; 1971. pp. 1–10. [Google Scholar]
- di Prisco G. Molecular adaptations of Antarctic fish hemoglobins. In: di Prisco G, Pisano E, Clarke A, editors. Fishes of Antarctica. A biological overview. Milano; Springer: 1998. pp. 339–353. [Google Scholar]
- di Prisco G, Eastman JT, Giordano D, Parisi E, Verde C. Biogeography and adaptation of Notothenioid fish: hemoglobin function and globin-gene evolution. Gene. 2007;398:143–155. doi: 10.1016/j.gene.2007.02.047. [DOI] [PubMed] [Google Scholar]
- Dohm JC, Lottaz C, Borodina T, Himmelbauer H. SHARCGS, a fast and highly accurate short-read assembly algorithm for de novo genomic sequencing. Genome Res. 2007;17:1697–1706. doi: 10.1101/gr.6435207. [DOI] [PMC free article] [PubMed] [Google Scholar]
- Eastman JT. Antarctic fish biology: evolution in a unique environment. San Diego: Academic Press; 1993. [Google Scholar]
- Eastman JT. Phyletic divergence and specialization for pelagic life in the Antarctic notothenioid fish Pleuragramma antarcticum. Comp Biochem Physiol. 1997;118A:1095–1101. [Google Scholar]
- Eastman JT. Aspects of the biology of the icefish Dacodraco hunteri (Notothenioidei, Channichthyidae) in the Ross Sea, Antarctica. Polar Biol. 1999;21:194–196. [Google Scholar]
- Eastman JT. Antarctic notothenioid fishes as subjects for research in evolutionary biology. Antarct Sci. 2000;12:276–287. [Google Scholar]
- Eastman JT. The nature of the diversity of Antarctic fishes. Polar Biol. 2005;28:93–107. [Google Scholar]
- Eastman JT, Clarke A. A comparison of adaptive radiations of Antarctic fish with those of non-Antarctic fish. In: di Prisco G, Pisano E, Clarke A, editors. Fishes of Antarctic: a biological overview. Milano; Springer: 1998. pp. 3–26. [Google Scholar]
- Eastman JT, DeVries AL. Buoyancy adaptations in a swim-bladderless Antarctic fish. J Morphol. 1981;167:91–102. doi: 10.1002/jmor.1051670108. [DOI] [PubMed] [Google Scholar]
- Eastman JT, McCune AR. Fishes on the Antarctic continental shelf: evolution of a marine species flock? J Fish Biol. 2000;57A:84–102. [Google Scholar]
- Fjell CD, Bosdet I, Schein JE, Jones SJ, Marra MA. Internet Contig Explorer (iCE)—a tool for visualizing clone fingerprint maps. Genome Res. 2003;13:1244–1249. doi: 10.1101/gr.819303. [DOI] [PMC free article] [PubMed] [Google Scholar]
- Hardie DC, Hebert PD. The nucleotypic effects of cellular DNA content in cartilaginous and ray-finned fishes. Genome. 2003;46:683–706. doi: 10.1139/g03-040. [DOI] [PubMed] [Google Scholar]
- Hardie DC, Hebert PD. Genome-size evolution in fishes. Can J Fish Aquat Sci. 2004;61:1636–1646. [Google Scholar]
- Hinegardner R. Evolution of cellular DNA content in teleost fishes. Am Nat. 1968;102:517–523. [Google Scholar]
- Hinegardner R, Rosen DE. Cellular DNA content and the evolution of teleostean fishes. Am Nat. 1972;106:621–644. [Google Scholar]
- Hofmann GE, Buckley BA, Airaksinen S, Keen JE, Somero GN. Heat-shock protein expression is absent in the Antarctic fish Trematomus bernacchii (family Nototheniidae) J Exp Biol. 2000;203:2331–2339. doi: 10.1242/jeb.203.15.2331. [DOI] [PubMed] [Google Scholar]
- Hureau JC, Petit D, Fine JM, Marneux M. New cytological, biochemical, and physiological data on the colorless blood of the Channichthyidae (Pisces, Teleosteans, Peciformes) In: Llano GA, editor. Adaptations within Antarctic ecosystems. Washington, DC: Smithsonian Institution; 1977. pp. 459–477. [Google Scholar]
- Jurka J, Kapitonov VV, Pavlicek A, Klonowski P, Kohany O, Walichiewicz J. Repbase Update, a database of eukaryotic repetitive elements. Cytogenet Genome Res. 2005;110:462–467. doi: 10.1159/000084979. [DOI] [PubMed] [Google Scholar]
- Kennett JP. Cenozoic evolution of Antarctic glaciation, the circum-Antarctic ocean, and their impact on global paleoceanography. J Geophys Res. 1977;82:3843–3860. [Google Scholar]
- Kim CB, Amemiya C, Bailey W. Hox cluster genomics in the horn shark, Heterodontus francisci. Proc Natl Acad Sci USA. 2000;97:1655–1660. doi: 10.1073/pnas.030539697. [DOI] [PMC free article] [PubMed] [Google Scholar]
- Kiss AJ, Mirarefi AY, Ramakrishnan S, Zukoski CF, DeVries AL, Cheng CH. Cold-stable eye lens crystallins of the Antarctic nototheniid toothfish Dissostichus mawsoni Norman. J Exp Biol. 2004;207:4633–4649. doi: 10.1242/jeb.01312. [DOI] [PubMed] [Google Scholar]
- Kohany O, Gentles AJ, Hankus L, Jurka J. Annotation, submission and screening of repetitive elements in Repbase: Repbase Submitter and Censor. BMC Bioinformatics. 2006;7:474. doi: 10.1186/1471-2105-7-474. [DOI] [PMC free article] [PubMed] [Google Scholar]
- Kunzmann A, Caruso C, di Prisco G. Haematological studies on a high-Antarctic fish: Bathydraco marri Norman. J Exp Mar Biol Ecol. 1991;152:243–255. [Google Scholar]
- Lecointre G, Bonillo C, Ozouf-Costaz C, Hureau J-C. Molecular evidence for the origins of Antarctic fishes: paraphyly of the Bovichtidae and no indication for the monophyly of the Notothenioidei (Teleostei) Polar Biol. 1997;18:193–208. [Google Scholar]
- Livermore R, Nankivell A, Eagles G, Morris P. Paleogene opening of the Drake Passage. Earth Planet Sci Lett. 2005;236:459–470. [Google Scholar]
- Logue JA, De Vries AL, Fodor E, Cossins AR. Lipid compositional correlates of temperature-adaptive interspecific differences in membrane physical structure. J Exp Biol. 2000;203:2105–2115. doi: 10.1242/jeb.203.14.2105. [DOI] [PubMed] [Google Scholar]
- Meyer A, Schartl M. Gene and genome duplications in vertebrates: the one-to-four (-to-eight in fish) rule and the evolution of novel gene functions. Curr Opin Cell Biol. 1999;11:699–704. doi: 10.1016/s0955-0674(99)00039-3. [DOI] [PubMed] [Google Scholar]
- Mirsky AE, Ris H. The deoxyribonucleic acid content of animal cells and its evolutionary significance. J Gen Physiol. 1951;34:451–462. doi: 10.1085/jgp.34.4.451. [DOI] [PMC free article] [PubMed] [Google Scholar]
- Montgomery J, Clements K. Disaptation and recovery in the evolution of Antarctic fishes. Trends Ecol Evol. 2000;15:267–271. doi: 10.1016/s0169-5347(00)01896-6. [DOI] [PubMed] [Google Scholar]
- Morescalchi A, Hureau JC, Olmo E, Ozouf-Costaz C, Pisano E, Stanyon R. A multiple sex-chromosome system in Antarctic ice-fishes. Polar Biol. 1992;11:655–661. [Google Scholar]
- Morescalchi A, Morescalchi MA, Odierna G, Stingo V, Capriglione T. Karyotype and genome size of zoarcids and notothenioids (Teleostei, Perciformes) from the Ross Sea: cytotaxonomic implications. Polar Biol. 1996;16:559–564. [Google Scholar]
- Near TJ, Cheng CH. Phylogenetics of notothenioid fishes (Teleostei: Acanthomorpha): inferences from mitochondrial and nuclear gene sequences. Mol Phylogenet Evol. 2008;47:832–840. doi: 10.1016/j.ympev.2007.11.027. [DOI] [PubMed] [Google Scholar]
- Near TJ, Russo SE, Jones CD, DeVries AL. Ontogenetic shift in buoyancy and habitat in the Antarctic toothfish, Dissostichus mawsoni (Perciformes: Nototheniidae) Polar Biol. 2003;26:124–128. [Google Scholar]
- Near TJ, Pesavento JJ, Cheng CH. Phylogenetic investigations of Antarctic notothenioid fishes (Perciformes: Notothenioidei) using complete gene sequences of the mitochondrial encoded 16S rRNA. Mol Phylogenet Evol. 2004;32:881–891. doi: 10.1016/j.ympev.2004.01.002. [DOI] [PubMed] [Google Scholar]
- Near TJ, Parker SK, Detrich HW., III A genomic fossil reveals key steps in hemoglobin loss by the antarctic icefishes. Mol Biol Evol. 2006;23:2008–2016. doi: 10.1093/molbev/msl071. [DOI] [PubMed] [Google Scholar]
- Near TJ, Kendrick BJ, Detrich HW, III, Jones CD. Confirmation of neutral buoyancy in Aethotaxis mitopteryx DeWitt (Notothenioidei: Nototheniidae) Polar Biol. 2007;30:443–447. [Google Scholar]
- O’Brien KM, Sidell BD. The interplay among cardiac ultrastructure, metabolism and the expression of oxygen-binding proteins in Antarctic fishes. J Exp Biol. 2000;203:1287–1297. doi: 10.1242/jeb.203.8.1287. [DOI] [PubMed] [Google Scholar]
- Osoegawa K, Woon PY, Zhao B, Frengen E, Tateno M, Catanese JJ, de Jong PJ. An improved approach for construction of bacterial artificial chromosome libraries. Genomics. 1998;52:1–8. doi: 10.1006/geno.1998.5423. [DOI] [PubMed] [Google Scholar]
- Paluh JL, Killilea AN, Detrich HW, III, Downing KH. Meiosis-specific failure of cell cycle progression in fission yeast by mutation of a conserved β-tubulin residue. Mol Biol Cell. 2004;15:1160–1171. doi: 10.1091/mbc.E03-06-0389. [DOI] [PMC free article] [PubMed] [Google Scholar]
- Parker SK, Detrich HW., III Evolution, organization, and expression of α-tubulin genes in the Antarctic fish Notothenia coriiceps: a tandem gene cluster generated by recent gene duplication, inversion, and divergence. J Biol Chem. 1998;273:34358–34369. doi: 10.1074/jbc.273.51.34358. [DOI] [PubMed] [Google Scholar]
- Place SP, Hofmann GE. Constitutive expression of a stress-inducible heat shock protein gene, hsp70, in phylogenetically distant Antarctic fish. Polar Biol. 2005;28:261–267. [Google Scholar]
- Place SP, Zippay ML, Hofmann GE. Constitutive roles for inducible genes: evidence for the alteration in expression of the inducible hsp70 gene in Antarctic notothenioid fishes. Am J Physiol -Reg Integr Comp Physiol. 2004;287:R429–R436. doi: 10.1152/ajpregu.00223.2004. [DOI] [PubMed] [Google Scholar]
- Römisch K, Collie N, Soto N, Logue J, Lindsay M, Scheper W, Cheng C-HC. Protein translocation across the endoplasmic reticulum membrane in cold-adapted organisms. J Cell Sci. 2003;116:2875–2883. doi: 10.1242/jcs.00597. [DOI] [PubMed] [Google Scholar]
- Ruud JT. Vertebrates without erythrocytes and blood pigment. Nature. 1954;173:848–850. doi: 10.1038/173848a0. [DOI] [PubMed] [Google Scholar]
- Schein JE, Kucaba TA, Sekhon M, Smailus D, Waterston RH, Marra MA. High-throughput BAC fingerprinting. In: Zhao S, Stodolsky M, editors. Bacterial artificial chromosomes, volume 1: library construction, physical mapping, and sequencing. Totowa, NY: Humana Press, Inc; 2004. pp. 143–156. [DOI] [PubMed] [Google Scholar]
- Scher HD, Martin EE. Timing and climatic consequences of the opening of Drake Passage. Science. 2006;312:428–430. doi: 10.1126/science.1120044. [DOI] [PubMed] [Google Scholar]
- Shedlock AM, Botka CW, Zhao S, Shetty J, Zhang T, Liu JS, Deschavanne PJ, Edwards SV. Phylogenomics of nonavian reptiles and the structure of the ancestral amniote genome. Proc Natl Acad Sci USA. 2007;104:2767–2772. doi: 10.1073/pnas.0606204104. [DOI] [PMC free article] [PubMed] [Google Scholar]
- Sidell BD, O’Brien KM. When bad things happen to good fish: the loss of hemoglobin and myoglobin expression in Antarctic icefishes. J Exp Biol. 2006;209:1791–1802. doi: 10.1242/jeb.02091. [DOI] [PubMed] [Google Scholar]
- Sidell BD, Vayda ME, Small DJ, Moylan TJ, Londraville RL, Yuan ML, Rodnick KJ, Eppley ZA, Costello L. Variable expression of myoglobin among the hemoglobinless Antarctic icefishes. Proc Natl Acad Sci USA. 1997;94:3420–3424. doi: 10.1073/pnas.94.7.3420. [DOI] [PMC free article] [PubMed] [Google Scholar]
- Smit AFA, Hubley R, Green P. RepeatMasker Open-3.0. 2004. [Google Scholar]
- Smith AD, Xuan Z, Zhang MQ. Using quality scores and longer reads improves accuracy of Solexa read mapping. BMC Bioinformatics. 2008;9:128. doi: 10.1186/1471-2105-9-128. [DOI] [PMC free article] [PubMed] [Google Scholar]
- Smith JJ, Putta S, Zhu W. Genic regions of a large salamander genome contain long introns and novel genes. BMC Genomics. 2009;10:19. doi: 10.1186/1471-2164-10-19. [DOI] [PMC free article] [PubMed] [Google Scholar]
- Somero GN, DeVries AL. Temperature tolerance of some Antarctic fishes. Science. 1967;156:257–258. doi: 10.1126/science.156.3772.257. [DOI] [PubMed] [Google Scholar]
- Strong SJ, Ohta Y, Litman GW, Amemiya CT. Marked improvement of PAC and BAC cloning is achieved using electroelution of pulsed-field gel-separated partial digests of genomic DNA. Nucleic Acids Res. 1997;25:3959–3961. doi: 10.1093/nar/25.19.3959. [DOI] [PMC free article] [PubMed] [Google Scholar]
- Todgham AE, Hoaglund EA, Hofmann GE. Is cold the new hot? Elevated ubiquitin-conjugated protein levels in tissues of Antarctic fish as evidence for cold-denaturation of proteins in vivo. J Comp Physiol B. 2007;177:857–866. doi: 10.1007/s00360-007-0183-2. [DOI] [PubMed] [Google Scholar]
- Vialli M. Volume et contenu en ADN par noyau. Exp Cell Res. 1957;4:284–293. [PubMed] [Google Scholar]
- Vinograd AE. Genome size and GC-percent in vertebrates as determined by flow cytometry: the triangular relationship. Cytometry. 1998;31:100–109. doi: 10.1002/(sici)1097-0320(19980201)31:2<100::aid-cyto5>3.0.co;2-q. [DOI] [PubMed] [Google Scholar]
- Wicker T, Schlagenhauf E, Graner A, Close TJ, Keller B, Stein N. 454 sequencing put to the test using the complex genome of barley. BMC Genomics. 2006;7:275. doi: 10.1186/1471-2164-7-275. [DOI] [PMC free article] [PubMed] [Google Scholar]
- Williams RC, Jr, Correia JJ, DeVries AL. Formation of microtubules at low temperature by tubulin from Antarctic fish. Biochemistry. 1985;24:2790–2798. doi: 10.1021/bi00332a029. [DOI] [PubMed] [Google Scholar]
- Wittbrodt J, Meyer A, Schartl M. More genes in fish? BioEssays. 1998;20:511–515. [Google Scholar]
- Xing J, Wang H, Belancio VP, Cordaux R, Deininger PL, Batzer MA. Emergence of primate genes by retrotransposon-mediated sequence transduction. Proc Natl Acad Sci USA. 2006;103:17608–17613. doi: 10.1073/pnas.0603224103. [DOI] [PMC free article] [PubMed] [Google Scholar]
- Zachos J, Pagani M, Sloan L, Thomas E, Billups K. Trends, rhythms, and aberrations in global climate 65 Ma to present. Science. 2001;292:686–693. doi: 10.1126/science.1059412. [DOI] [PubMed] [Google Scholar]
- Zhao Y, Ratnayake-Lecamwasam M, Parker SK, Cocca E, Camardella L, di Prisco G, Detrich HW., III The major adult α-globin gene of Antarctic teleosts and its remnants in the hemoglobinless icefishes: calibration of the mutational clock for nuclear genes. J Biol Chem. 1998;273:14745–14752. doi: 10.1074/jbc.273.24.14745. [DOI] [PubMed] [Google Scholar]