

Abstract
To help define the pathologies associated with yeast cells as they age, we analyzed the transcriptome of young and old cells isolated by elutriation, which allows isolation of biochemical quantities of old cells much further advanced in their life span than old cells prepared by the biotin-streptavidin method. Both 18-generation-old wild-type yeast and 8-generation-old cells from a prematurely aging mutant (dna2-1), with a defect in DNA replication, were evaluated. Genes involved in gluconeogenesis, the glyoxylate cycle, lipid metabolism, and glycogen production are induced in old cells, signifying a shift toward energy storage. We observed a much more extensive generalized stress response known as the environmental stress response (ESR), than observed previously in biotin-streptavidin-isolated cells, perhaps because the elutriated cells were further advanced in their life span. In addition, there was induction of DNA repair genes that fall in the so-called DNA damage “signature” set. In the dna2-1 mutant, energy production genes were also induced. The response in the dna2-1 strain is similar to the telomerase delete response, genes whose expression changes during cellular senescence in telomerase-deficient cells. We propose that these results suggest, albeit indirectly, that old cells are responding to genome instability.
INTRODUCTION
Much aging research is aimed at identifying the processes that lead to the generation of age-related cellular damage and understanding exactly how and where this damage occurs. Recently, there has been renewed focus on model organisms, such as the budding yeast Saccharomyces cerevisiae, for experimental work on aging. Yeast provides a model for contributions to aging made by tissues and organs that consist of constantly proliferating cells, replicative aging. Yeast has many advantages for replicative aging studies, such as its short life span, completely sequenced genome, and well-characterized biology. Individual yeast cells are mortal, and their life span is measured by the number of times they divide, i.e., the number of daughter cells produced by a single mother (Mortimer and Johnston, 1959; Muller et al., 1980). These daughter cells have the potential for a full life span, whereas the mother cell increases in age with each cell division; thus, yeast aging is asymmetric. The probability that an individual yeast cell will produce daughters declines exponentially as a function of its age in cell divisions or generations (Jazwinski et al., 1998). As yeast cells age, their size increases (Mortimer and Johnston, 1959; Nestelbacher, 2000), their cell cycle slows down (Mortimer and Johnston, 1959), their shape is altered (Pichova et al., 1997), their nucleolus tends to be larger and/or more fragmented, and they become sterile (Guarente, 1997). In wild-type cells, extrachromosomal ribosomal DNA circles (ERCs) also accumulate (Sinclair and Guarente, 1997). Cells in the second half of their life span also show a switch to a state inducing increase loss of heterozygosity (LOH) (McMurray and Gottschling, 2003). Although several lines of evidence suggest that accumulation of ERCs is one determinant of life span, aging can occur in their absence (Guarente, 1997; Sinclair, 2002; Mays Hoopes et al., 2002). What causes the asymmetric inheritance of these aging phenotypes and what causes the final arrest of the mother cell is therefore not completely understood.
The median replicative life span of most S. cerevisiae wild-type cells is ∼25 generations; the maximum is ∼40 generations (Jazwinski, 1993). It has recently been shown that several DNA replication mutants show drastically reduced replicative life span (Mays Hoopes et al., 2002). This led to the suggestion that replication mutants represent an exaggerated case of spontaneous replication errors that occur in wild-type cells in every generation and that cessation of cell division in both mutant and wild-type is the consequence, in part, of chromosome damage occurring during DNA replication. Such a model would be consistent with the accumulation of ERCs in old cells (Guarente and Kenyon, 2000; Sinclair, 2002) and with increased frequency of LOH (McMurray and Gottschling, 2003). One of these DNA replication mutants is dna2-1 (Kuo et al., 1983). Its median life span is eight generations, and maximum ∼15 generations, and this mutant ages in the absence of ERCs (Mays Hoopes et al., 2002). The DNA2 gene in yeast is essential for growth, and Dna2p possesses a helicase and an endonuclease activity (Budd et al., 1995). The dna2-1 mutant is inviable at 37°C; full 2C DNA content is synthesized but the newly synthesized DNA is highly fragmented, indicating that DNA replication is defective (Budd and Campbell, 1995). This defect can be suppressed by overexpression of RAD27. RAD27, the homolog of the mammalian FEN-1, is a structure-specific nuclease implicated in Okazaki fragment maturation during DNA replication. These genetic interactions suggested that at least one specific role for Dna2p is also in the maturation of the 5′ ends of Okazaki fragments (Budd and Campbell, 1997), and in vitro reconstitution studies indicate that Dna2 is required for efficient RNA removal and ligation when FEN-1 activity is impaired (Bae and Seo, 2000; Ayyagari et al., 2003; Kao, Campbell, and Bambara, unpublished data). With respect to aging, it is interesting that the human BLM gene, encoding a RecQ helicase defective in Bloom syndrome, can suppress the replication defect of dna2 mutants (Imamura and Campbell, 2003). dna2 mutants show hyperrecombination in the rDNA repeats, which correlates with increased replication fork pausing at the rDNA replication fork barrier and increased double-strand breaks at the replication fork barrier (RFB). Deletion of FOB1, the fork barrier protein, eliminates pausing, reduces the double-strand breaks (DSBs), and also the hyperrecombination (Weitao et al., 2003b). SGS1, DNA2, SRS2, RRM3, and FOB1 interact to maintain rDNA stability as measured by two-dimensional gel analysis of replication fork pausing in the rDNA and synthetic lethality studies (Weitao et al., 2003a,b).
DNA2 is involved in DSB and postreplication repair pathways, as well as in DNA replication (Budd and Campbell, 2000). Indeed, dna2 mutants are sensitive to X-rays, methyl methanesulfonate (MMS), and bleomycin (Choe et al., 2002). The X-ray sensitivity of the dna2-1 strain, like its replication defect, is suppressed by overexpression of Rad27p (Budd and Campbell, 2000).
Yet another aspect of Dna2p function is the fact that the protein is localized to telomeres, unlike other replication proteins (Choe et al., 2002). This localization is regulated in a cell cycle- and DNA damage-dependent manner. Only during S phase or after treatment of cells with DNA-damaging agents is Dna2p released from telomeres and found associated with the rest of the nuclear chromatin (Choe et al., 2002). Overexpression of DNA2 leads to derepression of marker genes inserted at telomeres and a transient increase in single-stranded telomeric G-tails, Dna2 is required both for telomerase-dependent and telomerase-independent telomere biogenesis, and dna2-2 est2Δ is synthetically lethal (Singer et al., 1998; Parenteau and Wellinger, 1999; Choe et al., 2002).
Our current study was designed to further define the causes of aging in wild-type yeast and of the premature aging of the dna2-1 strain. Our strategy was to determine the genome-wide transcriptional response to progression through the life span by using microarray analysis. To obtain sufficient quantities of sufficiently old cells for reproducible production of RNA and cDNAs for microarray hybridizations, we developed a method for isolating old cells based on size selection, similar to two methods described previously (Egilmez et al., 1990; Laun et al., 2001). The numerous previously published analyses of yeast gene expression patterns under varying conditions were important in interpreting our data.
MATERIALS AND METHODS
Yeast Strains and Media
A wild-type yeast strain (4741) and an isogenic DNA replication mutant (4741dna2-1) (Kuo and Campbell, 1983) were used for all experiments. Liquid YPD media (2% glucose, 1% yeast extract, 2% peptone) was used for growing yeast cells at 24°C, the permissive growth temperature for the dna2-1 strain.
Isolation of Young and Old Cells by Elutriation
For the isolation of young and old cells, the WT4741 strain and the isogenic strain containing the dna2-1 mutation, 4741dna2-1, were diluted appropriately and grown at 24°C in two liters YPD containing 35 μg/ml chloramphenicol. Wild-type cells, WT4741, were first grown for ∼10 generations (A600 = 10). Then 3 × 10⁸ 10-generation-old cells were isolated by elutriation and then inoculated into two liters fresh YPD medium and grown again for ∼8 generations (A600 = 1.5). Both young (1 to 3 generations) and old cells (16-18 generations) were isolated by a second elutriation, yielding 2 × 10⁹ young cells and 4.8 × 10⁸ old cells. Cells were quick frozen in liquid nitrogen and stored at -80°C. Note that RNA extractions were not performed on the 1- to 3-generation-old and 10-generation-old wild-type cells harvested at A600 = 10. The latter culture of wild-type cells was grown to such a high density to avoid doing three elutriations for each culture, thus minimizing the preparation time. The young wild-type cells and the 18-generation-old wild-type cells used for RNA extraction were harvested well below the diauxie limit based on the density of the culture at the time of collection (<3.2) (DeRisi et al., 1997).
For isolation of young and old dna2-1 mutant cells, 5 × 10⁸ 4741dna2-1 cells growing exponentially were inoculated into two liters of YPD containing 35 μg/ml chloramphenicol and grown for ∼8 generations at 24°C (A600 = 1.5-2). Young and old 4741dna2-1 cells were separated by elutriation. We collected 1.2 × 10⁹ 1- to 3-generation-old cells, and the yield of 8-generation-old cells was 3.6 × 10⁸. Again, care was taken to harvest well before the diauxic shift. Samples of elutriated young and old cells were quick frozen in liquid nitrogen and stored at -80°C.
A complete description of the elutriation technique can be found in (Diamond, 1991). Briefly, pellets of cells harvested from the exponentially growing cultures were washed in phosphate-buffered saline (PBS; 136.89 mM NaCl, 2.68 mM KCl, 5.37 mM Na2HPO4, 1.76 mM KH2PO4, pH 7.4), and the cells resuspended in 20 ml of PBS and bovine serum albumin (2 mg/ml). Cell clumps were separated by sonic irradiation (30 s), and the cell suspension was filtered with mesh (3-64/32 NITEX; Tetko, Briarcliff Manor, N.Y.). The elutriation chamber was then loaded with 20 ml of cell suspension corresponding to ∼3 × 10¹¹ cells (2 liters of culture, A600 = 10, first elutriation) for WT4741 and ∼7 × 10¹⁰ cells for 4741 dna2-1 (2 liters of culture, A600 = 2). The young wild-type and dna2-1 cells were isolated by fixing the flow rate of the water injected into the centrifuge at 45 ml/min and the speed of the rotor of the centrifuge at 1400 rpm. The old wild-type and dna2-1 cells were elutriated by fixing the flow rate at 85 ml/min and the speed of the rotor, respectively, at 900 rpm and 1550 rpm (J-6M centrifuge with JE-10 × rotor; Beckman Coulter, Fullerton, CA). The preparation of the cells before loading into the elutriator took ∼1 h. Once loaded, the young cells were isolated within 30 min at 24°C and then placed at 4°C. It took ∼3 h to isolate the fractions of old cells. As for the young cells, we performed the elutriation of the old cells at 24°C, and the cells were then placed at 4°C. Flow cytometric analysis revealed that the cell cycle distribution was the same for elutriated and nonelutriated cells.
Calcofluor Staining
We stained the elutriated young and old cells with fluorescent brightener (Calcofluor White M2R Tinopal UNPA-GX #F3543) to count the bud scars and establish the age of the cells isolated by elutriation. About 106 cells were washed once in 150 μl of 1 M sorbitol and resuspended in 150 μl of fluorescent brightener (10 mg/ml) for 5 min at 4°C. After being washed four times with fresh 1 M sorbitol, the cells were resuspended in 20 μl of 1 M sorbitol and then observed under a fluorescence axioscope (Carl Zeiss, Jena, Germany).
Indirect Immunofluorescence
Nucleoli were monitored by indirect immunofluorescence by using monoclonal antibodies directed against the abundant nucleolar protein Nop1 (Aris and Blobel, 1988; Mays Hoopes et al., 2002). After 1-h incubation with potassium phosphate buffer (KPO4), magnesium chloride (MgCl2), and 37% formaldehyde, cells were placed in 2 M sorbitol buffer and treated with Zymolyase (0.3 mg/ml Zymolyase 20T, 0.1% β-mercaptoethanol) at 30°C for 45 min for the WT4741 strain and 15 min for the 4741dna2-1 strain. The cells were then fixed on eight-well, Teflon-coated slides pretreated with 0.1% polylysine 6040805; ICN Biomedicals, Costa Mesa, CA). After 15 min in blocking solution (PBS, 0.5% bovine serum albumin, 0.5% chicken albumin, 0.5% Tween 20), the cells were incubated with the primary antibodies diluted at 1:2000 in the block solution for 2 h at room temperature. The cells were then washed four times in blocking buffer and incubated for 2 h with the secondary antibody, rabbit anti-mouse diluted at 1:5000 in blocking solution. After incubation, the cells were washed four times in blocking solution and immediately costained with 4′,6′-diamidino-2-phenylindole (DAPI). DAPI was used at 50 ng/ml as described previously (Mays Hoopes et al., 2002). Cells were then observed under a fluorescence axioscope (Carl Zeiss) coupled with a Orca 2 camera (Hamamatsu, Bridgewater, NJ).
Flow Cytometry
For flow cytometry analysis, samples were fixed in 70% ethanol. After an overnight digestion with RNase I (8 mg/ml in PBS) at 37°C and a 4-h digestion with proteinase K (1 mg/ml) at 50°C, cells were resuspended in propidium iodide in PBS (50 μg/ml), sonicated (output 3-20% duty cycle, 15 s) and filtered with mesh (3-64/32 NITEX; Tetko). The control strain (WT4741) was grown asynchronously at 24°C (with ∼52% of control strain cells having 1C and 48% having 2C content) and until saturation to identify the 1C peak (100% having 1C content).
DNA Microarray Experiments and Analysis
Old and young wild-type cells were isolated as described under “Isolation of Young and Old Cells by Elutriation.” The elutriated cells from six such experiments (a total of 12 liters), yielding 4.8 × 10⁸ cells each, were pooled. Samples of these cells were used for multiple RNA extractions (see below). Old and young dna2-1 cells were isolated as described under “Isolation of Young and Old Cells by Elutriation.” The elutriated cells from eight such experiments (a total of 16 liters), yielding 3.6 × 10⁸ cells each, were pooled. Samples of these cells were used for multiple RNA extractions (see below).
RNA extractions were performed with hot/phenol chloroform followed by an Rneasy column (74104; QIAGEN, Valencia, CA). cDNA was synthesized by using oligo(dT) primer (18418-012; Invitrogen, Carlsbad, CA) and Powerscript reverse transcriptase (8460-1; BD Biosciences Clontech, Palo Alto, CA) by using 60 μg of total RNA for each reaction. The cDNA was labeled during reverse transcription with either Cy5-labeled dCTP (red, PA55021; Amersham Biosciences, Piscataway, NJ), or Cy3-labeled dCTP (green, PA53021; Amersham, Biosciences), according to the directions of the supplier (BD Biosciences Clontech). Independent RNA preparations were used for each cDNA preparation.
RNA levels in young and old cells were determined in duplicate for each strain by a ratiometric method by using microarray hybridization analysis. We performed two control experiments (one for wild-type and one for dna2-1), which consisted of a determination of RNA levels in young cells of the same strain, alternatively labeled with Cy3 and Cy5. We also performed four hybridization experiments that consisted of a comparison between RNA levels in young cells and old cells of the same strain. For each strain, wild-type and dna2-1, two hybridization experiments were performed. In the first experiment, Cy3 was used to prepare the cDNA from young cells and Cy5 for old cells. In the second experiment, the dyes were switched to remove any bias that may have been introduced by gene-specific differences in incorporation of the two dyes. For instance, equal amounts of the Cy3 and Cy5-labeled dyes, attached to their respective cDNAs, were used for each array (at least 20 pmol). In addition, as just mentioned, independent RNA isolations were used for each cDNA preparation to control for possible differences due to extraction procedures. Hybridizations were performed on DNA microarrays from Corning Microarrays Technology (Fountain Valley, CA). The CMT Yeast-S228c Gene Array version 1.31 contains >6160 polymerase chain reaction (PCR) products (∼1 kb) representing open reading frames (ORFs) from the fully sequenced S. cerevisiae genome, plus 108 control genes from Bacillus subtilis. For hybridization, the microarrays were incubated in 50 μl of hybridization solution (1% sonicated salmon sperm, 24.75% formamide, 4.95× SSC, 0.099% SDS, and 0.99 mM dithiothreitol) for 10-18 h at 42°C. After washing (1 min in 2× SSC, 0.1% SDS at 42°C; 5 min in a new solution of 2× SSC, 0.1% SDS at 42°C; 10 min in 0.1× SSC, 0.1% SDS; 15 s, 2 min, 2 min, and 1 min in 0.1× SSC; 15 s in 0.01× SSC), separate images were acquired for each dye, and fluorescence intensity ratios were obtained for all genes (Genepix-Pro3.0 Axon scanner 4000A).
We performed the analysis using MArray, a software that allows the user to analyze single or paired microarray data sets (Wang et al., 2002). MArray defines the quality of microarray experiments and assesses the reproducibility of replicate experiments. The analysis consisted of three steps: filtering, normalization, and interpretation. During the filtering, all empty or negatively flagged spots (the flag coefficient is given by the Genepix file) were removed (see supplementary data http://woldlab.caltech.edu/~lesur/old_and_young_cells/MArray_output.pdf). We eliminated the genes that did not show a consistent expression profile in the duplicates (for example, genes that were more highly expressed in the young wild-type cells in the first experiment but were then more highly expressed in the old wild-type cells in the repeated experiment). After all filtering, 5733 wild-type genes and 6141 dna2-1 genes were left. The minimum signal intensity of each spot was set to zero. We used two control experiments to quantify the noise due to the technique by itself, especially dye bias, and to set the thresholds for identifying the genes significantly differentially expressed in old or young cells in each strain. This sets the intensity limits for interpreting the experimental arrays. We then normalized the intensity young/old cells by using intensity-dependent normalization of the ratios as described by Yang et al. (2002). The data are presented as the background subtracted, normalized young/old ratios for each array. For each strain, reported expression ratios are the average of the two expression ratios young cells/old cells after normalization of the two hybridizations in which the Cy3 and the Cy5 fluorescent dyes were reversed (see tables in supplementary data). To demonstrate the reproducibility of the hybridizations, we calculated the correlation coefficients for each set of reversed experiments.
The entire experiment was also performed again comparing young cells isolated without elutriation with old cells isolated by elutriation. The genes activated fell in the same pathways identified in the data reported. The results are not included because the young cells were not isolated by elutriation as they were in the data set presented here, making averaging of the data impossible. However, it is noteworthy that the results overlap significantly and lead to identical interpretations.
The Yeast Proteome Database (http://www.incyte.com/proteome/mainmenu.jps), the Saccharomyces Genome Database (http://genome-www.stanford.edu/Saccharomyces), and the annotations of the MIPS Comprehensive Yeast Genome Database (http://mips.gsf.de/proj/yeast/CYGD/db/index.html) were used for interpretation of the expression profiles. In addition, comparison of our results with databases generated recently describing transcriptional responses in yeast to various environmental stresses, conditions that extend life span, and to various mutations that lead to chromosome damage or repair was valuable (Jelinsky and Samson, 1999; Gasch et al., 2000, 2001; Jelinsky et al., 2000; Rep et al., 2000; Kaeberlein et al., 2002; Lin et al., 2001; Lin et al., 2002).
Real-Time Quantitative Reverse Transcription RT-PCR
Confirmation of differentially expressed transcripts was performed using the iCycler IQ real time PCR detection system (Bio-Rad, Hercules, CA) on cDNA obtained from old and young cells isolated with the elutriation system. Total RNA was obtained from each sample and treated with deoxyribonuclease (catalog no. 1906; Ambion, Austin, TX) to remove DNA contamination. cDNA was synthesized using 5 μg of RNA and the iScript cDNA synthesis kit from Bio-Rad (catalog no. 170-8891).
Four microliters of a serial 10-fold dilution (10, 100, 1,000, and 10,000) of cDNA obtained by reverse transcription was amplified in a 25-μl reaction mix containing 1× SYBR Green Supermix (catalog no. 170-8880; Bio-Rad) and 25 pM of each primer. Each sample was run in triplicate. After a 3-min Taq activation step at 95°C, reactions were subjected to 50 cycles of 10-s denaturation at 95°C and 10-s extension at 54°C. Primers were purchased from IDT Integrated Technologies (Coraville, IA). Primer pairs were chosen to minimize primer dimerization and to generate an amplicon between 100 and 150 base pairs. Optical data were collected during the annealing step of each cycle. After PCR, reaction products were melted for 1 min at 95°C and then the temperature was set to 54°C and increased to 94°C in 0.5°C increments. Optical data were collected over the duration of the temperature increase. This was done to ensure that only one PCR product was amplified per reaction.
Relative expression of the RT-PCR products was determined using the mathematical model from M.W. Pfaffl (Pfaffl, 2001). This model calculates relative expression by using the equation ratio = [(Etarget)ΔCt target(control - sample)]/[(Eref)ΔCt ref(control - sample)]. The ratio of a target gene is expressed in a sample versus a control in comparison to a reference gene. Etarget is the real-time PCR efficiency of a target gene transcript, Eref is the real-time PCR efficiency of a reference gene transcript, ΔCttarget is the Ct deviation of control - sample of the target gene transcript, and ΔCtref = Ct deviation of control - sample of reference gene transcript. The reference gene we used is TUB1 because it is a stable unregulated transcript in each of our microarray data sets. Nine target genes belonging to the recombinational pathway were studied in the wild-type and the dna2-1 strains. For the calculation of the ratio old cells/young cells, the individual real-time PCR efficiencies (E) and the deviation ΔCt must be known. We calculated the efficiencies according to E = 10[-1/slope]. Because each sample was run in triplicate, the mean Ct value was used in the equation and the ΔCt values were the differences in averaged Ct values between old and young cells for the same gene. The control sample containing the same concentration of cDNA was chosen to be compared with the target gene.
RESULTS
Elutriation Centrifugation Allows the Enrichment of Old Cells
To study the biochemical pathways that are changed in old versus young cells, it is necessary to use a method of preparing old cells that allows isolation of significant numbers of old cells that have progressed far enough into their life span to show age-related changes. One method, the biotin-streptavidin technique, easily produces sufficient numbers of sufficiently aged cells for cell biological studies (Smeal et al., 1996; Lin et al., 2001). It is difficult to isolate sufficient quantities of wild-type cells older than 8 generations for studies such as microarray analysis or of chromosomal defects, due to the low yield of cells older than 8 generations by the biotin technique. However, 8-generation wild-type cells do not yet exhibit many of the significant pathologies of old cells (McMurray and Gottschling, 2003). In one previous study of old yeast cells by using microarray analysis, 8-generation wild-type cells showed limited changes in gene expression, and conclusions were mainly extrapolated from results by using a mutant that had a reduced median life span, sip2Δ (Lin et al., 2001). Because we wanted to work entirely with wild-type cells, we wanted to isolate cells nearer to the median life span of wild type, 21 generations. Based on the fact that a defining distinction between young and old cells is the increase in size of old cells, we reasoned that centrifugal elutriation might allow for enrichment of larger quantities of older cells. The use of size to enrich for old cells was first validated long ago by using a discontinuous centrifugation technique (Jazwinski, 1990). During the course of our studies, another laboratory published the characterization of old cells obtained by an elutriation method similar to the one we describe here, independently establishing the validity of elutriation for isolating aged yeast cells (Laun et al., 2001). Their technique differed in the size of the elutriation rotor with the result that fewer cells could be isolated by their method than by that described here. The most convincing evidence that old cells had been isolated was the demonstration that the residual life span of elutriated cells coincided precisely with the remaining life span of 18-generation-old cells (Laun et al., 2001).
Aged cells in exponentially growing cultures were isolated by elutriation as described in MATERIALS AND METHODS. To isolate cells that had reached their median life span, wild-type cells were grown overnight for 10 generations (A600 = 10), and old cells were isolated by elutriation. The large elutriated cells were inoculated into a fresh culture, grown overnight for a further eight generations (A600 = 1.5), and large 18-generation-old cells were isolated by elutriation. Mutant dna2-1 cells were grown overnight for eight generations (A600 = 1.5-2), the number of generations corresponding to their median life span. Using this method, from 12 or 16 l of wild-type or dna2-1 cells, respectively, we were able to reproducibly isolate 3 × 10⁹ aged cells. Thus, the elutriation rotor allows ease of isolation of large quantities of old cells from cultures of both wild-type and mutant cells. Because yeast cells lyse at the end of their life span, there is likely a minimal contamination of our cells by dead cells.
To confirm that the elutriation strategy enriched for aged cells in our hands, we analyzed the composition of the elutriated samples by counting the number of bud scars after Calcofluor staining, and the results for young and old wild-type cells isolated by elutriation are shown in Figure 1, A and B, respectively. The age distribution of old cells is the same as that found using the biotin-streptavidin technique (Figure 1C). At least 75% of the old elutriated wild-type cells have >15 bud scars, and >90% have more than eight bud scars. A small number of cells with less than three bud scars is always present, whether biotin or elutriation is used. This suggests that contamination with a few cells with a small number of bud scars is unavoidable. Such cells may represent daughters of old mothers, because old mothers give rise to large daughters that only return to normal size after two or three divisions (Jazwinski, 1990). Alternatively, these cells may be damaged by some other process unrelated to aging. It is nevertheless unlikely that such a small percentage of cells would significantly contribute to the gene expression profile for the entire population of old cells, because the percentage of these “young” cells is so small. For the dna2-1 strain, bud scar analysis is shown in Figures 1D (young) and 1E (old). Seventy-three to-78% (eight separate elutriations) of the dna2-1 old cells collected showed at least six bud scars. Because life span determinations show that there is stochastic cell cycle cessation throughout the life span, cells that had fewer bud scars were considered to have reached the same physiological state in fewer generations. Thus, although the number of generations is not normalized by this technique, the physiological state of the cells may be normalized by the size isolation.
Figure 1.

Calcofluor staining showing the generational profile of cells isolated by elutriation or biotin/streptavidin. (A) Young wild-type cells isolated by elutriation. Cells (238, 83, and 110) from three separate elutriations were observed and results averaged. (B) Old wild-type cells isolated by elutriation. Sixty-four, 73, and 91 cells, respectively, from three separate elutriations were observed and results averaged. (C) Old wild-type cells isolated by biotin/streptavidin. Seventy and 72 cells, respectively, from two isolations were observed and averaged. (D) Young dna2-1 cells isolated by elutriation. Cells (168 and 140) from two separate elutriations were observed and results averaged. (E) old dna2-1 cells isolated by elutriation. Forty-nine, 52, and 73, respectively, from three elutriations were observed. The averages and the standard deviations are shown for each bud scar number.
We also verified that elutriated cells were old by demonstrating additional phenotypes associated with old cells. Old cells show abnormal nucleolar morphology (Guarente, 1997). Therefore, we monitored the state of the nucleolus in young cells and aged cells after elutriation. Nucleoli were visualized using indirect immunofluorescence and monoclonal antibody to the abundant nucleolar protein Nop1, a protein involved in ribosome biogenesis (Aris and Blobel, 1988). Young elutriated cells showed 100% of cells with a normal nucleolus sitting as a cap (green) on the nucleus (blue stain) (Figure 2, A and B). As expected from the bud scar analysis, most, 90%, of the old dna2-1 cells showed a nucleolus that was either enlarged or extremely fragmented (Figure 2C). Greater than 75% of the sample (∼50 cells) of old wild-type cells show a fragmented or enlarged nucleolus characteristic of old cells (Figure 2D). The images in Figure 2 reflect the actual relative sizes of the young and old cells. Because both young and old cells were subjected to elutriation, none of these phenotypes is attributable to the elutriation procedure. Elutriation is considered one of the least perturbative methods of isolating cells for cell cycle studies, and this seems to be true for young versus old cell isolation as well.
Figure 2.

Anti-Nop1 antibody staining shows enrichment of old cells in elutriated samples. Young dna2-1 and wild-type cells (A and B) and old dna2-1 and wild-type cells (C and D) isolated with the elutriation centrifuge were stained with DAPI (dark blue) and with anti-Nop1 antibody (green). The cells shown are representative of >75% of the cells observed in the elutriation sample. The old and young cells on each panel are photographed at the same magnification. Therefore, the difference in size of the images between young and old cells and between wild type and mutant are representative of the age and of the strain.
Analysis of Cell Cycle State of the Isolated Cells
We next compared the cellular morphology and DNA content of the population of old wild-type and dna2-1 cells isolated by elutriation. We observed by microscopy that the aged wild-type cells represented all stages of the cell cycle, as expected for an exponentially growing culture. By contrast, 75% of the sample of old dna2-1 cells isolated by elutriation showed a dumbbell shape (see Figure 3 for examples). DAPI staining of the nuclei revealed that ∼70% had a nucleus entirely within one of the cells, although 30% showed some DNA beginning to partition into the daughter (Figure 3, D and F).
Figure 3.

dna2-1 cells isolated by elutriation after eight generations of growth show dumbbell morphology. Observation of the fraction of old dna2-1 cells isolated by elutriation showed that most of the cells had a dumbbell shape (A and B). DAPI staining (C and D) showed the partition of the DNA content in the cell. E and F represent, respectively, A and C merged, and B and D merged.
Flow cytometry analysis of DNA content was performed on the same samples of young and old cells. Comparison to the profiles of exponentially growing and stationary phase reference cells (Figure 4, A and B) showed a distribution in the young and old elutriated dna2-1 cells (Figure 4, C and E) and wild-type (Figure 4, D and F) similar to that found in an exponentially growing cell culture, although the peaks were reproducibly broadened in old wild-type cells (Figure 4F). More than 70% of the old dna2-1 cells contain 2C DNA, and ∼29% of the cells contain 1C DNA (Figure 4E). Our previous life span analysis of numerous dna2 alleles showed that 50% of the cells after six divisions were alive and capable of further division, although the cell cycle was drastically lengthened, with cells dividing only after 6-7 h (Mays Hoopes et al., 2002). We propose that 50% of the elutriated cells analyzed here have ceased division and that the remainder has a significantly lengthened cell cycle. To verify that the aged cells in the dna2-1 culture were capable of further division, we resuspended them in growth medium and monitored further division. After 3 h, ∼35.5% of the cells divided at least once and after 6 h and 30 min, ∼52.4% of the population divided at least once (our unpublished data). This shows that a fraction of the elutriated cells has a lengthened cell cycle and confirms that ∼50% of the elutriated cells have ceased division.
Figure 4.
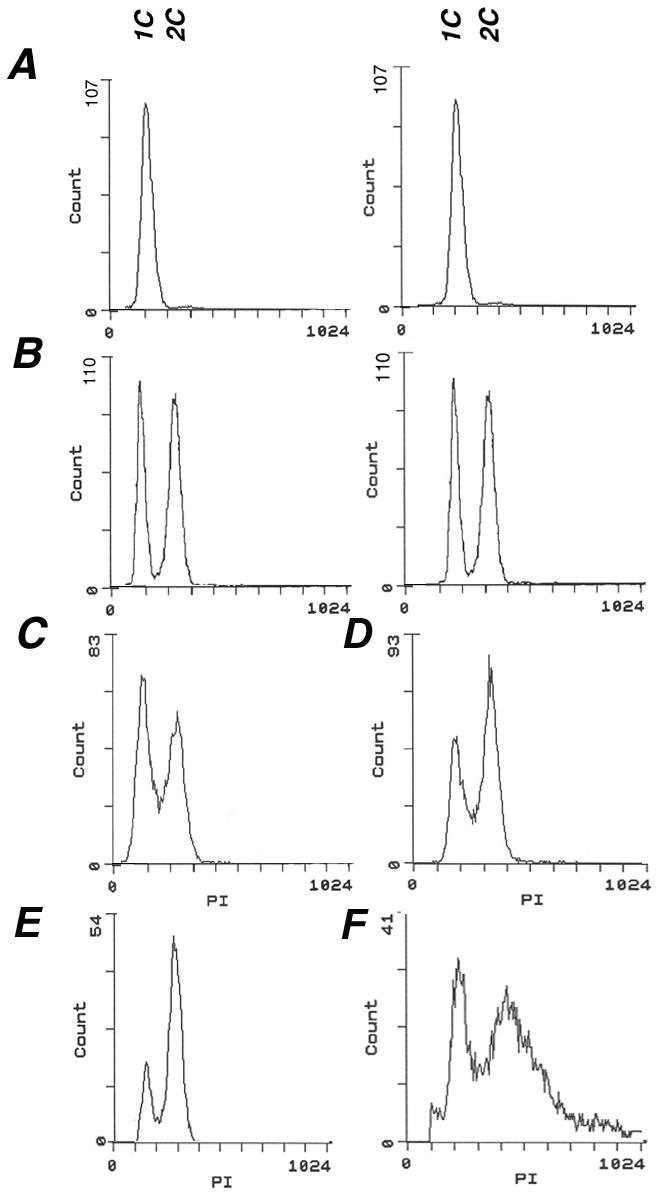
Cell cycle distribution of cells isolated by elutriation is normal. For flow cytometry analysis, cells were fixed, stained with propidium iodide, and analyzed. Wild-type cells isolated from a stationary phase (A) and from a log phase culture (B) were used as a reference. The DNA content of young and old dna2-1 cells (C and E) and young and old wild-type cells (D and F) isolated by elutriation was analyzed. The x-axis indicates the DNA content (1C and 2C) and the y-axis indicates the cell number.
In summary, the cells isolated are not lysed or damaged by the elutriation method, as shown by light microscopy and fluorescence microscopy. Calcofluor staining of bud scars and Nop1 antibody staining of the nucleolus confirmed the efficient enrichment of old cells in the sample and confirm that the large size of the isolated cells is due to their age. Thus, we have isolated a population of cells that is sufficiently enriched in old cells to enable biochemical analysis, such as microarray analysis, and this method will be valuable in further studies of the pathologies associated with the aging process in yeast.
Because of the short life span of the dna2 mutant, it proved difficult to catch the two different strains at exactly the same point in the life spans. We note that the dna2 cells may be further advanced in their life span than wild type. The old dna2 cells are larger than the old wild-type cells, and the cell cycle distribution is different, as described. This prevents a quantitative, one-to-one comparison between wild type and mutant in some cases. Thus, the microarray studies reported below are interpreted mainly, although not exclusively, as comparison between young and old cells of the same genotype.
Comparison of Global Gene Expression Patterns in Young and Old Cells
We have used microarray analysis to document differences in gene expression in young and old yeast cells isolated by elutriation, both for wild-type yeast and also for the isogenic, prematurely aging mutant dna2-1 (see MATERIALS AND METHODS). Two control experiments, one for each strain, were used to ensure reproducibility, to eliminate bias introduced by use of the two dyes used to label cDNAs, and to set the boundaries for the genes significantly differentially expressed in old versus young cells of each genotype. We labeled reverse transcripts of RNA from young cells of the same strain first with Cy3 and then with Cy5. We then hybridized the Cy3-labeled cDNA and the Cy5-labeled cDNA in the same reaction to a single array. The medians of the distributions of the ratio of the dye intensities were 0.764 and 0.822 for wild type and dna2-1, respectively. After intensity dependent normalization (Figure 5), most of the spot intensities fall along an M = 0 line, demonstrating the reproducibility of the experiment performed with the two dyes. The shift of the low- and high-intensity spots in the raw data closer to the M = 0 line shows that the normalization process was able to remove the bias generated by the dyes. After centering both distributions on 1, the variance of each did not change (1.159 and 0.378 for wild type and dna2-1, respectively). We observed that 94.39 and 94.36% of the ratios of Cy3 to Cy5 in the wild-type and the dna2-1 control experiments, respectively, were between 0.5 and 2. We concluded that a difference in expression level of at least twofold (median centered on 1) in the experiments described below comparing young and old cells could be considered significant with a 94-95% confidence level.
Figure 5.

Normalization of hybridizations in which the Cy3 (Green, G) and the Cy5 (Red, R) fluorescent dyes were reversed: controls comparing young cells/young cells. MA-plot showing the efficiency of the intensity-dependent normalization for the wild-type (A) and dna2-1 (B) experiments. In a “perfect” self-self hybridization, the intensity log ratios M in an MA-plot should be evenly distributed around zero across all intensity values A.
mRNA levels in young and old cells were then compared by preparing cDNA from young and old cells and determining the mean of the ratios of hybridization intensities for young/old cells in two separate experiments in which the dyes were reversed during preparation of the cDNAs. As just described, for a distribution of ratios centered on 1, genes whose expression changes significantly during aging exhibit ratios >2 or <0.5. Instead of being 1, however, the median of the distribution of the mean of the ratios for the wild-type strain comparing young and old cells is 1.068 and the variance of this distribution is 1.003. The genes differentially expressed in wild type therefore have a ratio of young cells/old cells either <0.568, for RNAs that increase in old cells, or greater than 2.068, for RNAs that decrease. The median of the distribution of the mean of the ratios of the dna2-1 experiment comparing young and old cells is 1.151 and the variance of this distribution is 0.993. Therefore, the genes differentially expressed in strain dna2-1 have a ratio of young cells/old cells either <0.651 (for RNAs that increase) or >2 (for RNAs that decrease). The correlation coefficients are 0.44 for the wild-type experiments and 0.56 for the dna2-1 experiments, which shows their reproducibility (Figure 6). The correlation coefficient was calculated with the linear regression equation CORREL from Excel: ρx,y = cov (X,Y)/(stdev(X) stdev(Y)).
Figure 6.

Normalization of the two hybridizations in which the Cy3 (Green, G) and the Cy5 (Red, R) fluorescent dyes were reversed: old cells/young cells. The MA-plots demonstrate the need for normalization of each of the reversed wild-type experiments (A) and each of the dna2-1 experiments (B).
We found transcription increased for 627 genes in old wild-type cells (10.22% of the genome), and decreased for 387 genes (6.30% of the genome). 898 genes were more highly transcribed (14.63% of the genome) and 656 genes down-regulated (10.69%) in old dna2-1 cells. We also found that 250 genes are commonly up-regulated in the old wild-type cells and the old dna2-1 cells (4.07% of the genome). The lists of all these genes and the raw and normalized data are available as supplementary data on the Web site at http://woldlab.caltech.edu/~lesur/old_and_young_cells/.
Expression Trends in Metabolic Genes
The genes whose levels changed during aging for wild-type and dna2-1, respectively, were put into categories defined in the MIPS database. Several patterns became apparent that overlapped with previous genome-wide responses to environmental or genetic manipulations. One pattern that emerged in both dna2 mutant and wild type as they increased in generational age was an increase in expression of genes involved in energy storage, such as gluconeogenesis and lipid metabolism (Figure 7 and gordon.txt in the supplementary data). Many of these genes overlapped with a set of age-associated changes in gene expression reported previously for wild type and in a mutant affecting the Snf1 pathway, a sip2Δ strain (a mutant that shows premature aging) (Lin et al., 2001). The genes shown in Figure 7A are limited to those reported by Lin et al. (2001) on which they based their proposal that aging in yeast is associated with a shift away from glycolysis and toward gluconeogenesis and energy storage, a shift otherwise seen in young cells when they detect low glucose levels (DeRisi et al., 1997; Ashrafi et al., 1999; Lin et al., 2001). Although the number of genes is not large, the expression patterns and their interpretation were verified by microbiochemical determination of levels of enzyme activities and of metabolites in the same cells used for the microarray studies (Lin et al., 2001). The mRNA levels of PCK1 (phosphoenolpyruvate carboxykinase), FPB1 (fructose-1,6-bisphosphatase), and BIO2 (biotin synthase), all involved in gluconeogenesis, rise at least twofold in both wild-type cells and in mutant dna2-1 as they age. The expression of genes involved in the glyoxylate cycle, a modified tricarboxylic-acid pathway (TCA) cycle used to make sugars from fat, such as ICL2 (isocitrate lyase) and MLS1 (malate synthase), POT1 (3-oxoacyl-CoA thiolase), ACS1 (acetyl CoA synthetase), SPS19 (2′, 4 dienoyl CoA reductase), and CAT2 (carnithine-o-acethyltransferase), and genes involved in lipid metabolism, are also increased. The expression of some genes, such as MDH2 (cytosolic malate dehydrogenase) involved in gluconeogenesis and pH adjustment, GAC1, and SGA1, involved in glycogen production, and ADR1, involved in ethanol/acetate metabolism, increased in the old dna2-1 cells but not in the wild-type strain. The congruence of observed increases in gene expression in wild-type yeast in our study and previous results in wild-type and in the sip2Δ strain (Lin et al., 2001) provides additional verification that aging cells isolated by elutriation and by the biotin/streptavidin technique reveal similar aging pathways.
Figure 7.

Up-regulation of genes in wild-type and dna2-1, suggesting an increase in expression of genes involved in gluconeogenesis and energy storage during aging. Genes listed, except TCA cycle genes, are those that also change in old wild type as reported by Lin et al. (2001). (Results are presented as the ratio of old (O) vs. young (Y) cells and represent the average values from duplicate hybridizations). The competitive hybridizations of young cells vs. young cells for each strain allowed us to conclude that any gene showing a difference in expression level of at least twofold in the experiments comparing young and old cells could be considered significant with a 94-95% confidence level. Gene annotations are from the YPD database (https://www.incyte.com/proteome/mainmenu.jsp). (A) Genes involved in gluconeogenesis and energy storage. (B) Venn diagram of overlap between our data and the ESR (Gasch and Werner-Washburne, 2002). (C) Genes involved in oxidative phosphorylation and TCA cycle genes.
More important than the overlap of our data with the limited sample of genes identified in the 8-generation-old cells observed in the Lin et al. (2001) study, is that a much larger number of genes affecting additional pathways was observed to change in our 18-generation-old wild type. Comparison of our data with data sets describing yeast expression patterns measured under a number of different stress conditions (Gasch et al., 2000) revealed that both wild type and mutant showed a broad metabolic stress response known as the ESR. Figure 7B shows a Venn diagram of the overlap and Figures 8, 10, and 11 show specific genes that change (see ESR_VENN_diagram.txt in the supplementary data). In addition to the genes involved in carbohydrate metabolism already mentioned, DNA repair genes and chaperone genes are induced and ribosomal protein genes are repressed, for instance. These data suggest that dna2-1 and the wild-type strain are responding during aging as if there were external stress even though they are growing in ample glucose at normal pH and ionic strength and in the absence of DNA-damaging agents. Another condition besides aging that induces all these genes is high external osmolarity (HEO), which also extends life span (Kaeberlein et al., 2002). The additional genes identified that were not found to change in the Lin et al. (2001) study of 8-generation cells further demonstrates the utility of the elutriation technique in comparison with the biotin technique for investigating the pathologies of aging.
Figure 8.

Numerous genes encoding components of DNA damage repair and checkpoint pathways are activated in old cells. Data plotted are the ratios of values for old (O) vs. young (Y) cells and represent the average values from duplicate hybridizations. The list includes genes that vary by at least twofold.
Figure 10.

Telomerase response genes up-regulated in old cells. The genes listed were previously shown by Teng et al. (2002) and Nautiyal et al. (2002) to be up-regulated in a yeast telomerase-deficient mutant. Results are presented as the ratios of old (O) vs. young (Y) cells and represent the average values from duplicate hybridizations. The list includes genes that vary by twofold. Gene annotations are from the YPD database (http://www.incyte.com/proteome/mainmenu.jsp).
Figure 11.

Telomerase response genes down-regulated in old cells. The genes listed were previously shown by Teng et al. (2002) and Nautiyal et al. (2002) to be down-regulated in a yeast telomerase-deficient mutant. Results are presented as the ratios of old (O) vs. young (Y) cells and represent the average values from duplicate hybridizations. The list includes genes that vary by twofold.
In addition to genes in the ESR, genes involved in energy production, in the TCA cycle (CIT1, CIT3, SDH1, SDH2, SDH4, LSC, and LSC2) and in oxidative phosphorylation, increased in dna2-1 but not in wild-type (Figure 7C and TCA.txt in the supplementary data). This suggests that in addition to the shift away from glycolysis, the dna2 cells are also shifting toward energy production. Similar genes are induced during life span-extending caloric restriction (Lin et al., 2002), but not during HEO, during which glycerol synthesis is induced (Kaeberlein et al., 2002). Both respiration and glycerol synthesis increase NAD+/NADPH ratios, however, which have been proposed to affect life span.
We also compared the expression of genes involved in the nuclear NAD+ salvage pathway: NPT1, PCN1, NMA1, NMA2, and QNS1. Additional copies of these genes have been shown to increase replicative life span, and they are thought to be important for fueling SIR2-dependent longevity functions, so they might be expected to change in old cells (Lin et al., 2000; Anderson et al., 2002). Unfortunately, PCN1, NMA1, NMA2, and QNS1 were removed from the dataset during the filtering process. NPT1, however, shows a significant (2.24-fold) increase in the old dna2-1 cells, though only a 1.7-fold increase in wild type, which is slightly less than the twofold significance threshold. This is consistent with the proposal that there may be an attempt to increase flux through the NAD+ pathway to prolong life span in the old dna2-1 cells (Anderson et al., 2002). For SIR2 itself, we found no significant change (WT yc/oc = 1.37 and dna2-1 yc/oc = 1.67). (Additional stress response genes induced during aging are described below).
Although the ESR comprises a set of common up- and down-regulated genes, the transcriptional and signaling pathways that induce the responses are not shared but are specific to each type of stress (Gasch and Werner-Washburne, 2002). Because the cells we study were not subjected to environmental stress in our experimental protocol, it will be interesting to determine what type of internal stress and which regulatory pathways cause the observed response (Gasch and Werner-Washburne, 2002). The data discussed below suggest that DNA damage is among the endogenous inducers of the ESR that we see.
DNA Damage Genes Are Induced during Aging
Genes encoding components of DNA damage repair and checkpoint pathways are activated in both old wild-type and dna2-1 cells (Figures 8 and 9 and repair_table.txt in the supplementary data). In some cases, there are interesting differences in the specific repair genes activated between wild-type and mutant and in other cases interesting similarities.
Figure 9.

Variation of expression of the genes involved in the RAD52 recombinational pathway determined by real-time RT-PCR confirms the microarray results. (A) Eight genes shown as being significantly up-regulated in the old wild-type cells by using microarray experiments are also significantly up-regulated in the RTPCR experiments. RT-PCR shows that RAD50, which has been filtered out in the microarray experiments, is also significantly up-regulated in the old wild-type cells. (B) In the dna2-1 old cells, eight genes that we found down-regulated with the microarray experiments are also down-regulated in old cells by using the RT-PCR technique. RAD51, the only gene belonging to the recombinational pathway found as being up-regulated in the old dna2-1 cells by using the microarray technique is also found up-regulated in the old dna2-1 cells by using RT-PCR. We used YMR118c, a succinate deshydrogenase, and CTS1, an endochitinase, as additional comparisons to verify correspondence between the dna2-1 microarray and RTPCR experiments.
Six genes belonging to the homologous recombination pathway that repairs DSBs are activated in wild type (RAD51, RAD52, RAD54, RAD59, RHC18, and RDH54). In addition, several additional genes, required for sister chromatid cohesion but recently implicated also in recombination, SMC1 and SMC3, are induced. Of these recombination genes, only RAD51 is induced in old dna2-1 cells. The induction in wild type and lack of induction in the dna2-1 mutant were confirmed using real-time RT-PCR (Figure 9). The difference could imply that DNA2 is required for induction of these genes; or these genes might be controlled by a clock that measures numbers of divisions and the dna2-1 cells exit the cell cycle before they divide this many times.
A small number of genes are coordinately induced after certain doses of ionizing radiation, MMS, treatment with HO endonuclease to create a double-strand break, and several other types of DNA-damaging agents (Gasch et al., 2001). The induction of these genes is dependent on the ATR-like kinase Mec1, and these genes have been proposed to constitute a “signature” for DNA damage (Gasch et al., 2001). As with other genes in the environmental stress response, the number of these genes induced and the extent of change varies with the type of damaging agent and the dose (Gasch et al., 2001; Gasch and Werner-Washburne, 2002). Among the DNA “signature” genes are RAD51 and RAD54, genes involved in homologous recombination; DUN1, involved in the Mec1-mediated DNA damage checkpoint response; RNR2 and RNR4, affecting ribonucleotide reductase subunits; PLM2, which has homology to the forkhead-associated domain found in a number of transcription factors and kinases; DIN7, encoding a damage inducible mitochondrial protein with homologies to nucleases; YER004w, which has homology to the human protein Tip30, a tumor repressor that mediates apoptosis (Shtivelman, 1997; Xiao et al., 1998); and YBR070c, of unknown function. We find that in old wild-type cells RAD51, RAD54, DUN1, and YBR070c are induced (Figure 8). PLM2 was removed during the filtering process. The fact that not all genes are induced may reflect that old wild-type cells (18-20 generations) are only at 35% of the maximum life span of this strain, and the level of damage may be insufficient for full induction. In dna2-1, six of the nine signature genes for DNA damage (RNR2, RNR4, RAD51, PML2, YER004w, and YBR070c) increased. RAD54, discussed above, DUN1, and DIN7 (a mitochondrial protein) are not overexpressed. dna2 may either be required for their induction, downstream from Mec1, or the level of damage at the permissive temperature in the dna2 mutant may not induce sufficient damage to induce the full set of genes.
Additional differences were found in individual repair genes. It is not clear what significance they have, because it is now well established that the genes induced after ionizing radiation, MMS, and other types of DNA damage show surprisingly little overlap with genes required for repair of the corresponding damage (Birrell et al., 2002). For instance, MSH2 and MSH6, which belong to the mismatch repair pathway; POL30, a replication gene that also belongs to the RAD6 postreplication repair pathway; and CDC9, which belongs to the nucleotide excision repair pathway are induced in the old wild-type cells but not in dna2 cells. In the dna2-1 strain (Figure 8), we found genes involved in the nucleotide excision repair pathway (RAD16 and SSL2) and genes involved in checkpoints overexpressed in old cells. HUG1, involved in the Mec1p-mediated checkpoint response to DNA damage and replication arrest, and perhaps required for recovery from checkpoint arrest (Basrai et al., 1999), and GRH1, involved in the spindle checkpoint, are elevated in old dna2-1 cells. The expression of SGS1, a RecQ helicase that affects life span (Sinclair et al., 1997), is elevated in the old dna2-1 cells (oc/yc = 2.20). This may be of interest in that we have recently shown that the human homologue of Sgs1, human BLM, suppresses the replication and repair defects of yeast dna2 mutants (Imamura and Campbell, 2003). DNA2 itself is induced in old wild-type cells but not in the dna2-1 mutant. No genes involved in the mismatch DNA repair pathway or in the postreplication repair pathway show any variation in expression in the mutant.
In summary, although the DNA repair genes activated in the dna2-1 old cells and in the wild-type old cells are different, activation in both of large numbers of repair genes, including multiple DNA signature genes, suggests that DNA damage is a characteristic of aging cells of both types. The only environmental condition that has been shown to cause such a coordinated induction is treatment of cells with DNA-damaging agents (Jelinsky et al., 2000; Gasch et al., 2001; Gasch and Werner-Washburne, 2002). We therefore suggest that endogenous DNA damage occurs during the aging process in wild type as well as in the dna2-1 mutant.
Response of Genes to Aging in dna2-1 Is Similar to the Telomerase Delete Response (TDR)
The TDR is a genome-wide expression response recently documented in two separate studies of cells lacking telomerase due to a deletion of the telomerase RNA, tlc1Δ mutants (Nautiyal et al., 2002; Teng et al., 2002). Such mutants undergo a cellular senescence attributed to the shortening of yeast telomeres rather than to deregulation of the normal replicative mother cell aging program. Telomerase senescence differs from mother cell aging in that cells go through 40-60 generations before losing viability and in that it is a symmetric rather than an asymmetric process, leading to cessation of division of both mother and daughter cells inheriting the truncated chromosomes. The senescence-associated TDR is characterized by up-regulation of oxidative phosphorylation and TCA cycle genes, of DNA repair genes, and of a number of genes involved in the ESR. The ESR includes genes involved in carbohydrate metabolism, cell cycle regulation, DNA synthesis, cell wall formation, transcriptional regulation, amino acid biosynthesis, protein degradation and cross-membrane transporters, and a number of unclassified proteins or proteins with no known function (Figure 10 and telomerase_table.txt in the supplementary data). There is significant overlap between the TDR and the genes that change during aging in dna2-1 (Figures 10, 11, and 12; TLC1_VENN_diagram.txt and chance_similarity_tlc1d_ dna2_1.txt in the supplementary data). Almost all of the ESR stress response genes induced in the TDR were identified in our experiments as being up-regulated in old dna2-1 cells, suggesting that there is an integrated cellular reorganization occurring that is similar in the dna2-1 old cells and the senescent tlc1Δ cells. Yet another aspect of the TDR pattern is the down-regulation of ribosomal genes, which Warner (1999) has suggested may reflect an attempt by cells to conserve energy by slowing growth, reducing protein synthesis and ribosome biogenesis. The down-regulation of ribosomal genes is shared by old wild type (Figure 11 and ribo_table.txt in supplementary data). Among cell cycle genes, the down-regulation of the histone genes is also common to the TDR and to dna2-1 mother cell aging. Wild type actually shows induction of the histone genes, by contrast (Figure 11 and telomerase_table.txt in the supplementary data). Few, if any, of these genes change in our control experiments (e.g., dna2_1 young Cy3/dna2_1 young Cy5). We conclude that similar but not identical stress genes are activated in dna2_1 mutant and in tlc1Δ mutant with critically short telomeres. The respiration and stress genes were not changed to as significant a degree in the 18-generation-old wild-type cells (Figure 10), perhaps because they were not as far along in their life span as the dna2-1 cells.
Figure 12.
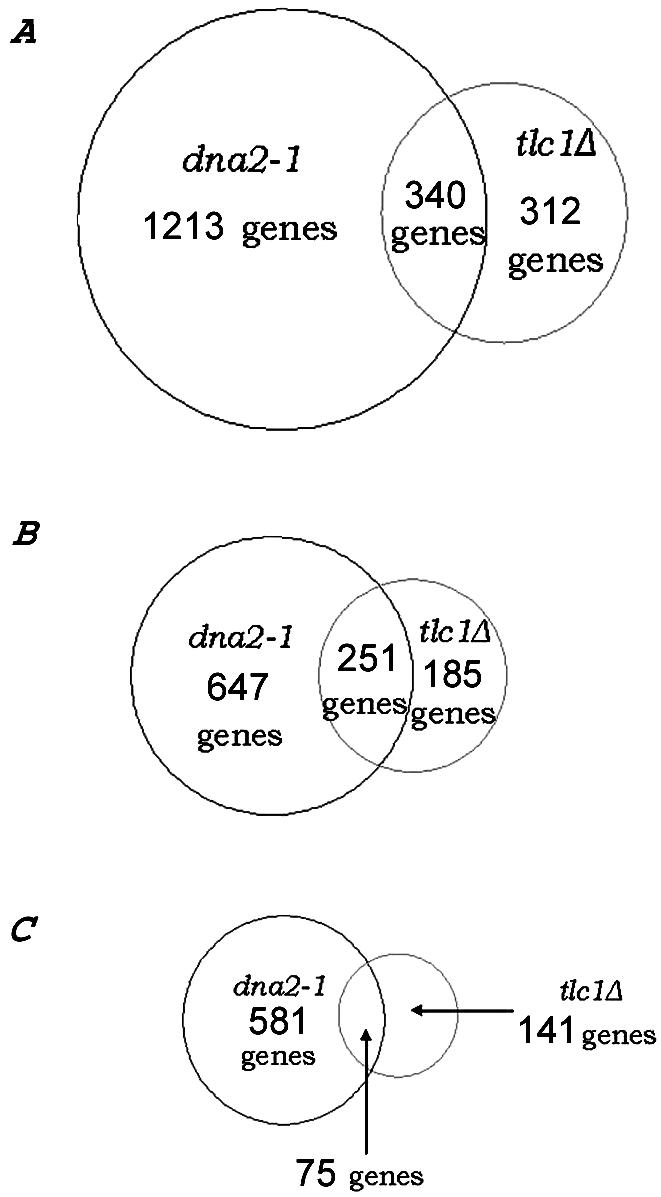
Venn diagram of genes commonly up- and down-regulated in the telomerase deficient mutant tlc1Δ and in the DNA replication mutant dna2-1. Genes (52.15%) differentially expressed by at least twofold in senescent tlc1Δ (Nautiyal et al., 2002) and 21.89% of the genes that differ by at least twofold in the old dna2-1 cells are the same (A). Genes (57.57%) up-regulated in the tlc1Δ (Nautiyal et al., 2002) mutant are the same as 27.95% of the genes up-regulated in the old dna2-1 cells (B). Genes (34.72%) down-regulated in the tlc1Δ (Nautiyal et al., 2002) mutant are the same as 11.43% of the genes down-regulated in the old dna2-1 cells (C).
Perhaps the most noteworthy commonality between dna2-1 and the TDR is in the DNA repair genes (Nautiyal et al., 2002; Teng et al., 2002). Five of the DNA damage signature genes are induced during TDR and four of these are among the six induced in old dna2-1. RAD54 and DUN1, recombination and checkpoint genes, are not induced either in the TDR or in aging dna2-1 cells. The recombination genes as a group (RAD54, RAD59) fail to be induced during TDR, just as noted above for old dna2-1, with the exception of RAD51 in both cases (Figures 9 and 10). The similarities in the response of recombination genes in the TDR and the aging dna2-1 cells, and differences from wild type suggest that the conditions leading to the response may be the same in TDR and in aging dna2-1 cells.
In summary, the similarity of genes expressed in old dna2-1 and in TDR supports the idea that the response to replicative mother cell aging in the dna2-1 strain is very similar to that occurring during cellular senescence due to lack of telomerase. This pattern is less obvious in the wild-type strain at the point in the life span we study.
The telomerase-deficient signature (TDS) is a subset of the TDR genes and comprises 12 genes that are induced in telomerase-defective mutants but that are not induced in >20 other conditions of stress and DNA damage (Nautiyal et al., 2002). Despite the large number of genes that respond in the same way to both dna2 aging and telomerase-defective senescence, only two of the TDS genes overlap between the old dna2 gene expression response and the tlc1Δ mutant: a single replication gene, CRR1, that interacts with cruciform DNA, and a gene of unknown function: YFR018c (Figure 10). However, we do note derepression of the subtelomeric Y' ORF and of HXK1, another subtelomeric gene in the aging dna2-1 cells (Figure 10), suggesting a defect in telomeric silencing and in turn an alteration in telomere structure. We conclude that though the global response is the same in the two conditions, there is still some specialization that is different between mother cell aging and telomerase deficiency.
Cell Cycle-regulated Genes
The levels of numerous genes necessary for normal cell cycle progression are higher in the old wild-type cells. Out of the 627 genes up-regulated in the old wild-type cells, 45 are normally expressed in G2/M phase of the cell cycle (7.18%) (Spellnoon et al., 1998). Only a few are up-regulated in the old dna2-1 cells. (The list of these genes is available in the supplementary data file cycle_repli_table.txt). Only a few of these are common to wild type and the dna2 mutant. Many genes involved in chromosome condensation and segregation were up-regulated at this point in the wild-type life span. BUB2, a checkpoint protein required for cell cycle arrest in response to loss of microtubule function, DBF20, a cell cycle protein kinase involved in termination of M-phase, and FKH1 are more highly expressed in old wild-type cells. In the same way, the expression of APC1, a component of the anaphase promoting complex required for Clb2p degradation and for the metaphase-anaphase transition, increases with aging in the wild-type strain. Genes involved in chromosome condensation and segregation were elevated (CHL4, CIN2, CSE4, IPL1, LOC7, MCD1/SCC1, MIF2, SLI15, SMC1, and SMC3). Many DNA replication genes, such as replication factor A (RFA1, RFA2, and RFA3) and replication factor C (RFC3); CDC54, required for initiation of DNA replication; CDC9; DNA ligase; and RTT104, which promotes replication fork progression through the ribosomal DNA, are up-regulated in the old wild-type cells.
With respect to the old dna2-1 cells, of the 958 genes more highly expressed in the old dna2-1 cells, 147 are cell cycle regulated (15.3%). Forty-nine genes are specifically expressed in G1, 16 in S, 14 in S/G2, 33 in G2/M, and 35 in M/G1 (Spellman et al., 1998). Thus, the cell cycle-regulated genes reflect the distribution of cells with respect to cell cycle position shown in the flow cytometry profile (Figure 4). SRC1, whose expression is cell cycle regulated, ESS1, involved in cell cycle control and HUG1, involved in the Mec1p-mediated checkpoint response to DNA damage and replication arrest, show a higher expression level in the old dna2-1 cells. Interestingly, none of the genes involved in chromosome condensation and segregation and up-regulated in old wild-type cells seems to be up-regulated in the dna2-1 strain.
DISCUSSION
We recently reported that DNA replication mutants show reduced life span and that the old cells show almost all of the phenotypes of aging wild-type cells (Mays Hoopes et al., 2002). Combining DNA microarray-based transcriptional profiling with the centrifugal elutriation method of isolating old yeast cells, we have now defined new aspects of how the wild-type as well as the dna2-1 DNA replication mutant age. Our microarray results were confirmed using RT-PCR of 12 different genes from both old and young wild-type and dna2 cells. The data define an environmental stress response in both aging wild-type and dna2 cells. In addition, they provide a phenotypic link in yeast between senescence due to telomere metabolism and replicative mother cell aging, and we suggest that the shared response is a customized program within the ESR that senses chromosome damage. The three major pathways we find affected during aging—metabolism, stress response, and genetic stability-coincide with three broad categories of physiological processes that are known to influence life span (Jazwinski, 1999). Both the method of isolating old cells and the interpretation of the microarray results will be discussed here.
The elutriation method described here clearly isolates old cells with the same age distribution as obtained by the biotin-streptavidin technique. The change in nucleolar morphology, the demonstration that both the young and old cells are still cycling by flow cytometry, the previous study of the remaining life span of elutriated cells and characterization of old cells isolated by discontinuous centrifugation further confirm that old cells are being isolated (Egilmez et al., 1990; Laun et al., 2001). The elutriation technique has two advantages over the biotin-streptadvidin beads. First, elutriation allows isolation of much larger quantities of old cells that have progressed far enough into their life span to show significant pathologies of aging than does biotin-streptavidin trapping. The utility of having older cells is suggested by the much broader change in gene expression recorded in our study than in a previous study that depended on the biotin technique, and thus was limited to 8-generation-old wild-type cells (Lin et al., 2001). Second, we found that the elutriated cells were much more robust than cells isolated by the biotin technique. For instance, old dna2 cells isolated by the biotin technique are very fragile and lyse during isolation, further decreasing yield. The ease of the elutriation procedure should facilitate further direct biochemical characterization of cellular damage occurring during aging in yeast, which has been hampered by difficulty of preparing large populations of cells for study to date, but which is clearly important for understanding what limits yeast life span and causes cell cycle arrest during replicative aging.
We report here the use of the elutriated cells for transcriptome analysis. The first response we documented was a shift in the transcriptional program for carbohydrate and lipid metabolism genes in both old dna2-1 cells and old wild-type cells, similar to changes others found in wild-type at 8 generations (Lin et al., 2001). We therefore add changes in gene expression to the list of phenotypes we have published previously that support the conclusion that aging in dna2 shares similarities to aging in wild type (Mays Hoopes et al., 2002). The changes are not identical, either because of other affects of the dna2-1 mutation, or because the wild-type cells are not as far advanced in their life span as the dna2-1 mutant. Interestingly, the metabolic response that we observed (in both wild type and in dna2-1 mutant) was much more extensive than that reported previously. In fact, it conforms to a set of genes induced or repressed in response to many types of environmental stress, including but not limited to low glucose, high external osmolarity or ionic strength, extreme conditions of temperature or pH, starvation of many nutrients, and treatment with toxic chemicals, including DNA-damaging agents, known as the ESR (Gasch et al., 2000; Gasch and Werner-Washburne, 2002, and references therein). The induction of the ESR is consistent with the proposal that old cells may be responding to endogenous DNA damage, because exogenous DNA-damaging agents induce the same genes (Jelinsky and Samson, 1999; Jelinsky et al., 2000; Gasch et al., 2001; Birrell et al., 2002; Kaeberlein et al., 2002). The induction of a variety of stress-response genes has also been observed in the worm daf-2 long-living mutant by Kenyon et al. (Murphy et al., 2003). In worms, the aging process is regulated by the insulin signaling pathway. Mutations which inactivate the insulin receptor DAF2 result in longer life span. Insulin binding to its receptor activates a signal transduction pathway that inhibits DAF-16. Active DAF-16 activates a group of genes that extend life span. This suggests that the activation of stress-response genes associated with aging is conserved in higher eukaryotes.
The second notable specific gene expression response we observed is the induction of many DNA repair genes, in both old dna2-1 and in wild-type, even though our studies are carried out in the absence of any exogenous DNA-damaging agent. Such induction, in particular the coordinate induction of many of the DNA damage signature genes, is not generally considered a feature of the general ESR, although some DNA repair genes have been found to be induced under stress conditions. The only environmental stress conditions previously observed to coordinately induce a set of DNA repair genes, however, are treatments that lead to DNA damage. These facts together allow us to suggest that endogenous DNA damage occurs as mother cells progress through their replicative life span. Many theories of aging invoke genomic instability in the aging process, and as evidence of this, old yeast cells accumulate high levels of extrachromosomal rDNA circles (Sinclair and Guarente, 1997). Old cells also undergo a switch after ∼20 generations that leads to a hyperrecombinogenic state, as evidenced by a 20- to 400-fold increase in LOH (McMurray and Gottschling, 2003). We propose that the induction of the DNA repair signature genes suggests that such phenomena are in response to accumulating DNA damage. It will be possible to use the elutriated cells to verify this by physical analysis of the DNA in the old cells, as we have done for various helicase mutants by using young cells only (Weitao et al., 2003a,b).
Speculation about the specific type of DNA damage that is occurring from microarray results is difficult, because it has recently become clear that there is a general lack of correlation between the genes expressed in response to various damage stimuli and genes required to maintain viability in the presence of damage caused by those stimuli (Gasch et al., 2001). However, the DNA damage signature genes expressed are genes that respond to Mec1, the yeast ATR homologue, suggesting that this response pathway is initiated in mother cell aging. It will be interesting to test the effect of mec1 mutations on induction of the repair genes in old cells and on yeast mother cell life span. One of the DNA damage signature genes that is not expressed in dna2-1 is RAD54, a recombination gene. In fact with the exception of RAD51, none of the recombination pathway genes (RAD52, 54, 59) is induced in old dna2-1 (or in the TDR; see below) but are significantly induced in wild type. Failure to induce the RAD52, 54, and 59, RHC18, and RDH54 genes, but induction of RAD51, is interesting if these genes are induced to preserve genomic integrity, because it may suggest that one role of DNA2 in preserving genome stability during aging (or after DNA damage in young cells) is regulating the expression of these genes. Dna2 also interacts with Lcd1, which interacts with the Mec1 kinase, and the recombination genes are partially controlled by Mec1 in response to DNA damage (Gasch et al., 2001; Gavin et al., 2002). It will be interesting to see whether wild-type that has progressed further in its life span loses induction of these genes. It will also be interesting to use elutriated old cells to look directly for damaged chromosomes by using various physical assays.
An unexpected finding was that the transcriptional profile in the old dna2-1 cells is similar to the response of cells senescing after deletion of telomerase RNA, the TDR. tlc1Δ mutants, that lack telomerase RNA and therefore telomerase activity, gradually lose viability, reaching a minimum viability 40-60 generations after the loss of telomerase activity. The gene expression profile as these mutant cells approach the point of minimum viability is known as the TDR (Nautiyal et al., 2002; Teng et al., 2002). The responses shared in old dna2-1 and in tlc1Δ mutants are the ESR, the shift to energy production genes, and the induction of certain repair genes but not others, in particular the induction of the DNA signature genes, but the lack of induction of genes in the recombination pathway, with the exception of RAD51. The significant overlap in the TDR and the gene expression response in the aging dna2-1 cells that we found was unanticipated, because replicative mother cell aging has not been connected to telomere shortening in yeast. In fact, it has been shown that long telomeres, rather than short telomeres, decrease mother cell life span (D'Mello and Jazwinski, 1991; Austriaco and Guarente, 1997).
What do the similarities between the TDR and the aging program in the dna2 mutant imply about the nature of the genomic damage that may be occurring during aging, if not shortening of telomeres? One possibility is that the signal that induces the genes is not direct DNA damage but a change in telomere chromatin structure. Our finding of derepression of a subtelomeric Y' ORF, would support the idea of a structural change at telomeres in old dna2-1 cells (Figure 10). Overexpression of DNA2 has been shown to cause derepression of marker genes inserted in the telomeric DNA, suggesting that DNA2 may be part of or affect telomeric chromatin (Singer et al., 1998). Supporting this idea, we have shown that DNA2 shows dynamic localization to telomeres and this localization requires the silencing regulator Sir3 (Choe et al., 2002). The inverse correlation between telomere length and life span in yeast has been interpreted to be due to a relocation of silencing proteins (Austriaco and Guarente, 1997). It may also be relevant that, in mammalian cells, the senescence that accompanies loss of telomeric repeats seems to be due not to the loss of the repeats per se, but rather to an alteration in the protected structure of the repeats as they shorten (Karlseder et al., 2002).
In addition to the TDR, the expression profiles in the old cells also mimic profiles of genes induced under specific conditions that promote life span extension. The shift away from genes involved in energy utilization toward energy storage is found in the HEO response (Kaeberlein et al., 2002). However, we found a complementary increase in genes involved in respiration, both oxidative phosphorylation genes TCA cycle genes in aging, in the dna2 mutant. These are specific changes and are not a component of the general ESR or HEO. There is an increase in these genes in the TDR, however, which is accompanied by a proliferation of mitochondria. This may be significant because it has long been known that interorganelle signaling may be a determinant of life span in yeast (Kirchman et al., 1999). Interestingly, the same genes are induced during caloric restriction (growth on low glucose), which is known to expand life span (Lin et al., 2000, 2002). We thus propose that these transcriptional changes are related to the adaptation of old cells to conditions that will limit their life span.
In summary, using elutriation to isolate old yeast cells, we found genes in three major pathways affected during aging: metabolism, stress response, and genetic stability. These coincide with three broad categories of physiological processes that are known to influence life span (Jazwinski, 1999) and introduce a novel connection to telomeric senescence.
Acknowledgments
We thank Shelley Diamond for assistance with the elutriation centrifuge and flow cytometry. We thank Laura Hoopes for stimulating discussions throughout the course of this work and for comments on the manuscript. We are also very grateful for the suggestions of Sagar Damle. Microarray analyses were performed in the Gene Expression Facility of the Biology Division at Caltech. We thank Barbara Wold for advice and the use of a server. Isabelle Lesur is a participant in the Initiative in Computational Molecular Biology, which is funded, in part, by an award from the Burroughs Wellcome Fund Interfaces program. This work was supported by national Institutes of Health grant GM-25508.
Article published online ahead of print. Mol. Biol. Cell 10.1091/mbc.E03-10-0742. Article and publication date are available at www.molbiolcell.org/cgi/doi/10.1091/mbc.E03-10-0742.
Abbreviations used: ESR, environmental stress response; HEO, high external osmolarity; LOH, loss of heterozygosity; MMS, methyl methanesulfonate; TCA, tricarboxylic-acid pathway; TDR, telomerase-deficient response; TDS, telomerase-deficient signature.
References
- Anderson, R.M., Bitterman, K.J., Wood, J.G., Medvedik, O., Cohen, H., Lin, S.S., Manchester, J.K., Gordon, J.I., and Sinclair, D.A. (2002). Manipulation of a nuclear NAD+ salvage pathway delays aging without altering steady-state NAD+ levels. J. Biol. Chem. 277, 18881-18890. [DOI] [PubMed] [Google Scholar]
- Aris, J.P., and Blobel, G. (1988). Identification and characterization of a yeast nucleolar protein that is similar to a rat liver nucleolar protein. J. Cell Biol. 107, 17-31. [DOI] [PMC free article] [PubMed] [Google Scholar]
- Ashrafi, K., Sinclair, D., Gordon, J., and Guarente, L. (1999). Passage through stationary phase advances replicative aging in Saccharomyces cerevisiae. Proc. Natl. Acad. Sci. USA 96, 9100-9105. [DOI] [PMC free article] [PubMed] [Google Scholar]
- Austriaco, N.R., Jr., and Guarente, L.P. (1997). Changes of telomere length cause reciprocal changes in the lifespan of mother cells in Saccharomyces cerevisiae. Proc. Natl. Acad. Sci. USA 94, 9768-9772. [DOI] [PMC free article] [PubMed] [Google Scholar]
- Ayyagari, R., Gomes, X.V., Gordenin, D.A., and Burgers, P.M.J. (2003). Okazaki fragment maturation in yeast. I. Distribution of functions between Fen1 and Dna2. J. Biol. Chem. 278, 1618-1625. [DOI] [PubMed] [Google Scholar]
- Bae, S.-H. and Seo, Y.-S. (2000). Characterization of the enzymatic properties of the yeast Dna2 helicase/endonuclease suggests a new model for Okazaki fragment processing. J. Biol. Chem. 275, 38022-38031. [DOI] [PubMed] [Google Scholar]
- Basrai, M.A., Velculescu, V.E., Kinzler, K.W., and Hieter, P. (1999). NORF5/HUG1 is a component of the MEC1-mediated checkpoint response to DNA damage and replication arrest in Saccharomyces cerevisiae. Mol. Cell. Biol. 19, 7041-7049. [DOI] [PMC free article] [PubMed] [Google Scholar]
- Birrell, G.W., Brown, J.A., Wu, H.I., Giaever, G., Chu, A.M., Davis, R.W., and Brown, J.M. (2002). Transcriptional response of Saccharomyces cerevisiae to DNA-damaging agents does not identify the genes that protect against these agents. Proc. Natl. Acad. Sci. 99, 8778-8783. [DOI] [PMC free article] [PubMed] [Google Scholar]
- Budd, M.E., and Campbell, J.L. (1995). A new yeast gene required for DNA replication encodes a protein with homology to DNA helicases. Proc. Natl. Acad. Sci. USA 92, 7642-7646. [DOI] [PMC free article] [PubMed] [Google Scholar]
- Budd, M.E., and Campbell, J.L. (1997). A yeast replicative helicase, Dna2 helicase, interacts with yeast FEN-1 nuclease in carrying out its essential function. Mol. Cell. Biol. 17, 2136-2142. [DOI] [PMC free article] [PubMed] [Google Scholar]
- Budd, M.E., and Campbell, J.L. (2000). The pattern of sensitivity of yeast dna2 mutants to DNA damaging agents suggests a role in DSB and postreplication repair pathways. Mutat. Res. 459, 173-186. [DOI] [PubMed] [Google Scholar]
- Budd, M.E., Choe, W.-C., and Campbell, J.L. (1995). DNA2 encodes a DNA helicase essential for replication of eukaryotic chromosomes. J. Biol. Chem. 270, 26766-26769. [DOI] [PubMed] [Google Scholar]
- Choe, W., Budd, M., Imamura, O., Hoopes, L., and Campbell, J.L. (2002). Dynamic localization of an Okazaki fragment processing protein suggests a novel role in telomere replication. Mol. Cell. Biol. 22, 2002-2017. [DOI] [PMC free article] [PubMed] [Google Scholar]
- D'Mello, N.P., and Jazwinski, S.M. (1991). Telomere length constancy during aging of Saccharomyces cerevisiae. J. Bacteriol. 173, 6709-6713. [DOI] [PMC free article] [PubMed] [Google Scholar]
- DeRisi, J.L., Iyer, V.R., and Brown, P.O. (1997). Exploring the metabolic and genetic control of gene expression on a genomic scale. Science 278, 680-686. [DOI] [PubMed] [Google Scholar]
- Diamond, R.A. (1991). Separation and enrichment of cell populations by centrifugal elutriation. Methods: a companion to methods in enzymology 2173-2182.
- Egilmez, N.K., Chen, J.B., and Jazwinski, S.M. (1990). Preparation and partial characterization of old yeast cells. J. Gerontol. 45, B9-B17. [DOI] [PubMed] [Google Scholar]
- Gasch, A.P., Huang, M., Metzner, S., Botstein, D., Elledge, S.J., and Brown, P.O. (2001). Genomic expression responses to DNA-damaging agents and the regulatory role of the yeast ATR homolog Mec1p. Mol. Biol. Cell 12, 2987-3003. [DOI] [PMC free article] [PubMed] [Google Scholar]
- Gasch, A.P., Spellman, P.T., Kao, C.M., Carmel-Harel, O., Eisen, M.B., Storz, G., Botstein, D., and Brown, P.O. (2000). Genomic expression programs in the response of yeast cells to environmental changes. Mol. Biol. Cell 11, 4241-4257. [DOI] [PMC free article] [PubMed] [Google Scholar]
- Gasch, A.P., and Werner-Washburne, M. (2002). The genomics of yeast responses to environmental stress and starvation. Funct. Integr. Genomics 2, 181-192. [DOI] [PubMed] [Google Scholar]
- Gavin, A.-C., et al. (2002). Functional organization of the yeast proteome by systematic analysis of protein complexes. Nature 415, 141-147. [DOI] [PubMed] [Google Scholar]
- Guarente, L. (1997). Link between aging and the nucleolus. Genes Dev. 11, 2449-2455. [DOI] [PubMed] [Google Scholar]
- Guarente, L., and Kenyon, C. (2000). Genetic pathways that regulate ageing in model organisms. Nature 408, 255-262. [DOI] [PubMed] [Google Scholar]
- Imamura, O., and Campbell, J.L. (2003). The human Bloom syndrome gene suppresses the DNA replication and repair defects of yeast dna2 mutants. Proc. Natl. Acad. Sci. 100, 8193-8198. [DOI] [PMC free article] [PubMed] [Google Scholar]
- Jazwinski, S.M. (1990). An experimental system for the molecular analysis of the aging process: the budding yeast Saccharomyces cerevisiae. J. Gerontol. 45, B68-B74. [DOI] [PubMed] [Google Scholar]
- Jazwinski, S.M. (1993). The genetics of aging in the yeast Saccharomyces cerevisiae. Genetica 91, 35-51. [DOI] [PubMed] [Google Scholar]
- Jazwinski, S.M. (1999). Molecular mechanisms of yeast longevity. Trends Microbiol. 7, 247-252. [DOI] [PubMed] [Google Scholar]
- Jazwinski, S.M., Kim, S., Lai, C.-Y., and Benguria, A. (1998). Epigenetic stratification: the role of individual change in the biological aging process. Exp. Geretol. 6, 571-580. [DOI] [PubMed] [Google Scholar]
- Jelinsky, S.A., Estep, P., Church, G.M., and Samson, L.D. (2000). Regulatory networks revealed by transcriptional profiling of damaged Saccharomyces cerevisiae cells: Rpn4 links base excision repair with proteasomes. Mol. Cell. Biol. 20, 8157-8167. [DOI] [PMC free article] [PubMed] [Google Scholar]
- Jelinsky, S.A., and Samson, L.D. (1999). Global response of Saccharomyces cerevisiae to an alkylating agent. Proc. Natl. Acad. Sci. USA 96, 1486-1491. [DOI] [PMC free article] [PubMed] [Google Scholar]
- Kaeberlein, M., Andalis, A.A., Fink, G.R., and Guarente, L. (2002). High osmolarity extends life span in Saccharomyces cerevisiae by a mechanism related to calorie restriction. Mol. Cell. Biol. 22, 8056-8066. [DOI] [PMC free article] [PubMed] [Google Scholar]
- Karlseder, J., Smogorzewska, A., and de Lange, T. (2002). Senescence Induced by Altered Telomere State, Not Telomere Loss. Science 295, 2446-2449. [DOI] [PubMed] [Google Scholar]
- Kirchman, P., Kim, S., Lai, C.-Y., and Jazwinski, S.M. (1999). Interorganelle signaling is a determinant of longevity in Saccharomyces cerevisiae. Genetics 152, 179-190. [DOI] [PMC free article] [PubMed] [Google Scholar]
- Kuo, C.L., and Campbell, J.L. (1983). Cloning of Saccharomyces cerevisiae DNA replication genes: isolation of the CDC8 gene and two genes that compensate for the cdc8-1 mutation. Mol. Cell. Biol. 3, 1730-1737. [DOI] [PMC free article] [PubMed] [Google Scholar]
- Kuo, C.-L., Huang, C.-H., and Campbell, J.L. (1983). Isolation of yeast DNA replication mutants using permeabilized cells. Proc. Natl. Acad. Sci. USA 80, 6465-6469. [DOI] [PMC free article] [PubMed] [Google Scholar]
- Laun, P., Pichova, A.M., F., JFuchs, J., Ellinger, A., Kohlwein, S., Dawes, I., Frohlich, K.-U., and Breitenbach, M. (2001). Aged mother cells of Saccharomyces cerevisiae show markers of oxidative stress and apoptosis. Mol. Microbiol. 39, 1166-1173. [PubMed] [Google Scholar]
- Lin, S.-J., Defossez, P.-A., and Guarente, L. (2000). Requirement of NAD and SIR2 for life-span extension by calorie restriction in Saccharomyces cerevisiae. Science 289, 2126-2128. [DOI] [PubMed] [Google Scholar]
- Lin, S.J., Kaeberlein, M., andalls, A.A., Sturtz, L.A., Defossez, P.A., Culotta, V.C., Fink, G.R., and Guarente, L. (2002). Calorie restriction extends Saccharomyces cerevisiae lifespan by increasing respiration. Nature 418, 344-348. [DOI] [PubMed] [Google Scholar]
- Lin, S.S., Manchester, J.K., and Gordon, J.I. (2001). Enhanced gluconeogenesis and increased energy storage as hallmarks of aging in Saccharomyces cerevisiae. J. Biol. Chem. 276, 36000-36007. [DOI] [PubMed] [Google Scholar]
- Mays Hoopes, L.L., Budd, M., Choe, W., Weitao, T., and Campbell, J.L. (2002). Mutations in DNA replication genes reduce yeast life span. Mol. Cell. Biol. 22, 4136-4146. [DOI] [PMC free article] [PubMed] [Google Scholar]
- McMurray, M.A., and Gottschling, D.E. (2003). An age-induced switch to a hyperrecombinational state. Science 301, 1908-1911. [DOI] [PubMed] [Google Scholar]
- Mortimer, R.K., and Johnston, J.R. (1959). Life span of individual yeast cells. Nature 183, 1751-1752. [DOI] [PubMed] [Google Scholar]
- Muller, I., Zimmermann, M., Becker, D., and Flomer, M. (1980). Calendar life span versus budding life span of Saccharomyces cerevisiae. Mech. Ageing Dev. 12, 47-52. [DOI] [PubMed] [Google Scholar]
- Murphy, C., McCarroll, S., Bargmann, C., Fraser, A., Kamath, R., Ahringer, J., Li, H., and Kenyon, C. (2003). Genes that act downstream of DAF-16 to influence the lifespan of Caenorhabditis elegans. Nature 414, 277-283. [DOI] [PubMed] [Google Scholar]
- Nautiyal, S., DeRisi, J.L., and Blackburn, E.H. (2002). The genome-wide expression response to telomerase deletion in Saccharomyces cerevisiae. Proc. Natl. Acad. Sci. USA 99, 9316-9321. [DOI] [PMC free article] [PubMed] [Google Scholar]
- Nestelbacher, R. (2000). The influence of oxygen toxicity on yeast mother cell-specific aging. Exp. Gerontol. 35, 63-70. [DOI] [PubMed] [Google Scholar]
- Parenteau, J., and Wellinger, R.J. (1999). Accumulation of single-stranded DNA and destabilization of telomeric repeats in yeast mutant strains carrying a deletion of RAD27. Mol. Cell. Biol. 19, 4143-4152. [DOI] [PMC free article] [PubMed] [Google Scholar]
- Pfaffl, M.W. (2001). A new mathematical model for relative quantification in real-time RT-PCR. Nucleic Acids Res. 29, 2002-2007. [DOI] [PMC free article] [PubMed] [Google Scholar]
- Pichova, A., Vondrakova, D., and Breitenbach, M. (1997). Mutants in the Saccharomyces cerevisiae RAS2 gene influence life span, cytoskeleton, and regulation of mitosis. Can. J. Microbiol. 43, 774-781. [DOI] [PubMed] [Google Scholar]
- Rep, M., Krantz, M., Thevelein, J.M., and Hohmann, S. (2000). The transcriptional response of Saccharomyces cerevisiae to osmotic shock. Hot1p and Msn2p/Msn4p are required for the induction of subsets of high osmolarity glycerol pathway-dependent genes. J. Biol. Chem. 275, 8290-8300. [DOI] [PubMed] [Google Scholar]
- Shtivelman, E. (1997). A link between metastasis and resistance to apoptosis of variant small cell lung carcinoma. Oncogene 14, 2167-2173. [DOI] [PubMed] [Google Scholar]
- Sinclair, D.A. (2002). Paradigms and pitfalls of yeast longevity research. Mech. Ageing Dev. 123, 857-867. [DOI] [PubMed] [Google Scholar]
- Sinclair, D.A., and Guarente, L. (1997). Extrachromosomal rDNA circles-a cause of aging in yeast. Cell 91, 1033-1042. [DOI] [PubMed] [Google Scholar]
- Sinclair, D.A., Mills, K., and Guarente, L. (1997). Accelerated aging and nucleolar fragmentation in yeat sgs1 mutations. Science 177, 1313-1316. [DOI] [PubMed] [Google Scholar]
- Singer, M.S., Kahana, A., Wolf, A.J., Meisinger, L.L., Peterson, S. e., Goggin, C., Nahowald, M., and Gottschling, D.E. (1998). Identification of high-copy disruptors of telomeric silencing in Saccharomyces cerevisiae. Genetics 150, 613-632. [DOI] [PMC free article] [PubMed] [Google Scholar]
- Smeal, T., Claus, J., Kennedy, B., Cole, F., and Guarente, L. (1996). Loss of transcriptional silencing causes sterility in old mother cells of S. cerevisiae. Cell 84, 633-642. [DOI] [PubMed] [Google Scholar]
- Spellman, P.T., Sherlock, G., Zhang, M.Q., Iyer, V.R., Anders, K., Eisen, M.B., Brown, P.O., Botstein, D., and Futcher, B. (1998). Comprehensive identification of cell cycle-regulated genes in the yeast Saccharomyces cerevisiae by microarray hybridization. Mol. Biol. Cell 9, 3273-3297. [DOI] [PMC free article] [PubMed] [Google Scholar]
- Teng, S., Epstein, C., Tsai, Y.L., Cheng, H.W., H.L., C. and J.J., L. (2002). Induction of global stress response in Saccharomyces cerevisiae cells lacking telomerase. Biochem. Biophys. Res. Commun. 291, 714-721. [DOI] [PubMed] [Google Scholar]
- Wang, J., Nygaard, V., Smith-Sorensen, B., Hovig, E., and Myklebost, O. (2002). MArray: analysing single, replicated or reversed microarray experiments. Bioinformatics 18, 1139-1140. [DOI] [PubMed] [Google Scholar]
- Warner, J.R. (1999). The economic ribosome biosynthesis in yeast. Trends Biochem. Sci. 24, 437-440. [DOI] [PubMed] [Google Scholar]
- Weitao, T., Budd, M., and Campbell, J.L. (2003a). Evidence that yeast SGS1, DNA2, SRS2, and FOB1 interact to maintain rDNA stability. DNA Repair Mut. Res. 532, 157-172. [DOI] [PubMed] [Google Scholar]
- Weitao, T., Budd, M., Mays Hoopes, L.L., and Campbell, J.L. (2003b). Dna2 helicase/nuclease causes replicative fork stalling and double-strand breaks in the ribosomal DNA of Saccharomyces cerevisiae. J. Biol. Chem. 278, 22513-22522. [DOI] [PubMed] [Google Scholar]
- Xiao, H., Tao, Y., Greenblatt, J., and Roeder, R.G. (1998). A cofactor, TIP30, specifically enhances HIV-1 Tat activated transcription. Proc. Natl. Acad. Sci. 95, 2146-2151. [DOI] [PMC free article] [PubMed] [Google Scholar]
- Yang, Y.H., Dudoit, S., Luu, P., Lin, D.M., Peng, V., Ngai, J., and Speed, T.P. (2002). Normalization for cDNA microarray data: a robust composite method addressing single and multiple slide systematic variation. Nucleic Acids Res. 30, e15. [DOI] [PMC free article] [PubMed] [Google Scholar]