

Abstract
It has been common experimentally to use high frequency, tetanic, stimulation to activate metabotropic glutamate receptors (mGluRs) in cortex and thalamus. To determine what type of stimulation is actually necessary to activate mGluRs we examined the effects of varying stimulation duration and intensity on activating mGluR responses. We used a thalamocortical and an intracortical slice preparation from mice and performed whole cell recordings from neurons in the ventral posterior medial nucleus or in layer 4 of primary somatosensory cortex (S1) while electrically stimulating in layer 6 of S1. Extracellular ionotropic glutamate receptor antagonists and GABAA receptor antagonists were used to isolate Group I or Group II mGluR responses. We observed that high frequency stimulation is not necessary for the activation of either Group I or Group II mGluRs. Either could be activated with as few as 2-3 pulses at stimulation frequencies around 15-20Hz. Additionally, increasing the number of pulses, intensity of stimulation, or stimulation frequency increased amplitude and duration of the mGluR response.
INTRODUCTION
Metabotropic glutamate receptors (mGluRs) are G-protein-coupled receptors that can be found in many parts of the mammalian brain, including the thalamus and cortex [16]. Unlike the fast action of ionotropic glutamate receptors (iGluRs), mGluRs are slow to respond, and the effects of their activation can last for several hundreds of milliseconds, or even seconds [44, 6, 18].
Due to their distribution, Group I and Group II mGluRs are of particular interest with regards to cortical and thalamic function [29, 34, 15, 17, 27, 10, 26]. A major difference between these two receptor groups is that while activation of Group I mGluRs results in postsynaptic depolarization of the cell, activation of Group II mGluRs has hyperpolarizing postsynaptic effects [19, 8, 13, 23, 10].
In thalamus and cortex, mGluRs can be activated by inputs that exhibit a modulatory (or Class 2) synaptic profile such as the projection from layer 6 to layer 4 in several cortical areas [23, 24, 10], from cortical layer 6 to thalamus [30, 33] and some intracortical pathways [7, 9]. On the other hand, mGluRs do not become activated by glutamatergic inputs with driver (or Class 1) synaptic characteristics, such as the retinogeniculate pathway [33], the mammilothalamic pathway [32] and some thalamocortical [22, 37, 38] and corticothalamic [33] projections.
Experiments making use of in vitro slice preparations have typically used high-frequency (>50Hz) and often high intensity (>150pA) stimulation of an afferent pathway to activate mGluRs [2, 4, 20], especially in cases where stimulation of axons was involved [32]. This raises questions regarding how commonly mGluRs are activated under more physiological conditions. For instance, some studies have suggested that much less activity is required among glutamatergic afferents to activate Group I mGluR responses in thalamus [30] and cerebellum [14].
To help clarify this issue, we chose to characterize the stimulation parameters required to activate Group I and Group II mGluRs in two modulatory pathways: the projection from layer 6 to layer 4 in the primary somatosensory cortex (S1) and the feedback projection from layer 6 of S1 to the ventral posterior medial nucleus (VPM) of the thalamus.
METHODS
Slice preparation
All procedures were approved by the Institutional Animal Care and Use Committee of the University of Chicago. BALB/c mice (Harlan) of either sex (age 7-16 days postnatal) were anaesthetized with isoflurane and decapitated. For studying corticothalamic projections, thalamocortical slices (500μm thick) were prepared by blocking the brain at a 55° angle from the midsagittal plane and then gluing the blocked side onto a vibratome platform (Leica, Germany) for slicing [1]. For studying intracortical projections, we prepared 400μm-thick coronal slices. Following sectioning, the brain slices were placed in oxygenated artificial cerebrospinal fluid containing (in mM) 125 NaCl, 3 KCl, 1.25 NaH2PO4, 1 MgCl2, 2 CaCl2, 25 NaHCO3 and 25 glucose.
Electrophysiology
Whole-cell recordings in current clamp mode were performed as described before [37]. Recording glass pipettes (input resistances 3-8 MΩ) were filled with intracellular solution containing (in mM) 117 K-gluconate, 13 KCl, 1 MgCl2, 0.07 CaCl2, 10 HEPES, 0.1 EGTA, 2 Na2-ATP, and 0.4 Na-GTP; pH 7.3, 290 mOsm. For both corticothalamic and intracortical projections, electrical stimulation of layer 6 was delivered by a concentric bipolar electrode (FHC, Bowdoinham, ME). For studying the corticothalamic pathway, recordings were performed in VPM, and for studying intracortical projections, recordings were performed in layer 4 barrels of primary somatosensory cortex.
GABAA receptors were blocked with SR95531 (20μM) to prevent inhibitory inputs from the thalamic reticular nucleus in corticothalamic pathway experiments or from cortical interneurons in the intracortical pathway experiments. CGP-46381 (50 nM) was used to block GABAB receptors. Short term plasticity was assessed as described before [37]. This was done in order to identify the type of input of the stimulated pathway given that only Class 2 inputs are known to activate mGluRs [35]. Isolation of mGluR responses was achieved by blocking ionotropic glutamate receptors with AMPA and NMDA receptor antagonists (DNQX, 50 μM, and AP5, 100 μM respectively). The effects of stimulation intensity, frequency, and number of pulses on mGluR response amplitude and duration were assessed under these conditions. Stimulation intensities ranged from 25μA to 250μA for all experiments. The number of pulses was varied from 1 to 60 pulses, and frequencies ranged from 10Hz to 125Hz. The duration of each pulse was always 0.1ms. A response was defined as any depolarization or hyperpolarization exceeding 0.5mV, lasting at least 450ms, and occurring within 2 sec of stimulation. mGluR response amplitude was measured as the peak amplitude of the response (from baseline), occurring at any time during the response. Group II mGluRs were isolated by blocking type 1 and 5 mGluRs (i.e. Group I mGluR) with LY367385 (40μM) and MPEP (30μM), respectively, while Group I mGluRs were isolated by blocking Group II mGluRs with MPPG (300μM).
mGluR response duration was measured as the time from the initial change in membrane potential to the time the membrane potential returned to baseline. The time to peak mGluR response was measured as the time from the onset of response to when the peak response amplitude occurred. After all measurements were taken, responses were verified as being mediated by Group I or Group II mGluRs by using the relevant antagonists (see above).
RESULTS
We performed a series of recordings in 41 excitatory1 neurons that received direct input from layer 6 (18 in VPM, 23 in layer 4 of S1). In both VPM and layer 4 cells, low frequency stimulation (10Hz) of layer 6 resulted in EPSPs exhibiting paired-pulse facilitation and an increasing amplitude with increasing stimulation intensity (Supp.Figure 1), in agreement with previous reports [22, 33]. Subsequently, iGluR antagonists were applied to the bath and allowed to wash in for 10 minutes. Complete block of iGluRs was confirmed by the absence of EPSPs following low frequency (10Hz), high intensity (200-250μA) stimulation of layer 6 (Supp.Figure 1). The subsequent demonstration of mGluR activation (see below) demonstrated that these layer 6 afferents are Class 2 in nature [7, 37, 38, 39].
mGluR Responses
We were able to elicit mGluR responses in all 41 cells of this study. For cells in thalamus receiving layer 6 input, these responses were always mediated by Group I mGluRs [32, 33]. On the other hand, neurons in layer 4 showed responses that were mediated by both Group I and/or Group II mGluRs [23, 24], and these responses were isolated using the appropriate antagonists. We studied 14 neurons with Group I mGluR responses and 9 neurons with Group II mGluR responses in layer 4. As noted in Discussion, prior evidence indicates that these responses are due to activation of postsynaptic mGluRs.
Increasing the number of pulses, while keeping stimulation frequency and intensity constant, produced an increase in the peak response amplitude, time to peak response, and response duration. This was true for both Group I and Group II mGluR responses (Figures 1A, 1B, and 2a-c). Response amplitude increased in a logarithmic fashion with the greatest increase in amplitude occurring over a range of 2-20 pulses (average increase ± SD over this range: of 2.51±1.0mV for Group I and 1.8±0.18mV for Group II) with less significant increases for 20-60 pulses (average increase over this range: 1.21±0.28mV for Group I and 0.39±0.76mV for Group II, Figure 2a, Supp.Table 1). An analysis of the change in response amplitude over number of pulses for these two ranges showed significantly larger increases in response amplitude over the 2-20 pulse range for both Group I and Group II responses (Mann-Whitney, p<0.05 for Group I; p<0.01 for Group II). On the other hand, the time to peak showed a positively monotonic relationship with the number of pulses (Figure 2b). We observed mGluR responses with as few as 2 pulses, as long as the inter-pulse interval was less than approximately 75ms which is consistent with previous findings [30]; however, mGluR responses were never seen following a single pulse, regardless of stimulation intensity (Figures 1I, 1J, Supp.Figure 2).
Figure 1.
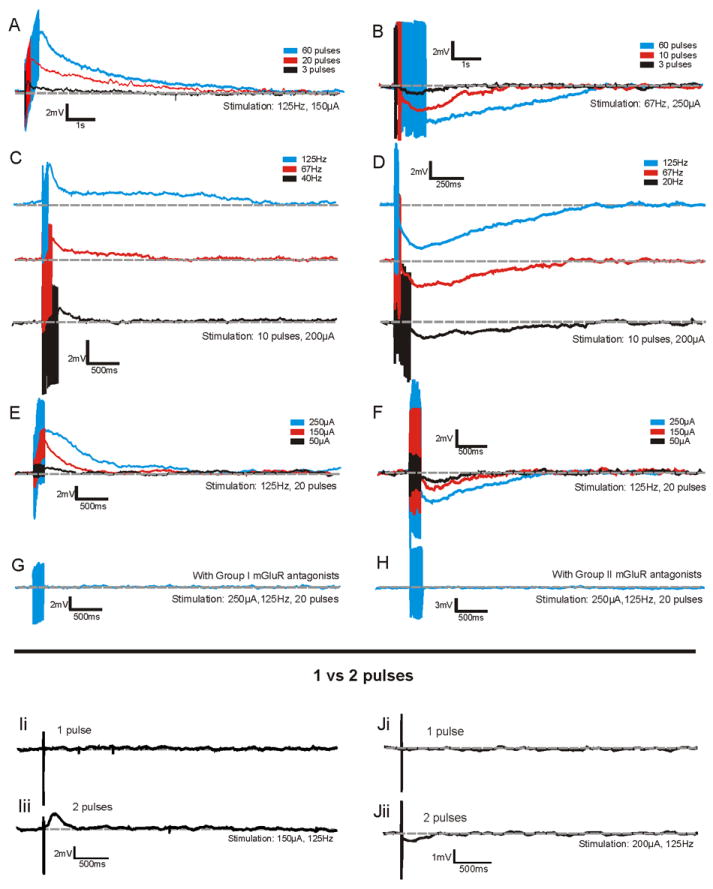
Examples of Group I and II mGluR responses in VPM and/or layer 4 of S1. Effect of increasing pulse number on Group I mGluR responses of a VPM neuron (A) and Group II mGluR responses in a layer 4 neuron (B). Effect of increasing stimulation frequency on Group I mGluR responses of a VPM neuron (C) and Group II mGluR responses in a layer 4 neuron (D) (traces have been separated for clarity). Effect of increasing stimulation intensity on Group I mGluR responses of a neuron in layer 4 (E) and Group II mGluR responses in a layer 4 neuron (F). For the same neurons as in E and F, the Group I and II mGluR responses were eliminated by Group I mGluR antagonists (LY367385 and MPEP) and Group II mGluR antagonists (MPPG) respectively (G and E). Lower panel: Activation of mGluR responses requires a minimum of 2 stimulation pulses. Ii. A single stimulation pulse in layer 6 of S1 does not produce any response in a VPM cell of a slice bathed in iGluR antagonists. Iii. Two stimulation pulses in layer 6 of S1 of the same slice produce a clear Group I mGluR response in the above VPM cell. Ji. A single stimulation pulse in layer 6 of S1 does not produce any response in a layer 4 cell of a slice bathed in iGluR antagonists. Jii. Two stimulation pulses in layer 6 of S1 in the same slice produce a clear Group II mGluR response in the above layer 4 cell.
Figure 2.
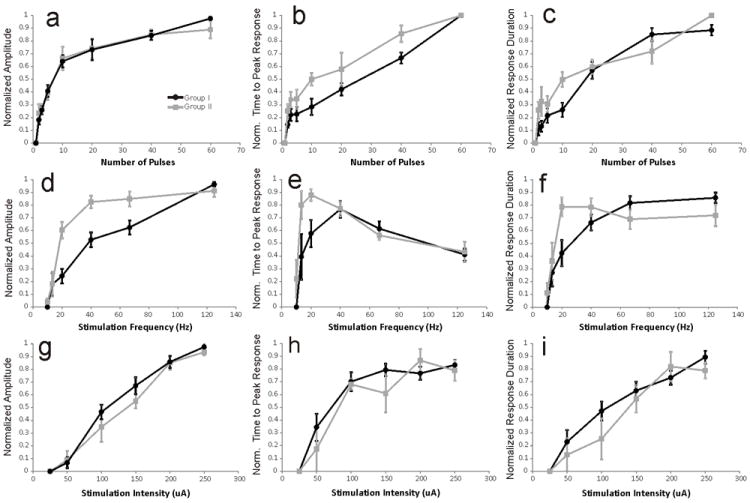
Group I (black lines, n=32) and Group II (gray lines, n=9) mGluR responses for different stimulation parameters. The first column represents the relationship between normalized mGluR amplitude and the number of stimulation pulses, stimulation frequency and stimulation intensity. The second column represents the relationship between normalized time-to-peak mGluR response and the number of stimulation pulses, stimulation frequency and stimulation intensity. The third column represents the relationship between normalized mGluR response duration and the number of stimulation pulses, stimulation frequency and stimulation intensity. With regard to Group I mGluR responses, data collected from VPM and layer 4 of S1 have been pooled together. Error bars represent SEM. Data were normalized using the value of the greatest response amplitude, time-to-peak, or duration, produced by each cell for each particular stimulation parameter (i.e. number of pulses, frequency, or intensity).
Next, we assessed the effect of stimulation frequency on the mGluR responses. Increasing the frequency of stimulation once again caused an increase in response amplitude for both Group I and Group II mGluR responses (Figures 1C, 1D, and 2d). For Group I mGluR responses, response amplitude showed a logarithmic increase as stimulation frequency was increased and response duration showed a similar pattern (Figures 2d, 2f). Group I mGluR response time to peak increased across stimulation frequencies of 10-40Hz by an average of 0.64±0.9s over that range (time to peak was significantly larger at 40Hz than 10Hz, Mann-Whitney, p<0.01), but then decreased by an average of 0.46±0.04s between frequencies of 40 and 125Hz (time to peak was significantly shorter at 125Hz than at 40Hz, Mann-Whitney, p<0.05, see Figure 2e, Supp.Table 1).
Group II mGluR responses showed a different pattern in response to increasing stimulation frequency; specifically, responses of larger amplitude and duration were achieved at lower stimulation frequencies than for Group I mGluR responses (Figures 2d, 2f). For instance, at a stimulation of 20Hz, average Group II mGluR response amplitudes were -1.98±0.67mV, lasting 3.15±1.56s, while Group I mGluR responses were 0.99±0.63mV, lasting 1.92±1.71s (Mann-Whitney, absolute response magnitude, p<0.05; response duration, p<0.05). Response amplitude for Group II mGluR began to plateau around 40Hz and response duration peaked at 20Hz. The time to peak of Group II mGluR responses showed a similar pattern to that of Group I mGluR responses, peaking at middle stimulation frequencies and then decreasing at higher frequencies (Figure 2e). However, the Group II mGluR responses once again achieved the peak value at lower frequencies (20Hz) than Group I mGluR responses (40Hz). We observed Group I mGluR responses at stimulation frequencies around 15Hz but never for 10Hz stimulation. On the other hand, some layer 4 neurons (n=3) exhibited Group II responses at frequencies as low as 10Hz, further evidence that Group II mGluR responses were more prominent at lower stimulation frequencies.
Our third stimulation parameter was intensity, which is thought to relate to the number of afferent axons activated, because more of the highly convergent Class 2 inputs are activated at higher stimulation intensities [32, 33, 37, 38, 39]. Increasing stimulation intensity resulted in increases in response duration, amplitude, and time to peak for both Group I and II mGluR responses (Figures 1E, 1F, and 2g-i). Both response amplitude and duration increased gradually as stimulation intensity increased (Figures 2g, 2i). On the other hand, time to peak showed the greatest increases up to 100-150μA of stimulation but failed to show any significant increases for larger stimulation intensities (Figure 2h). The threshold for eliciting mGluR responses was between 50-75μA for cells of both pathways tested. Cells in VPM had a threshold of 70.8±9.7μA whereas cells in layer 4 had a slightly lower threshold of 65.4±12.7μA; this was not statistically significant (p=0.42).
Following the examination of the mGluR responses in each cell, the appropriate Group I or Group II mGluR antagonists were added to the bath in order to conclusively demonstrate the metabotropic origin of these responses (see Figures 1G, 1H).
In general, most cells clearly responded with stimulation as low as 5-10 pulses at 20-40Hz. For both Group I and II mGluR responses, the largest amplitude responses were seen at high stimulation intensities and/or large numbers of pulses (Supp.Figure 2).
DISCUSSION
We measured various components of mGluR responses in a corticothalamic and an intracortical pathway while varying the frequency and intensity of stimulation as well as the number of pulses used. We found that, as a general rule, increases in all three parameters resulted in increased mGluR response amplitude and duration, an effect observed for both Group I and Group II mGluR responses. Overall, the activation patterns of the two Groups of mGluRs across the different stimulation parameters were highly comparable, although Group II mGluRs required somewhat lower stimulation frequencies to reach maximum response amplitude and duration.
Even though Group II mGluRs are often associated with presynaptic locations [28, 36], the effects that we observed here were presumed to be postsynaptic based on earlier experiments from our laboratory [23]. Similarly Group I mGluR responses in layer 4 of S1 and VPM have also been previously reported to be postsynaptic [24, 33].
Our findings regarding Group I mGluR activation resemble those reported by McCormick and von Krosigk [30] in the thalamus and by Dzubay and Otis [14] in the cerebellum, in that mGluR responses can be induced with as little as 2 stimulation pulses, at relatively low stimulation frequencies of around 15-20Hz and with stimulation intensities as low as 50-75μA. We extended this finding to intracortical pathways, and we demonstrated that Group II mGluRs can also be activated by such modest stimulation parameters. Thus, while a larger presynaptic response is associated with greater mGluR activation, such activation begins at relatively low rates of afferent input. A study of the olfactory bulb described mGluR responses following even a single stimulation pulse [11], but in our examples, a single pulse was never sufficient.
Comparing the effects of different frequency of stimulation on iGluRs and mGluRs
Depending on the synaptic properties of a specific input, increases in stimulation frequency can have very different effects on the postsynaptic iGluR response. More specifically, for inputs that generate paired-pulse depression (e.g. Class 1/ driver response), increases in stimulation frequency result in increased synaptic depression, where the iGluR-mediated EPSPs become smaller with decreasing interstimulus intervals during the stimulus train. Conversely, for inputs that generate paired-pulse facilitation (e.g. Class 2/ modulatory response), like the ones we have examined here, increases in stimulation frequency result in increased synaptic facilitation, where iGluR-mediated EPSPs continue to grow throughout the stimulus train [25], and this increase follows a logarithmic pattern [12]. It is worth noting that Class 2 inputs are the sole activators of mGluRs, which as we have shown here can generate responses that also grow in a logarithmic fashion following increases in stimulation frequency. The increase in iGluR response amplitudes for Class 2 inputs following increases in stimulus frequency is thought to be the result of elevated amounts of neurotransmitter release [12, 42]. This same mechanism may be responsible for the effect we observed here for mGluRs. These differences in dynamics between Class 1 and 2 inputs may serve different purposes. For Class 1 inputs, thought to be the main input source for information processing (reviewed in [35]), the paired-pulse depression provides adaptation to ongoing levels of activity [5], thereby opposing response saturation at high input levels and extending the dynamic input/output range across the synapse. For Class 2 inputs, the increasing postsynaptic responses with greater input strength for both iGluR and mGluR components may simply lead to increasing modulatory functions.
mGluRs as modulators
Unlike iGluRs, the fast activation of which makes them suitable for the reliable and timely transmission of information across synapses, the role of mGluRs appears to be one of a modulator of neuronal excitability, including involvement in mechanisms of both short-term and long-term synaptic plasticity. Due to the slower kinetics and the long-lasting postsynaptic effects of their activation, mGluRs are not suitable for signal transmission; rather they are better suited for influencing the way in which other signal transmission of other (e.g., Class 1) inputs takes place [35]. More specifically, activation of Group I mGluRs can maintain a cell at a depolarized state for relatively long periods of time, thus increasing its excitability and therefore enhancing the signal transmission of other incoming inputs [41]. Group I mGluRs have also been implicated in mechanisms of long-term potentiation and depression [3, 21, see 31]. On the other hand, activation of postsynaptic Group II mGluRs can result in relatively prolonged periods of hyperpolarization and therefore decreased cell excitability, where signals arriving from other inputs cannot be relayed efficiently, resulting in an overall reduced flow of information. Another modulatory effect of Group II mGluRs is to reduce EPSP amplitude and influence short term plasticity mechanisms in cortex [10, 26]. Finally, prolonged changes in membrane potential achieved by mGluR activation would play a role in the control of voltage-gated ionic conductances with long inactivation time constants (e.g., IT), and this represents another modulatory function for both Groups of mGluRs.
Conclusions
We have demonstrated that high-frequency, prolonged stimulation, involving convergence of many inputs is not required to evoke mGluR responses in thalamus and cortex in vitro. Functionally, this implies that mGluRs can become activated even during periods of low frequency presynaptic firing, thus making their involvement in synaptic communication and postsynaptic modulatory processes more physiologically relevant than has sometimes been supposed.
Supplementary Material
Highlights.
We examined Group I and II mGluR responses to variable stimulation parameters
The activation patterns of Group I and II mGluRs were very similar in nature
High-frequency/intensity stimulation is not necessary to activate these receptors
mGluRs can often be activated by only 2 stimulation pulses but never by one.
Acknowledgments
NIDCD Grant:DC008794 and NEI Grant EY022338.
ABBREVIATIONS
- EPSP
excitatory post synaptic potential
- iGluR
ionotropic glutamate receptor
- mGluR
metabotropic glutamate receptor
- MGNv
ventral portion of the medial geniculate nucleus
- S1
primary somatosensory cortex
- VPM
ventral posterior medial thalamic nucleus
Footnotes
In the rodent, VPM is devoid of interneurons, while all cells we recorded from in layer 4 were regular-spiking.
Publisher's Disclaimer: This is a PDF file of an unedited manuscript that has been accepted for publication. As a service to our customers we are providing this early version of the manuscript. The manuscript will undergo copyediting, typesetting, and review of the resulting proof before it is published in its final citable form. Please note that during the production process errors may be discovered which could affect the content, and all legal disclaimers that apply to the journal pertain.
References
- 1.Agmon A, Connors BW. Thalamocortical responses of mouse somatosensory (barrel) cortex in vitro. Neuroscience. 1991;41:365–79. doi: 10.1016/0306-4522(91)90333-j. [DOI] [PubMed] [Google Scholar]
- 2.Batchelor AM, Garthwaite J. Frequency detection and temporally dispersed synaptic signal association through a metabotropic glutamate receptor pathway. Nature. 1997;385(6611):74–7. doi: 10.1038/385074a0. [DOI] [PubMed] [Google Scholar]
- 3.Bellone C, Luscher C, Mameli M. Mechanisms of synaptic depression triggered by metabotropic glutamate receptors. Cell Mol Life Sci. 2008;65(18):2913–23. doi: 10.1007/s00018-008-8263-3. [DOI] [PMC free article] [PubMed] [Google Scholar]
- 4.Brasnjo G, Otis TS. Neuronal glutamate transporters control activation of postsynaptic metabotropic glutamate receptors and influence cerebellar long-term depression. Neuron. 2001;31(4):607–16. doi: 10.1016/s0896-6273(01)00377-4. [DOI] [PubMed] [Google Scholar]
- 5.Chung S, Li X, Nelson SB. Short-term depression at thalamocortical synapses contributes to rapid adaptation of cortical sensory responses in vivo. Neuron. 2002;34:437–446. doi: 10.1016/s0896-6273(02)00659-1. [DOI] [PubMed] [Google Scholar]
- 6.Conn PJ, Pin JP. Pharmacology and functions of metabotropic glutamate receptors. Annu Rev Pharmacol Toxicol. 1997;37:205–237. doi: 10.1146/annurev.pharmtox.37.1.205. [DOI] [PubMed] [Google Scholar]
- 7.Covic EN, Sherman SM. Synaptic properties of connections between the primary and secondary auditory cortices in mice. Cereb Cortex. 2011;21(11):2425–41. doi: 10.1093/cercor/bhr029. [DOI] [PMC free article] [PubMed] [Google Scholar]
- 8.Cox CL, Sherman SM. Glutamate Inhibits Thalamic Reticular Neurons. J Neurosci. 1999;19(15):6694–6699. doi: 10.1523/JNEUROSCI.19-15-06694.1999. [DOI] [PMC free article] [PubMed] [Google Scholar]
- 9.DePasquale R, Sherman SM. Synaptic properties of corticocortical connections between the primary and secondary visual cortical areas in the mouse. J Neurosci. 2011;31(46):16494–506. doi: 10.1523/JNEUROSCI.3664-11.2011. [DOI] [PMC free article] [PubMed] [Google Scholar]
- 10.DePasquale R, Sherman SM. Modulatory effects of metabotropic glutamate receptors on local cortical circuits. J Neurosci. 2012;32(21):7364–72. doi: 10.1523/JNEUROSCI.0090-12.2012. [DOI] [PMC free article] [PubMed] [Google Scholar]
- 11.De Saint Jan D, Westbrook GL. Disynaptic amplification of metabotropic glutamate receptor 1 responses in the olfactory bulb. J Neurosci. 2007;27(1):132–40. doi: 10.1523/JNEUROSCI.2439-06.2007. [DOI] [PMC free article] [PubMed] [Google Scholar]
- 12.Dittman JS, Kreitzer AC, Regehr WG. Interplay between facilitation, depression, and residual calcium at three presynaptic terminals. J Neurosci. 2000;20(4):1374–85. doi: 10.1523/JNEUROSCI.20-04-01374.2000. [DOI] [PMC free article] [PubMed] [Google Scholar]
- 13.Dutar P, Petrozzino JJ, Vu HM, Schmidt MF, Perkel DJ. Slow synaptic inhibition mediated by metabotropic glutamate receptor activation of GIRK channels. J Neurophysiol. 2000;84(5):2284–90. doi: 10.1152/jn.2000.84.5.2284. [DOI] [PubMed] [Google Scholar]
- 14.Dzubay JA, Otis TS. Climbing fiber activation of metabotropic glutamate receptors on cerebellar purkinje neurons. Neuron. 2002;36(6):1159–67. doi: 10.1016/s0896-6273(02)01052-8. [DOI] [PubMed] [Google Scholar]
- 15.Eaton SA, Salt TE. Role of N-methyl-d-aspartate and metabotropic glutamate receptors in corticothalamic excitatory postsynaptic potentials in vivo. Neuroscience. 1996;73:1–5. doi: 10.1016/0306-4522(96)00123-6. [DOI] [PubMed] [Google Scholar]
- 16.Ferraguti F, Shigemoto R. Metabotropic Glutamate Receptors. Cell Tissue Res. 2005;326(2):483–504. doi: 10.1007/s00441-006-0266-5. [DOI] [PubMed] [Google Scholar]
- 17.Golshani P, Warren RA, Jones EG. Progression of change in NMDA, non-NMDA, and metabotropic glutamate receptor function at the developing corticothalamic synapse. J Neurophysiol. 1998;80(1):143–54. doi: 10.1152/jn.1998.80.1.143. [DOI] [PubMed] [Google Scholar]
- 18.Govindaiah, Cox CL. Synaptic activation of metabotropic glutamate receptors regulates dendritic outputs of thalamic interneurons. Neuron. 2004;41:611–623. doi: 10.1016/s0896-6273(04)00013-3. [DOI] [PubMed] [Google Scholar]
- 19.Holmes KH, Keele NB, Arvanov VL, Shinnick-Gallagher P. Metabotropic glutamate receptor agonist-induced hyperpolarizations in rat basolateral amygdala neurons: receptor characterization and ion channels. J Neurophysiol. 1996;76:3059–3069. doi: 10.1152/jn.1996.76.5.3059. [DOI] [PubMed] [Google Scholar]
- 20.Huang YH, Sinha SR, Tanaka K, Rothstein JD, Bergles DE. Astrocyte glutamate transporters regulate metabotropic glutamate receptor-mediated excitation of hippocampal interneurons. J Neurosci. 2004;24(19):4551–9. doi: 10.1523/JNEUROSCI.5217-03.2004. [DOI] [PMC free article] [PubMed] [Google Scholar]
- 21.Kullmann DM, Lamsa K. Roles of distinct glutamate receptors in induction of anti-Hebbian long-term potentiation. J Physiol. 2008;586(6):1481–86. doi: 10.1113/jphysiol.2007.148064. [DOI] [PMC free article] [PubMed] [Google Scholar]
- 22.Lee CC, Sherman SM. Synaptic properties of thalamic and intracortical inputs to layer 4 of the first- and higher-order cortical areas in the auditory and somatosensory systems. J Neurophysiol. 2008;100:317–26. doi: 10.1152/jn.90391.2008. [DOI] [PMC free article] [PubMed] [Google Scholar]
- 23.Lee CC, Sherman SM. Glutamatergic inhibition in sensory neocortex. Cereb Cortex. 2009a;19:2281–9. doi: 10.1093/cercor/bhn246. [DOI] [PMC free article] [PubMed] [Google Scholar]
- 24.Lee CC, Sherman SM. Modulator property of the intrinsic cortical projection from layer 6 to layer 4. Front Syst Neurosci. 2009b;3:3. doi: 10.3389/neuro.06.003.2009. [DOI] [PMC free article] [PubMed] [Google Scholar]
- 25.Lee CC, Sherman SM. Topography and physiology of ascending streams in the auditory tectothalamic pathway. Proc Natl Acad Sci USA. 2010;107(1):372–7. doi: 10.1073/pnas.0907873107. [DOI] [PMC free article] [PubMed] [Google Scholar]
- 26.Lee CC, Lam YW, Sherman SM. Intracortical convergence of layer 6 neurons. NeuroReport. 2012;23(12):736–40. doi: 10.1097/WNR.0b013e328356c1aa. [DOI] [PMC free article] [PubMed] [Google Scholar]
- 27.Liu XB, Muñoz A, Jones EG. Changes in subcellular localization of metabotropic glutamate receptor subtypes during postnatal development of mouse thalamus. J Comp Neurol. 1998;395(4):450–65. doi: 10.1002/(sici)1096-9861(19980615)395:4<450::aid-cne3>3.0.co;2-0. [DOI] [PubMed] [Google Scholar]
- 28.Lujan R, Roberts JD, Shigemoto R, Ohishi H, Somogyi P. Differential plasma membrane distribution of metabotropic glutamate receptors mGluR1 alpha, mGluR2 and mGluR5, relative to neurotransmitter release sites. J Chem Neuroanat. 1997;13:219–241. doi: 10.1016/s0891-0618(97)00051-3. [DOI] [PubMed] [Google Scholar]
- 29.Martin LJ, Blackstone CD, Huganir RL, Price DL. Cellular localization of a metabotropic glutamate receptor in rat brain. Neuron. 1992;9(2):259–70. doi: 10.1016/0896-6273(92)90165-a. [DOI] [PubMed] [Google Scholar]
- 30.McCormick DA, von Krosigk M. Corticothalamic activation modulates thalamic firing through glutamate “metabotropic” receptors. Proc Natl Acad Sci USA. 1992;89:2774–8. doi: 10.1073/pnas.89.7.2774. [DOI] [PMC free article] [PubMed] [Google Scholar]
- 31.Niswender CM, Conn PJ. Metabotropic Glutamate Receptors: Physiology, Pharmacology, and Disease. Annu Rev Pharmacol Toxicol. 2010;50:295–322. doi: 10.1146/annurev.pharmtox.011008.145533. [DOI] [PMC free article] [PubMed] [Google Scholar]
- 32.Petrof I, Sherman SM. Synaptic properties of the mammillary and cortical afferents to the anterodorsal thalamic nucleus in the mouse. J Neurosci. 2009;29:7815–9. doi: 10.1523/JNEUROSCI.1564-09.2009. [DOI] [PMC free article] [PubMed] [Google Scholar]
- 33.Reichova I, Sherman SM. Somatosensory corticothalamic projections: distinguishing drivers from modulators. J Neurophysiol. 2004;92:2185–97. doi: 10.1152/jn.00322.2004. [DOI] [PubMed] [Google Scholar]
- 34.Romano C, Sesma MA, McDonald CT, O’Malley K, Van den Pol AN, Olney JW. Distribution of metabotropic glutamate receptor mGluR5 immunoreactivity in rat brain. J Comp Neurol. 1995;355(3):455–69. doi: 10.1002/cne.903550310. [DOI] [PubMed] [Google Scholar]
- 35.Sherman SM, Guillery RW. Exploring the Thalamus and its Role in Cortical Function. Cambridge, MA: MIT Press; 2006. [Google Scholar]
- 36.Shigemoto R, Kinoshita A, Wada E, Nomura S, Ohishi H, Takada M, Flor PJ, Neki A, Abe T, Nakanishi S, Mizuno N. Differential presynaptic localization of metabotropic glutamate receptor subtypes in the rat hippocampus. J Neurosci. 1997;17:7503–7522. doi: 10.1523/JNEUROSCI.17-19-07503.1997. [DOI] [PMC free article] [PubMed] [Google Scholar]
- 37.Viaene AN, Petrof I, Sherman SM. Synaptic properties of thalamic input to layers 2/3 and 4 of primary somatosensory and auditory cortices. J Neurophysiol. 2011a;105:279–92. doi: 10.1152/jn.00747.2010. [DOI] [PMC free article] [PubMed] [Google Scholar]
- 38.Viaene AN, Petrof I, Sherman SM. Synaptic properties of thalamic input to the subgranular layers of primary somatosensory and auditory cortices in the mouse. J Neurosci. 2011b;31(36):12738–47. doi: 10.1523/JNEUROSCI.1565-11.2011. [DOI] [PMC free article] [PubMed] [Google Scholar]
- 39.Viaene AN, Petrof I, Sherman SM. Properties of the thalamic projection from the posterior medial nucleus to primary and secondary somatosensory cortices in the mouse. Proc Natl Acad Sci USA. 2011c;108(44):18156–61. doi: 10.1073/pnas.1114828108. [DOI] [PMC free article] [PubMed] [Google Scholar]
- 40.Watkins JC, Evans RH. Excitatory amino acid transmitters. Annu Rev Pharmacol Toxicol. 1981;21:165–204. doi: 10.1146/annurev.pa.21.040181.001121. [DOI] [PubMed] [Google Scholar]
- 41.Zhuo FM, Hablitz JJ. Metabotropic glutamate receptor enhancement of spontaneous IPSCs in neocortical interneurons. J Neurophysiol. 1997;78(5):2287–95. doi: 10.1152/jn.1997.78.5.2287. [DOI] [PubMed] [Google Scholar]
- 42.Zucker RS, Regehr WG. Short-term synaptic plasticity. Annu Rev Physiol. 2002;64:355–405. doi: 10.1146/annurev.physiol.64.092501.114547. [DOI] [PubMed] [Google Scholar]
Associated Data
This section collects any data citations, data availability statements, or supplementary materials included in this article.